FBRT - Dueling Dividends
Summary
- We're contrasting two sets of investments where one is demonstrably better than the other.
- Market prices are not efficient. Sometimes investors leave a nice chunk of change on the table.
- We look for those opportunities to optimize investments so we can be positioned for some additional returns.
Get ready for charts, images, and tables because they are better than words. The ratings and outlooks we highlight here come after Scott Kennedy’s weekly updates in the REIT Forum. Your continued feedback is greatly appreciated, so please leave a comment with suggestions.
In this article I want to share part of the research I published for subscribers in A New Record for Preferred share Insanity . That article was massive, so I'm just going to pull a few sections.
PMT Preferred Shares
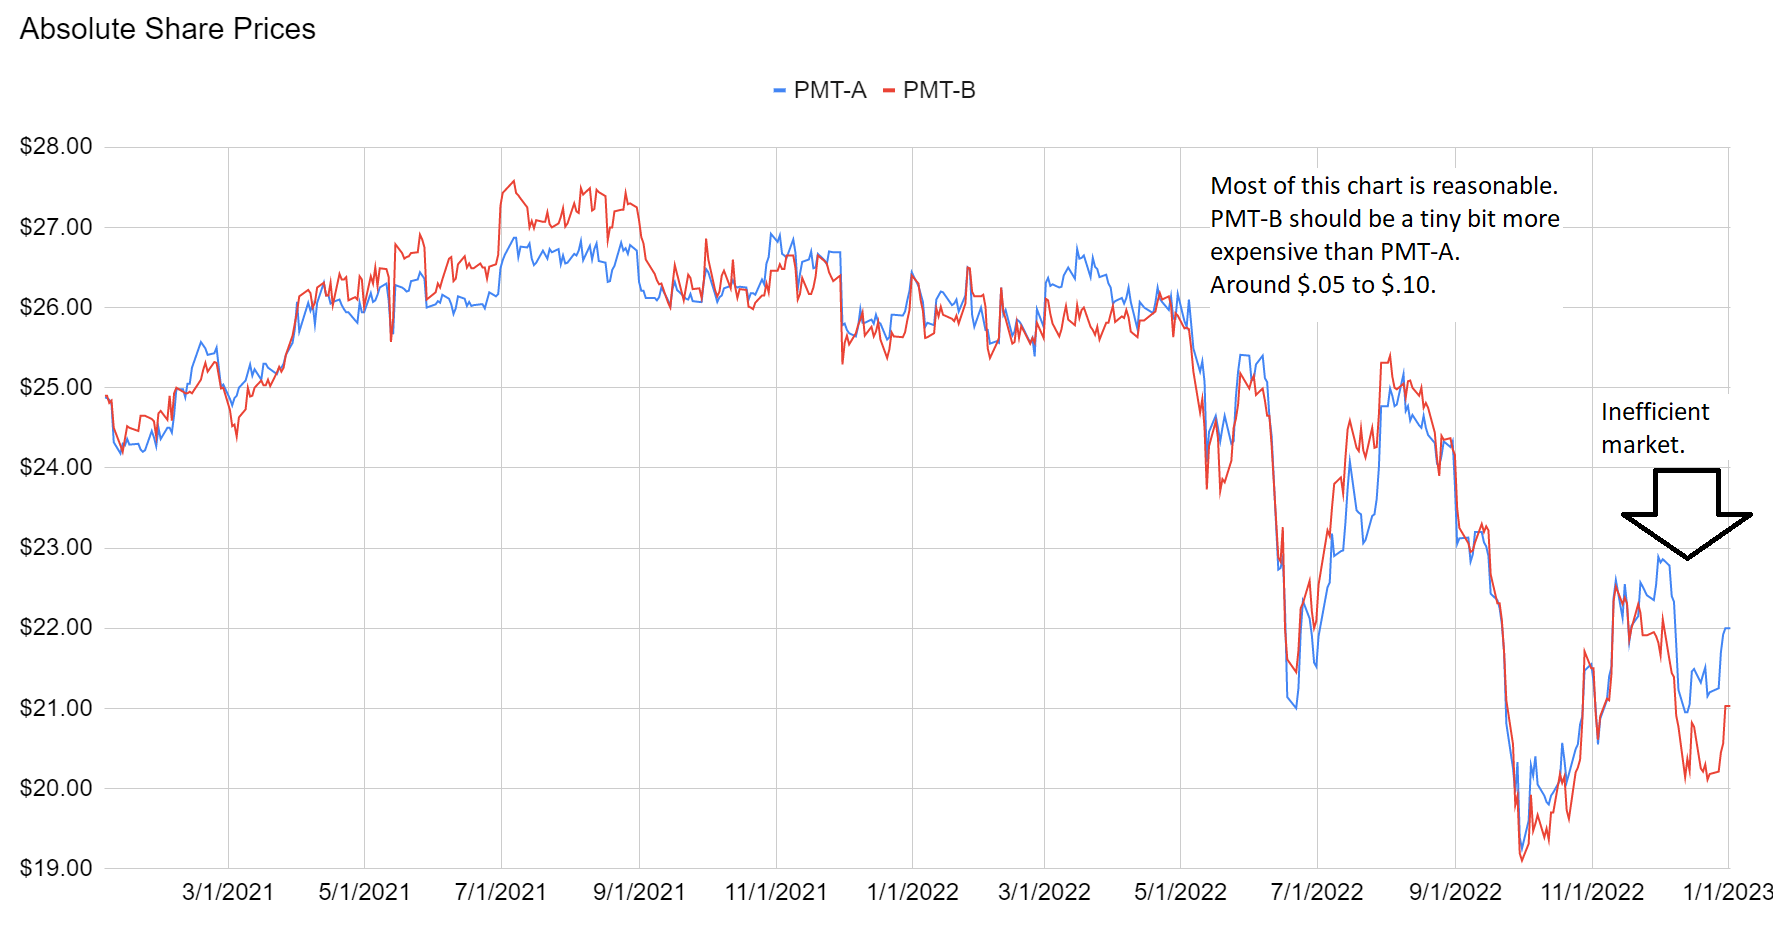
PMT-B ( PMT.PB ) is a better deal than PMT-A ( PMT.PA ). This failure started in late November 2022:
The REIT Forum
PMT-B offers a slightly lower coupon rate (8% vs 8.125%). However, PMT-B has a higher floating spread (5.99% vs 5.831%). Since the floating spread probably lasts longer, that goes slightly in favor of PMT-B. The small weakness for PMT-B is that it doesn’t float until 6/15/2024 whereas PMT-A floats on 3/15/2024. Sure, you probably want the earlier floating date. Floating three months earlier is probably worth about $.17. That's almost enough to offset PMT-B’s edge with the better floating spread, so targets are very similar.
However, PMT-B is $21.03 , and PMT-A is $22.00 . That’s dumb. PMT-B should be worth a tiny bit more than PMT-A. Some investors can argue that PMT-A should be worth a tiny bit more. However, there’s no good argument for a difference of $.97. Investors in PMT-A should be thrilled to swap to PMT-B if they can get a difference remotely close to $.97.
Note: We’re leaving out PMT-C because we want to compare fixed-to-floating shares to other fixed-to-floating shares when possible.
Update
This was sent to subscribers on January 2nd, 2023. The spread today is a bit thinner, but there it remains actionable. There were a few great days for the trade this week.
- As of January 3rd, the spread was $.92.
- As of January 4th, the spread was $1.19.
- As of January 5th, the spread was $1.29. (Massive!)
- As of January 6th, the spread was $.80 with PMT-B at $22.13 and PMT-A at $22.90.
CHMI Preferred Shares
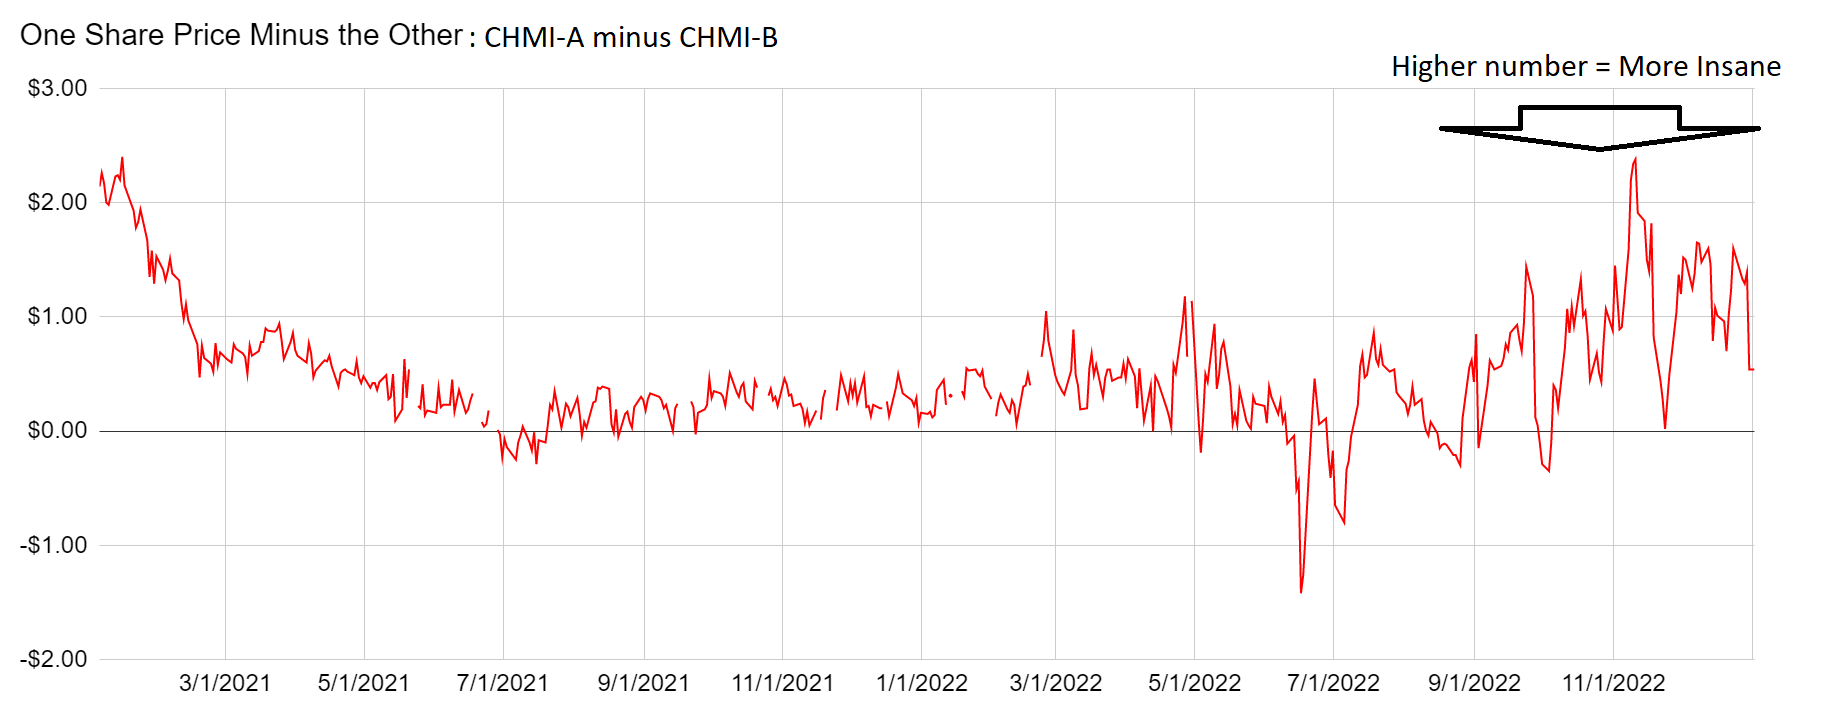
CHMI-B ( CHMI.PB ) is a better deal than CHMI-A ( CHMI.PA ), but it can get more insane. CHMI-A is a fixed-rate share and CHMI-B is a fixed-to-floating share. If short-term rates remain near current levels, CHMI-B’s dividend will increase significantly after shares begin floating on 4/15/2024. If short-term rates plunge, then CHMI-B loses. Eventually, we expect lower short-term rates. However, we don’t expect short-term rates to fall in the next two quarters. Further, the market is clearly pricing in the idea that rates remain elevated for longer than that.
Since CHMI-B has a very slightly higher dividend rate ($2.0625 vs. $2.05) and begins floating in 16 months, it would seem that CHMI-B would have the higher share price. Yet CHMI-A’s price at $20.49 is $.54 above CHMI-B at $19.95 . That seems like it would be an automatic swap for anyone in CHMI-B. However, the price chart indicates that the gap may actually widen again. The gap has been larger than $1.30 frequently in the last two months. Consequently, investors may want to look for a gap closer to $1.20 to make the swap.
That’s playing greedy since CHMI-B should be the more expensive share, but the market has been rewarding that greed:
The REIT Forum
Given that recent price chart, I’d be inclined to think investors may be rewarded for looking for a bigger premium than $.50 to make that swap.
However, I feel compelled to point out that CHMI-A is a materially riskier and less appealing choice than many peers. Fundamentally, the valuation doesn’t make sense. It’s a fixed-rate share with a 4.0 risk rating trading at $20.49 for a 10.02% stripped yield.
Update
The spread today is wider than the $.54 from January 2nd, 2023.
- As of January 3rd, the spread was $.69.
- As of January 4th, the spread was $.16.
- As of January 5th, the spread was $.04.
- As of January 6th, the spread was $.75 with CHMI-A at $21.35 and CHMI-B at $20.60 .
What Else?
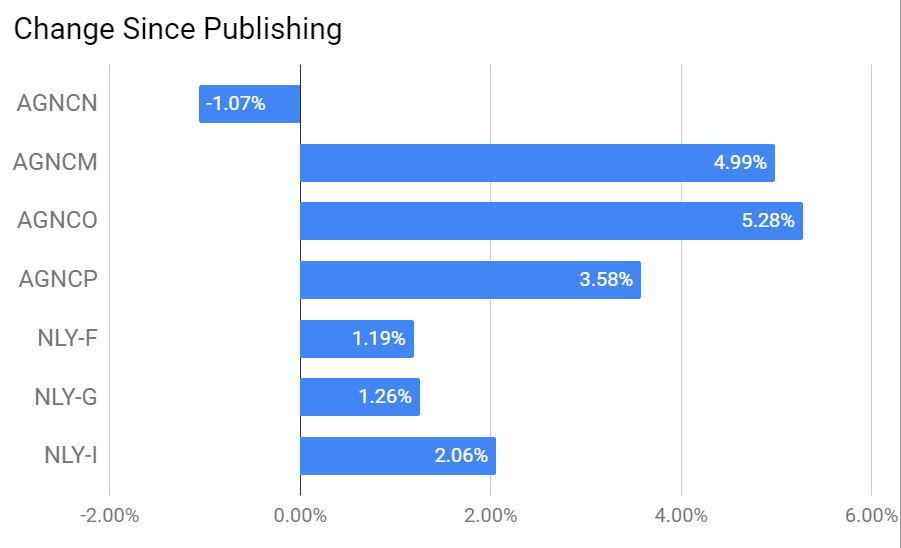
The biggest story was the gap in valuation between the various AGNC and NLY preferred shares. I'm working on how to trim the piece to fit in this series, but I'll probably just end up publishing a very long article.
The premise has partially played out, though there is still further to go:
The REIT Forum
I hope you'll enjoy learning about the math driving our research. Finding that kind of outperformance in such a short period is exceptional.
Stock Table
We will close out the rest of the article with the tables and charts we provide for readers to help them track the sector for both common shares and preferred shares.
We’re including a quick table for the common shares that will be shown in our tables:
| Type of REIT or BDC |
| Residential Agency |
| Residential Hybrid |
| Residential Originator and Servicer |
| Commercial |
| BDC |
Let the images begin!
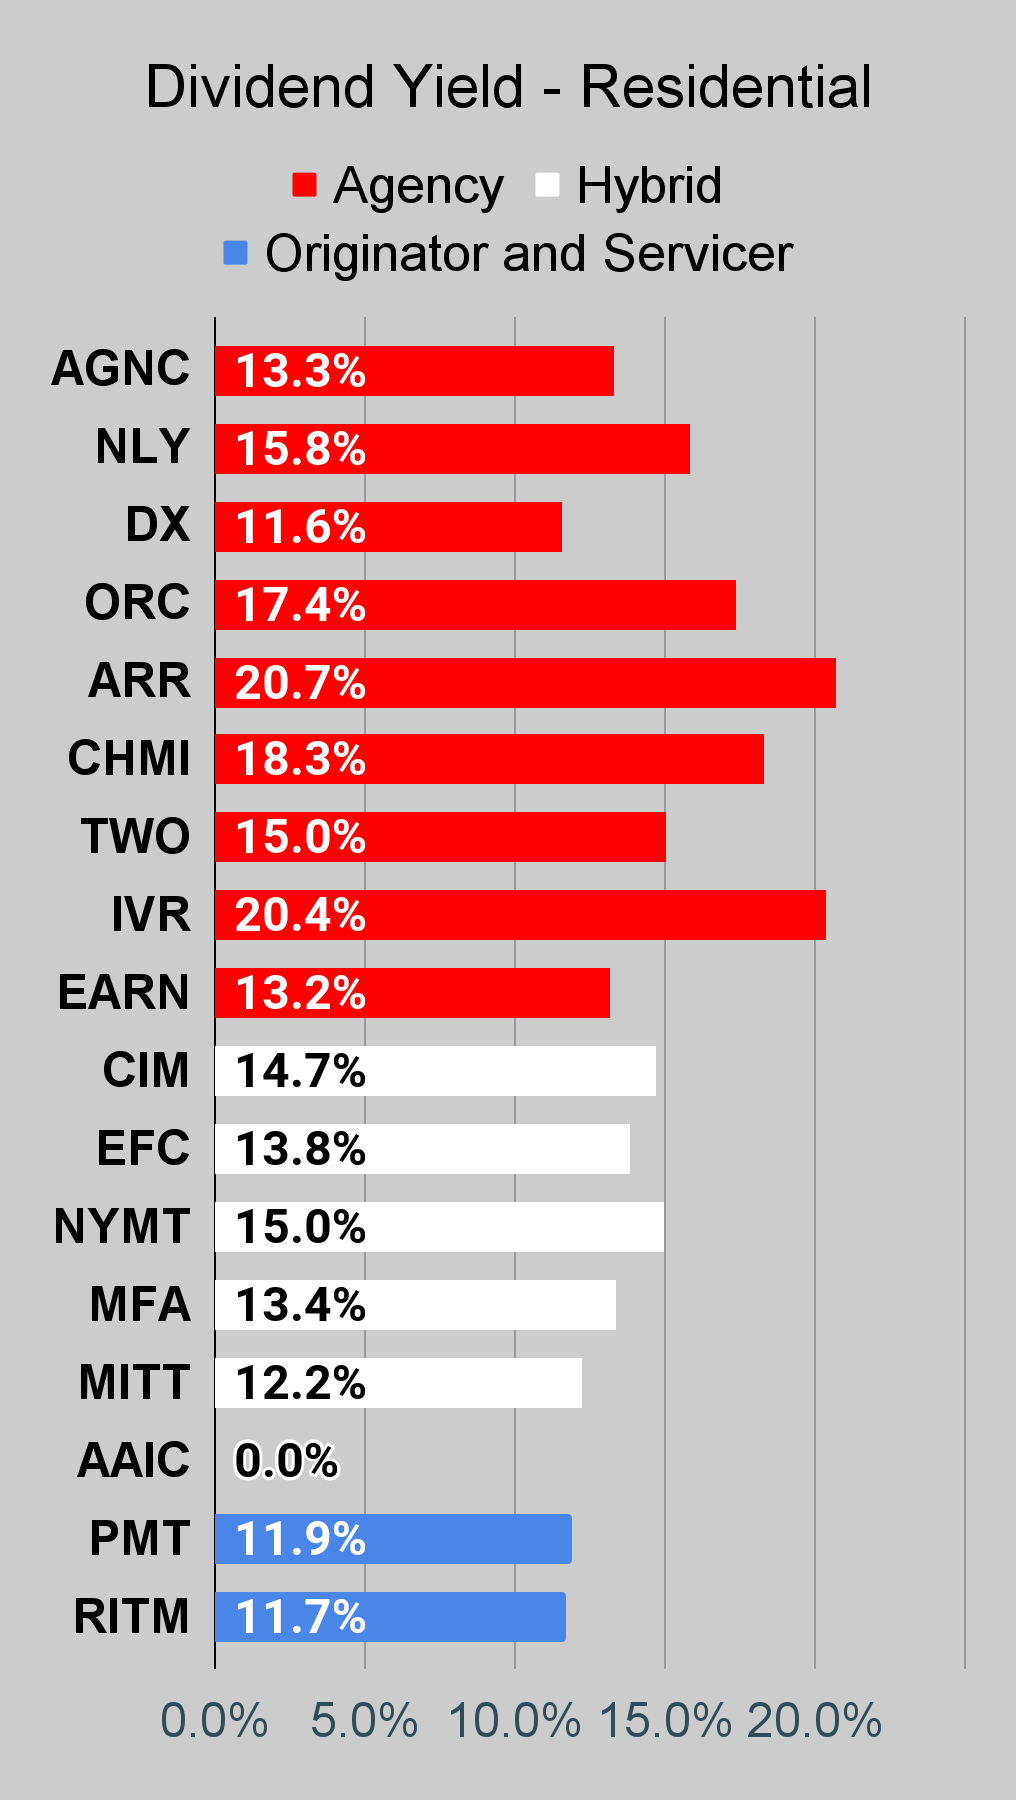
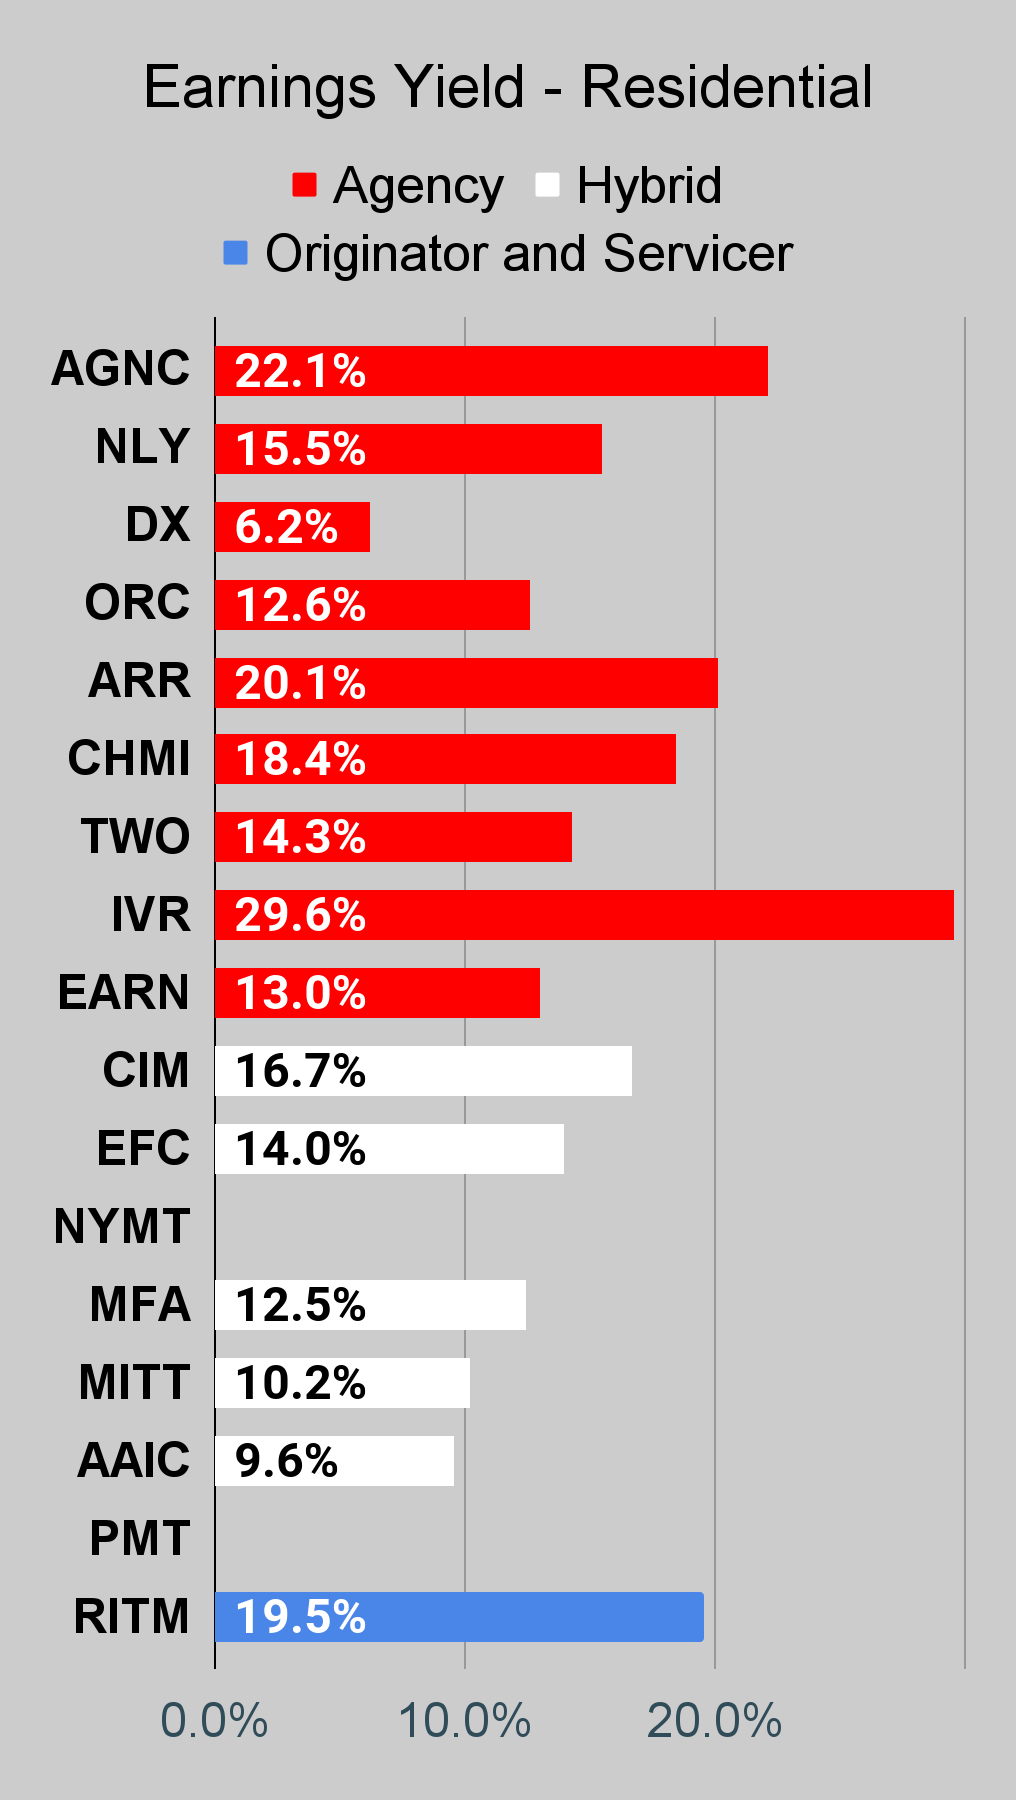
Residential Mortgage REIT Charts
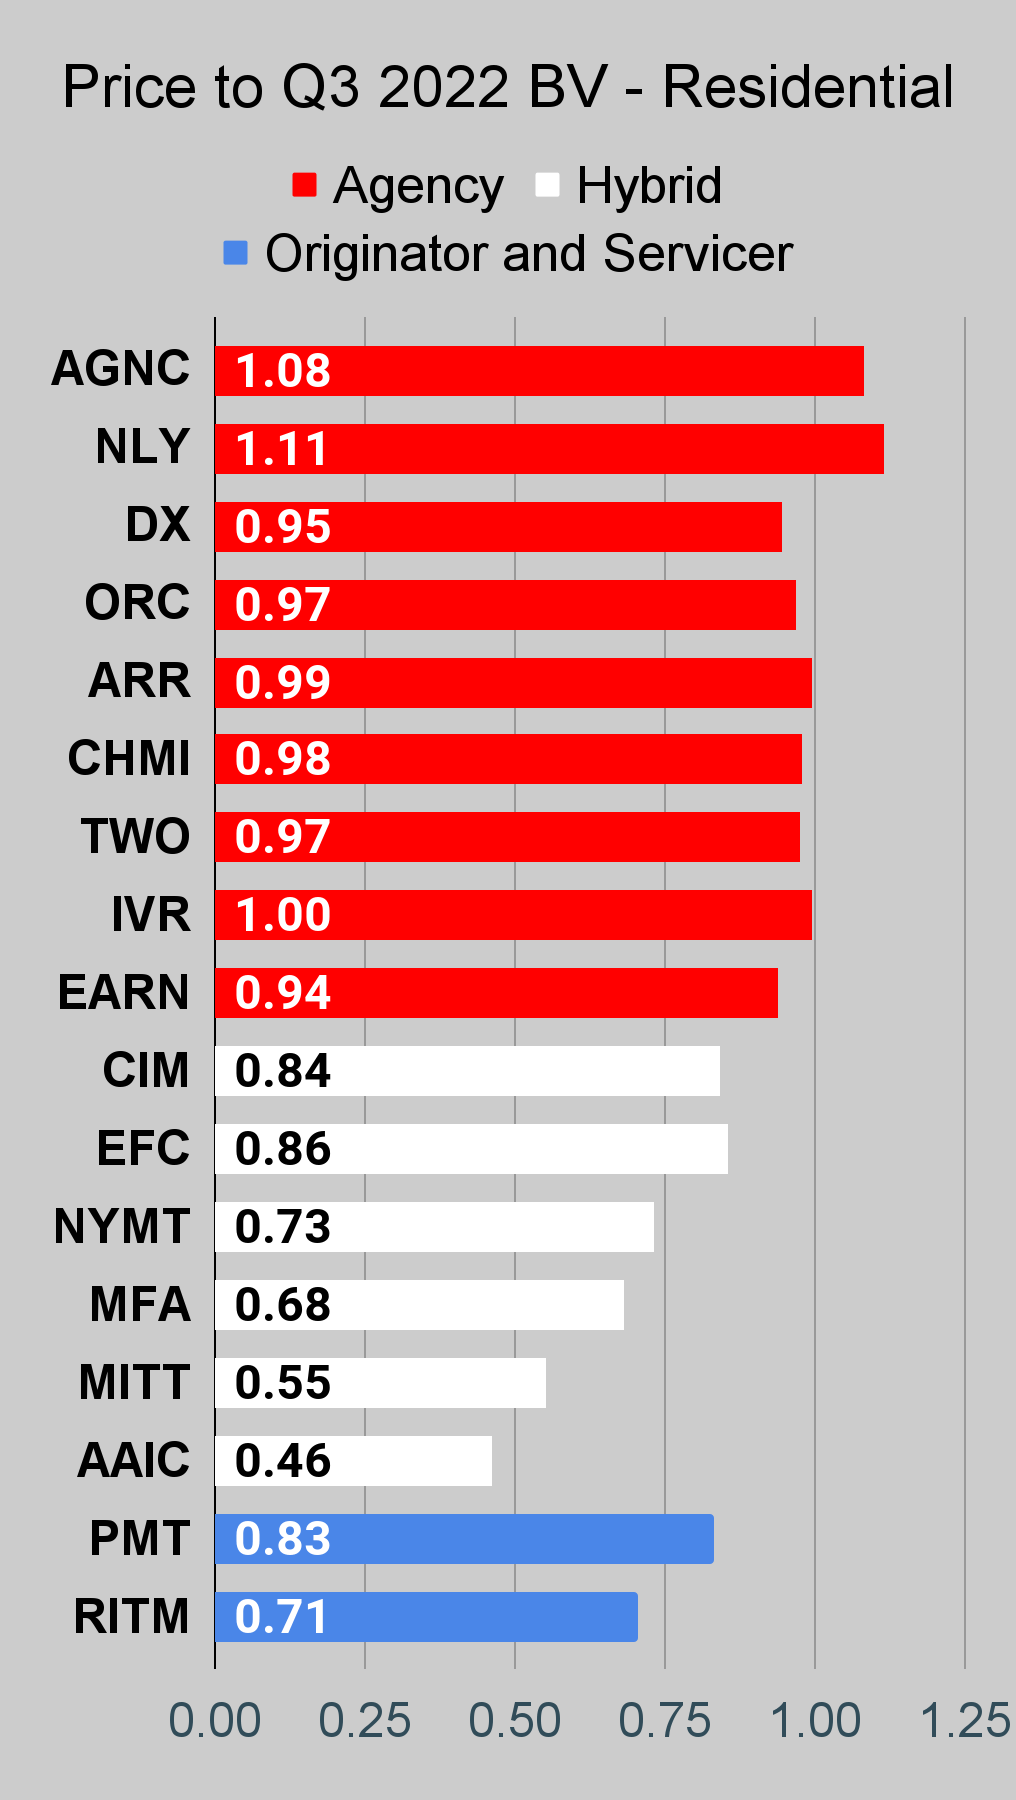
Note: The chart for our public articles uses the book value per share from the latest earnings release. Current estimated book value per share is used in reaching our targets and trading decisions. It's available in our service, but those estimates are not included in the charts below. PMT and NYMT are not showing an earnings yield metric as neither REIT provides a quarterly “Core EPS” metric.
Second Note: Due to the way historical amortized cost and hedging is factored into the earnings metrics, it is possible for two mortgage REITs with similar portfolios to post materially different metrics for earnings. I would be very cautious about putting much emphasis on the consensus analyst estimate (which is used to determine the earnings yield). In particular, throughout late 2022 the earnings metric became less comparable for many REITs.
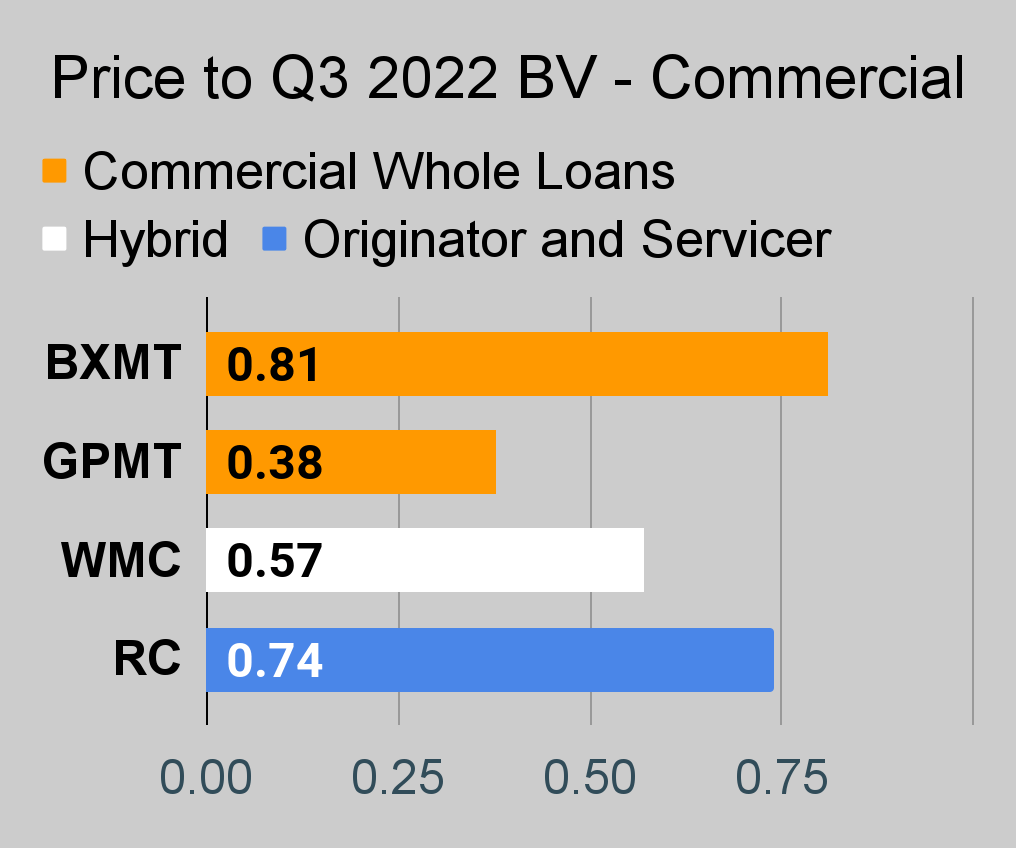
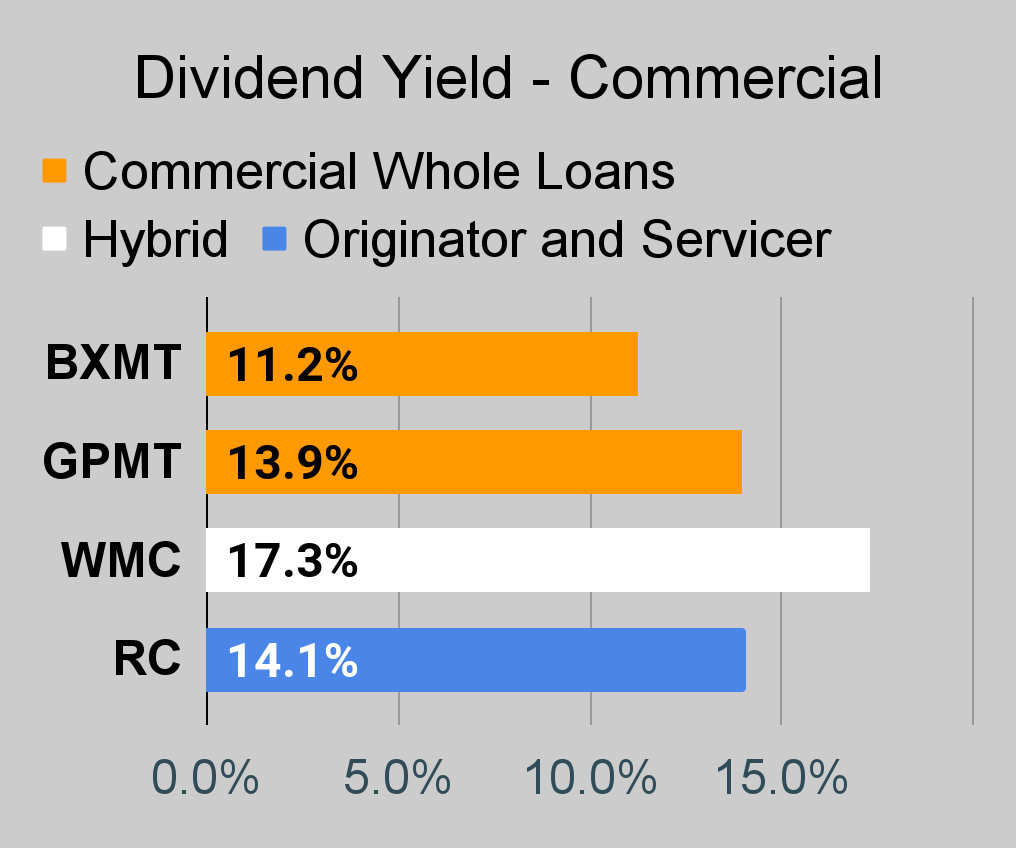
Commercial Mortgage REIT Charts
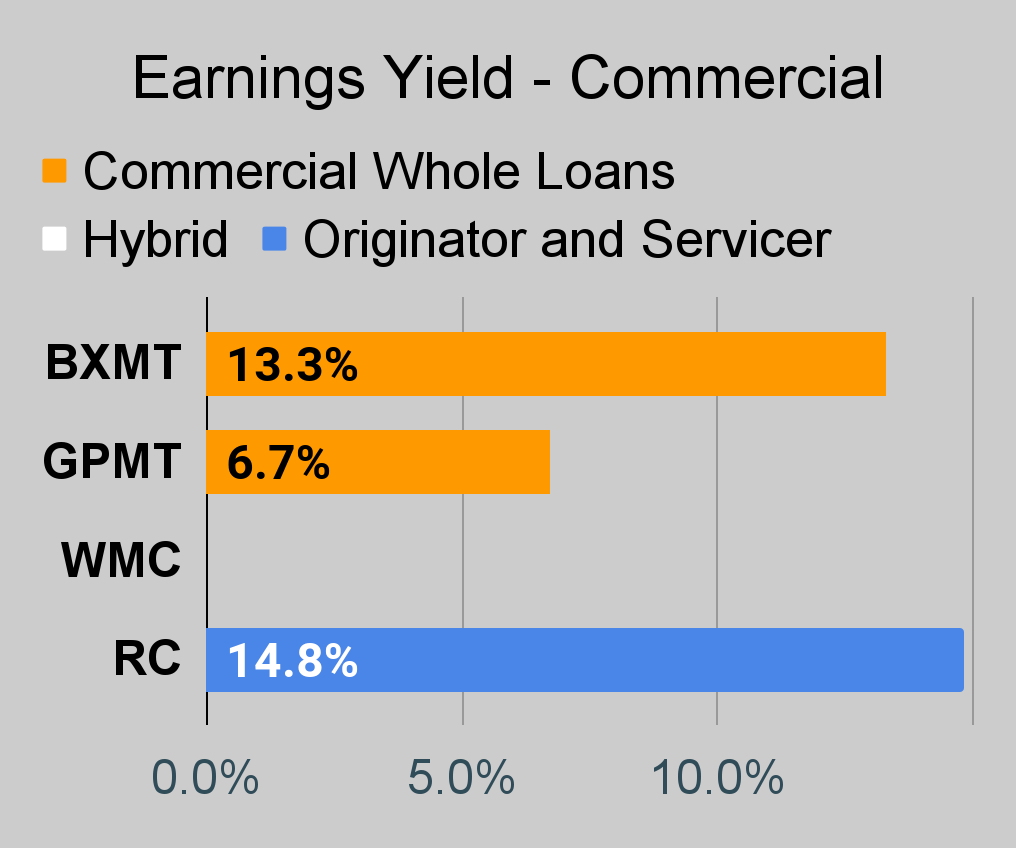
BDC Charts
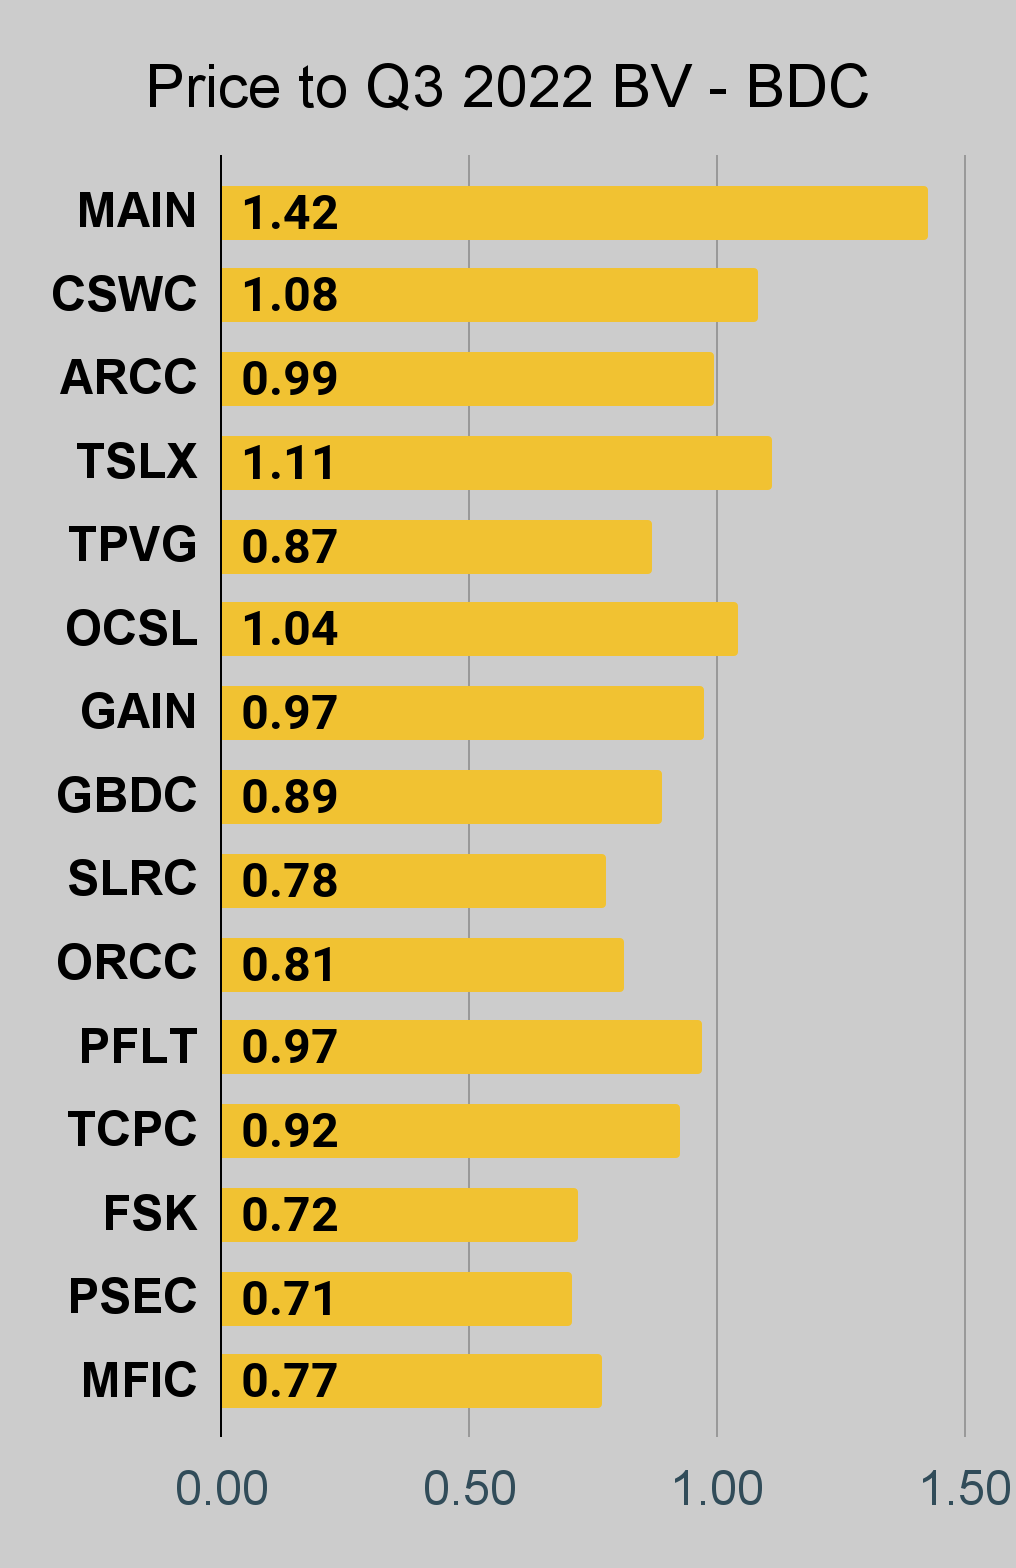
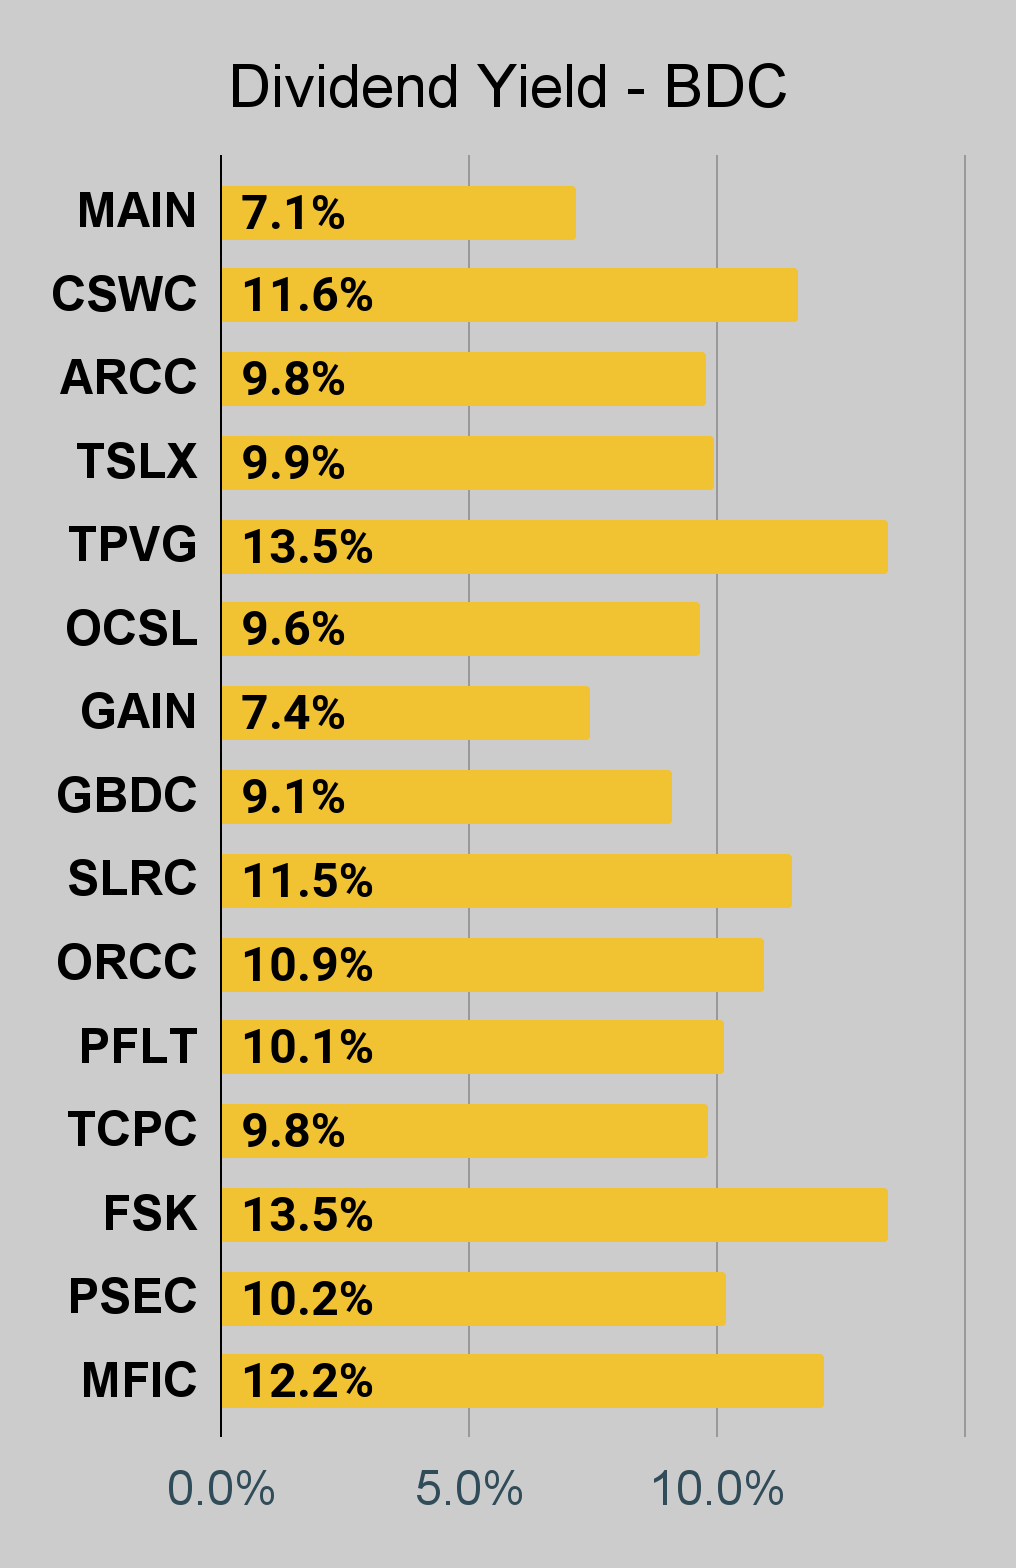
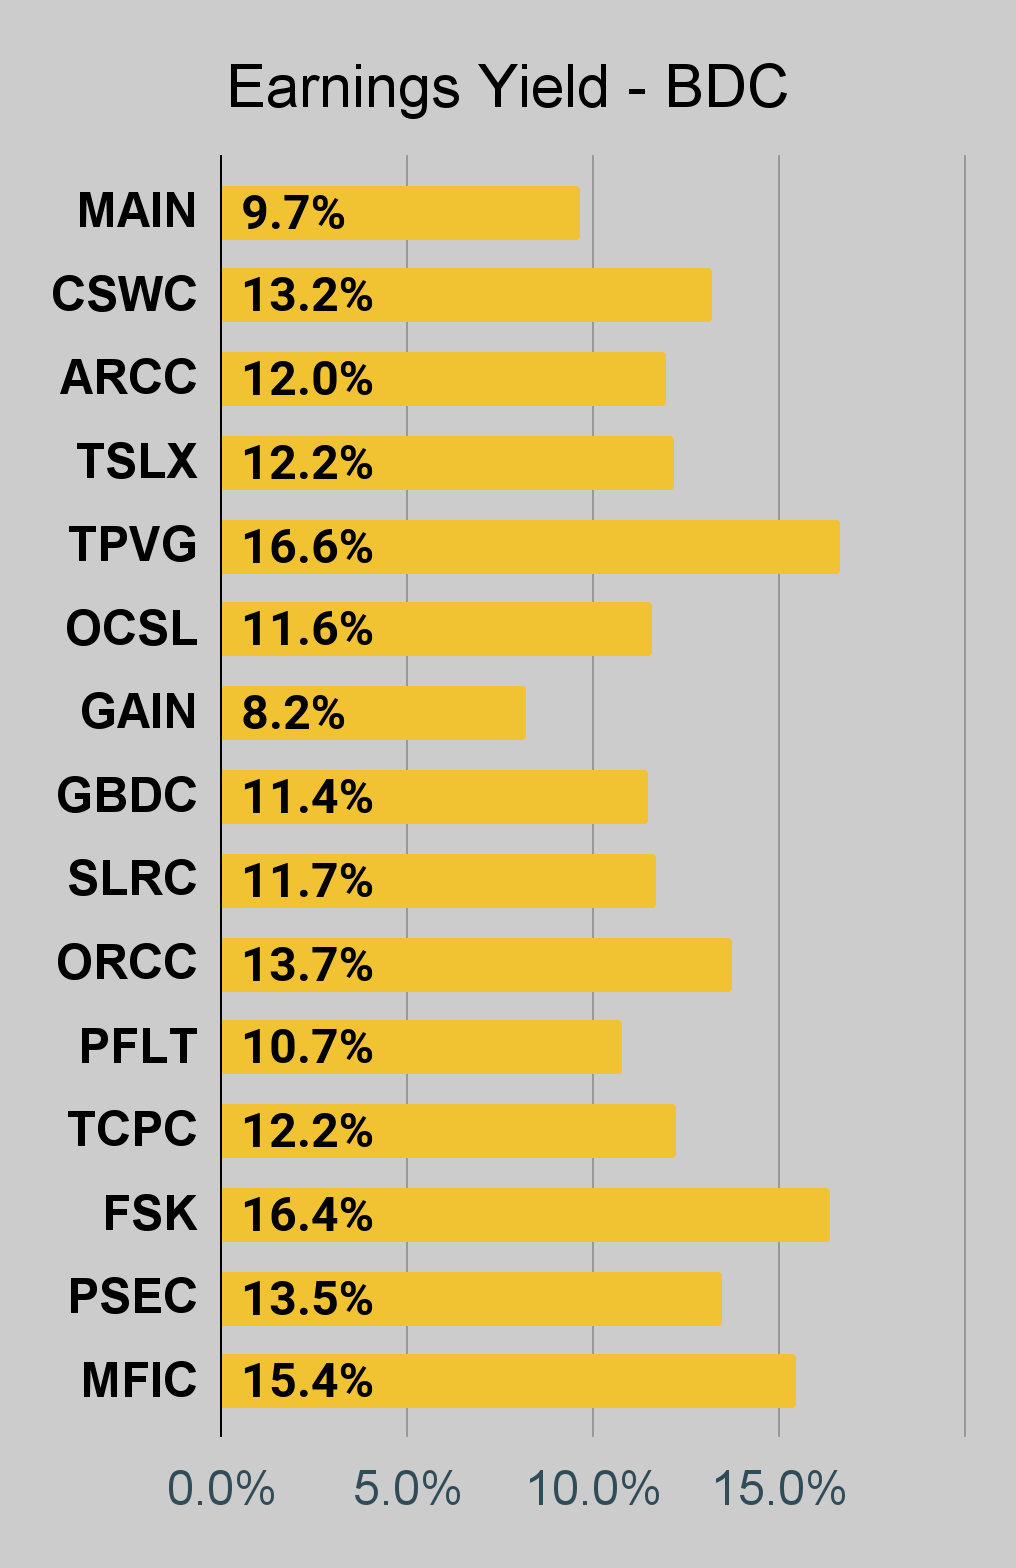
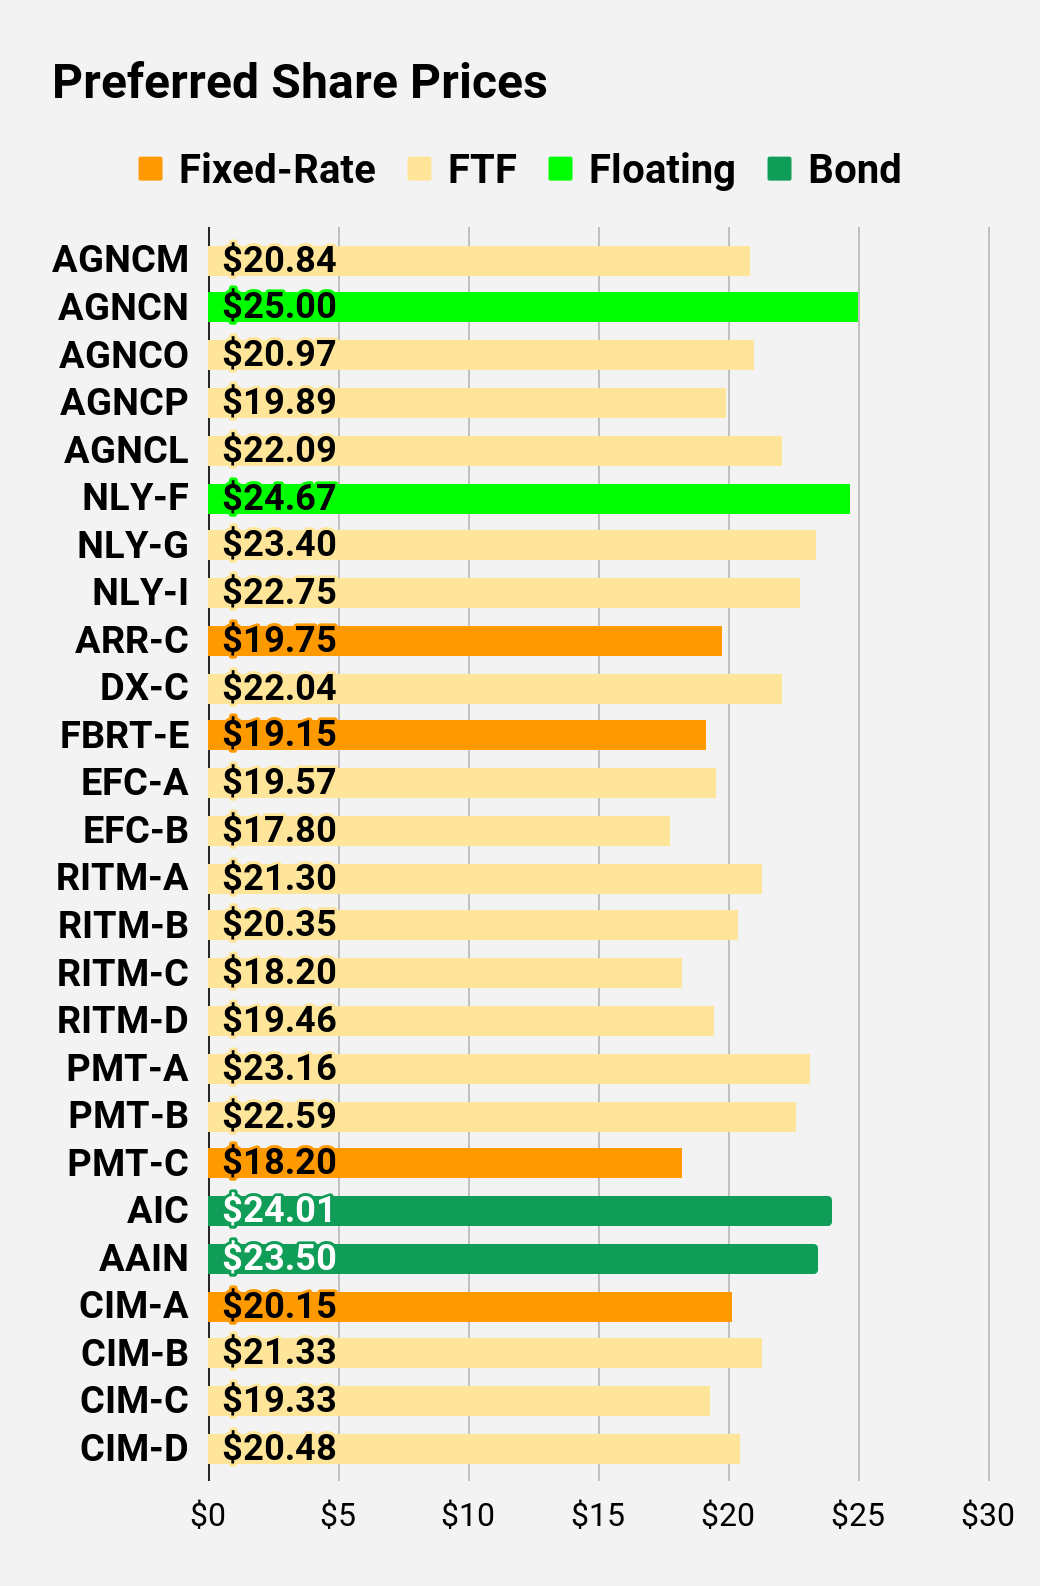
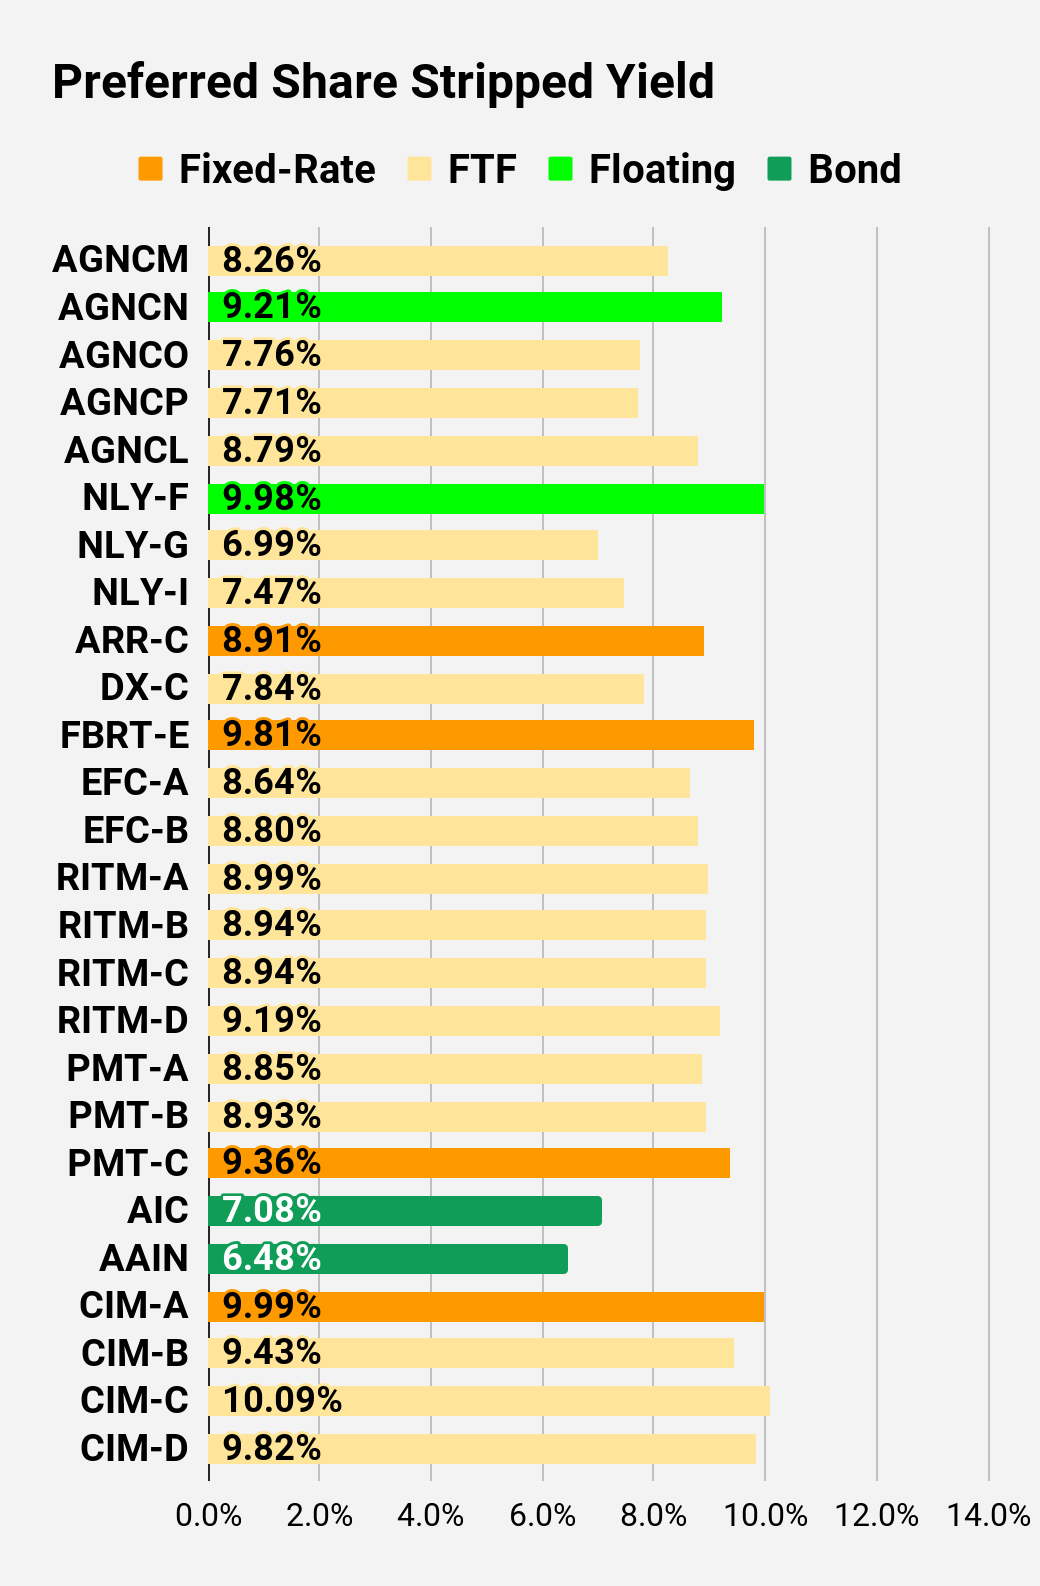
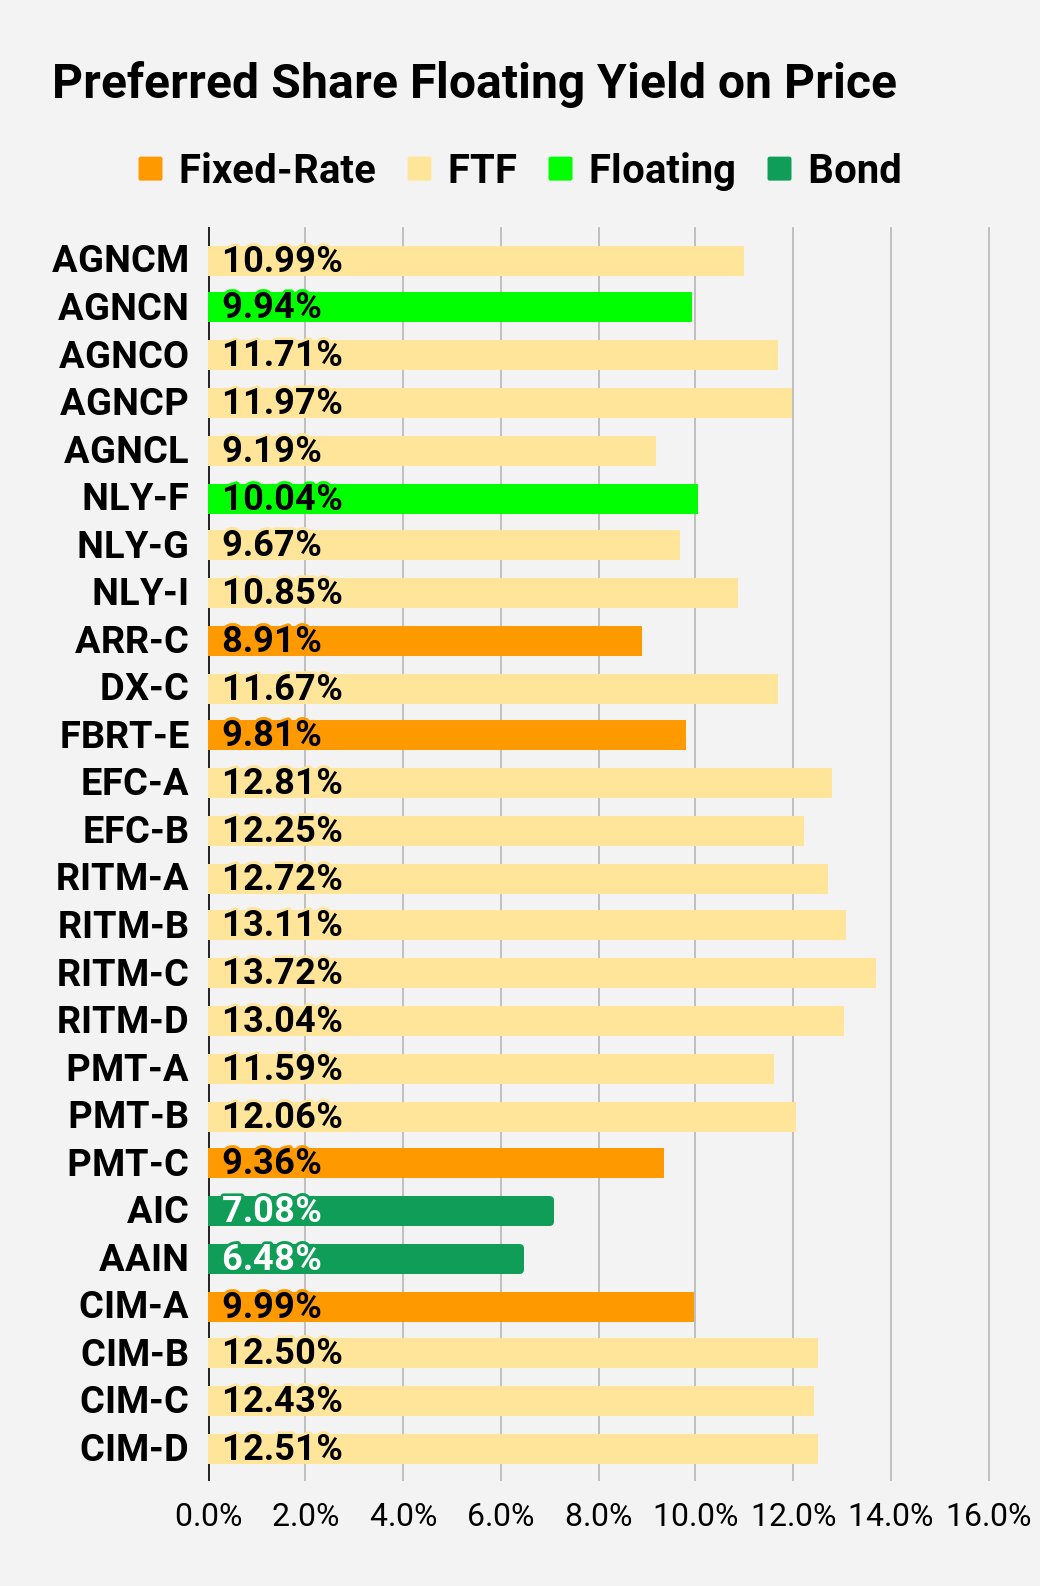
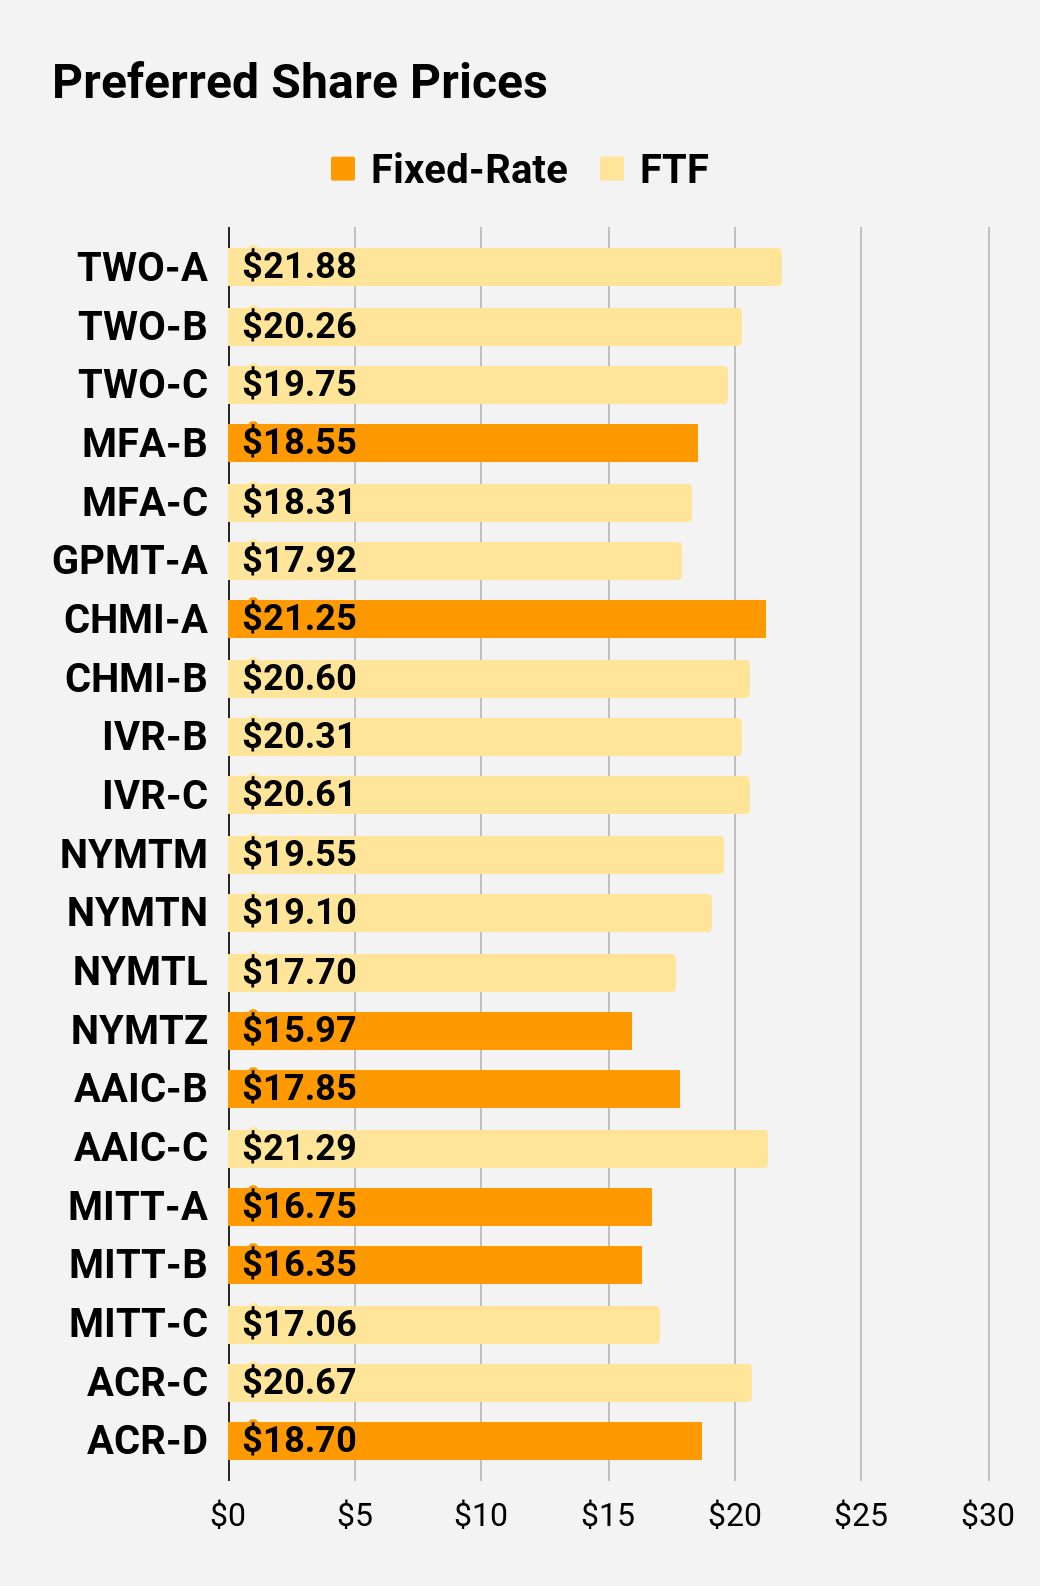
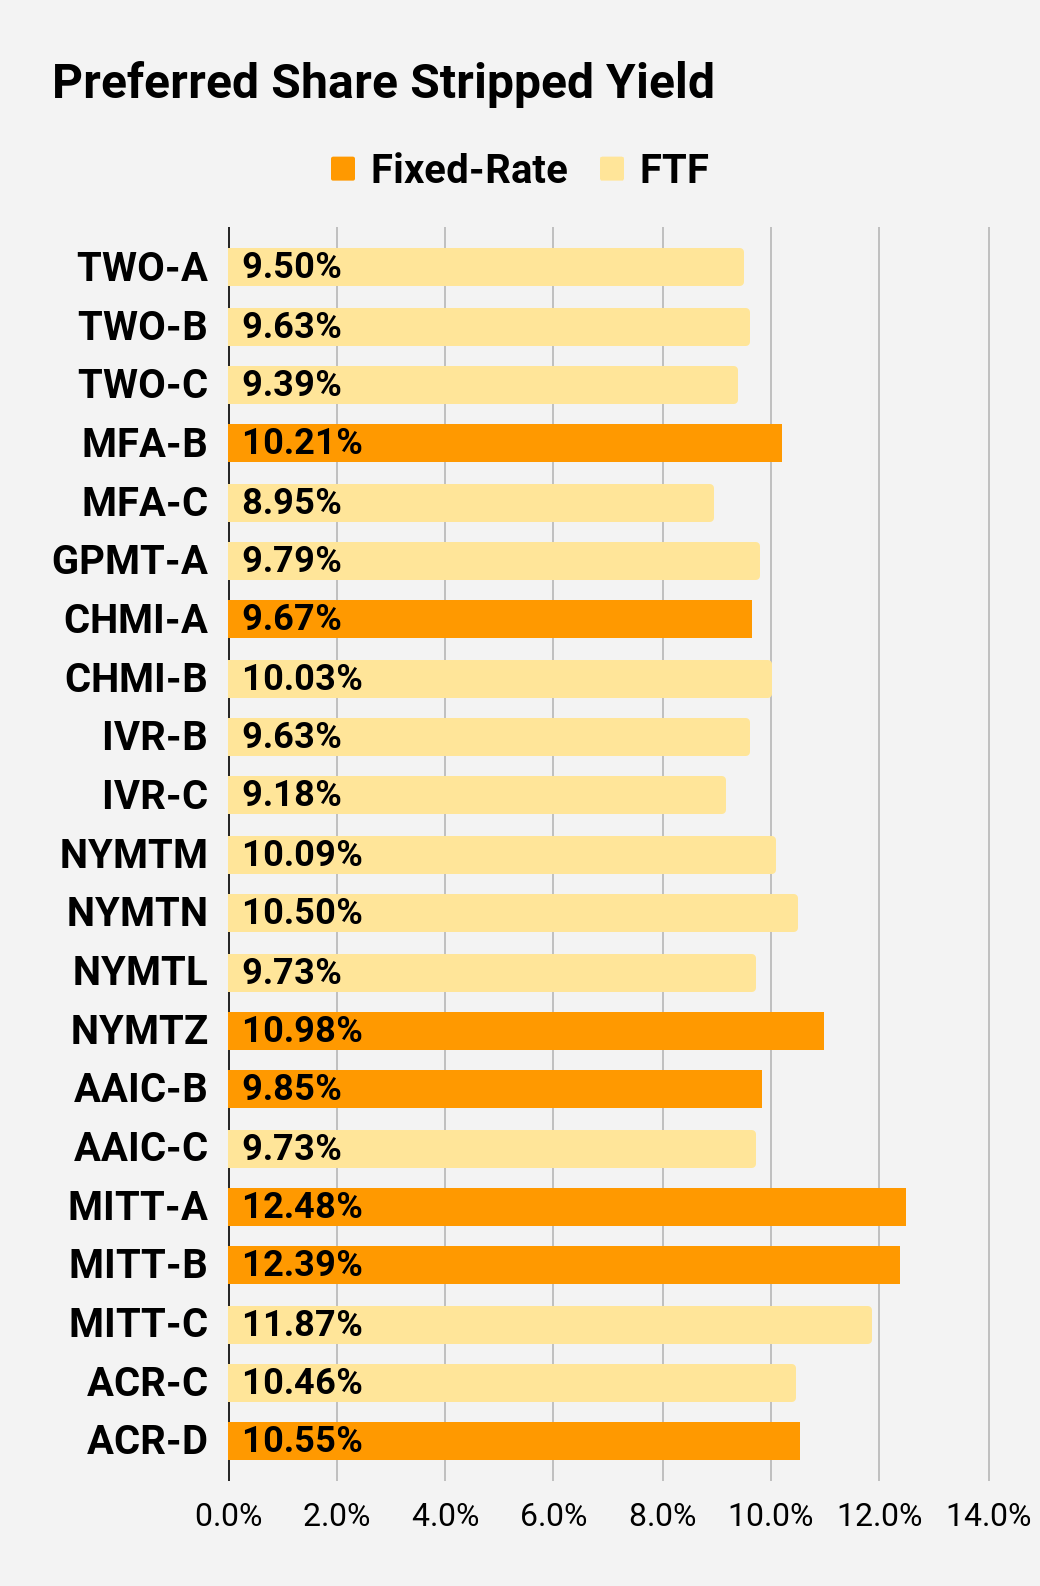
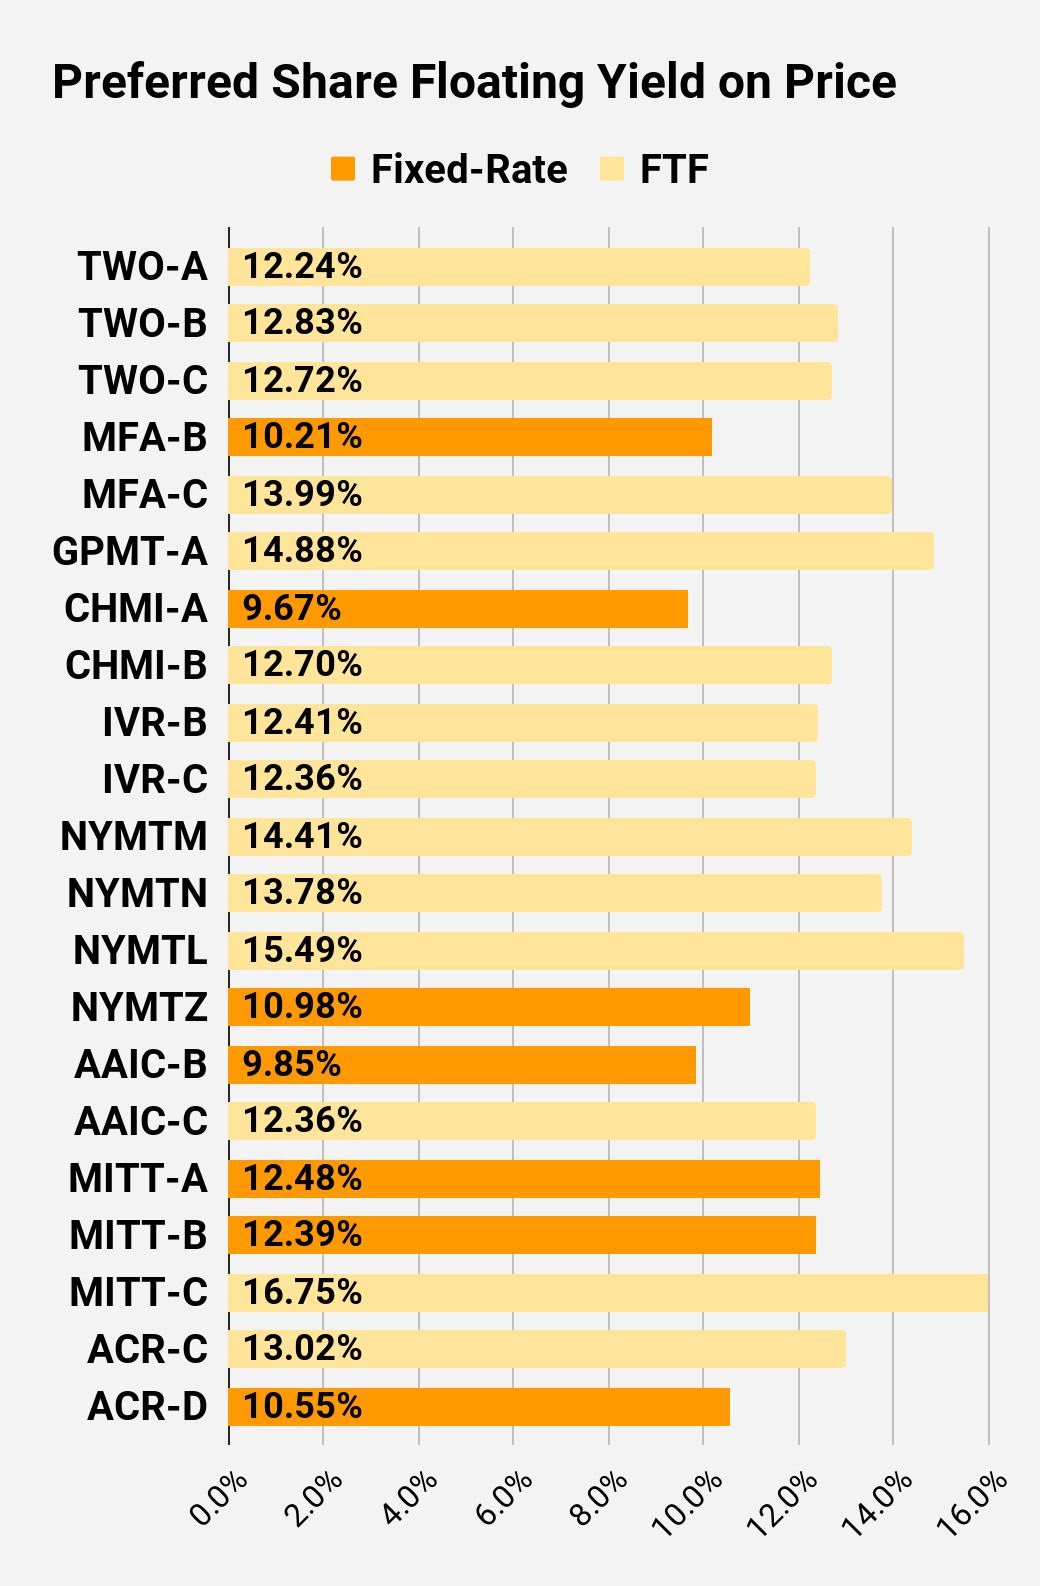
Preferred Share Charts
I changed the coloring a bit. We needed to adjust to include that the first fixed-to-floating shares have transitioned over to floating rates. When a share is already floating, the stripped yield may be different from the “Floating Yield on Price” due to changes in interest rates. For instance, NLY-F already has a floating rate. However, the rate is only reset once per three months. The stripped yield is calculated using the upcoming projected dividend payment and the “Floating Yield on Price” is based on where the dividend would be if the rate reset today. In my opinion, for these shares the “Floating Yield on Price” is clearly the more important metric.
Preferred Share Data
Beyond the charts, we’re also providing our readers with access to several other metrics for the preferred shares.
After testing out a series on preferred shares, we decided to try merging it into the series on common shares. After all, we're still talking about positions in mortgage REITs. We don’t have any desire to cover preferred shares without cumulative dividends, so any preferred shares you see in our column will have cumulative dividends. You can verify that by using Quantum Online. We’ve included the links in the table below.
To better organize the table, we needed to abbreviate column names as follows:
- Price = Recent Share Price - Shown in Charts
- BoF = Bond or FTF (Fixed-to-Floating)
- S-Yield = Stripped Yield - Shown in Charts
- Coupon = Initial Fixed-Rate Coupon
- FYoP = Floating Yield on Price - Shown in Charts
- NCD = Next Call Date (the soonest shares could be called)
- Note: For all FTF issues, the floating rate would start on NCD.
- WCC = Worst Cash to Call (lowest net cash return possible from a call)
- QO Link = Link to Quantum Online Page
| Ticker |
| Price |
| BoF |
| S-Yield |
| Coupon |
| FYoP |
| NCD |
| WCC |
| QO Link |
| P-Link |
| $20.84 |
| FTF |
| 8.26% |
| 6.88% |
| 10.99% |
| 4/15/2024 |
| $6.32 |
| $25.00 |
| Floating |
| 9.21% |
| 9.19% |
| 9.94% |
| 2/5/2023 |
| $0.14 |
| $20.97 |
| FTF |
| 7.76% |
| 6.50% |
| 11.71% |
| 10/15/2024 |
| $6.88 |
| $19.89 |
| FTF |
| 7.71% |
| 6.13% |
| 11.97% |
| 4/15/2025 |
| $8.56 |
| $22.09 |
| FTF |
| 8.79% |
| 7.75% |
| 9.19% |
| 10/15/2027 |
| $12.12 |
| $24.67 |
| Floating |
| 9.98% |
| 9.75% |
| 10.04% |
| 2/5/2023 |
| $0.58 |
| $23.40 |
| FTF |
| 6.99% |
| 6.50% |
| 9.67% |
| 3/31/2023 |
| $2.01 |
| $22.75 |
| FTF |
| 7.47% |
| 6.75% |
| 10.85% |
| 6/30/2024 |
| $4.78 |
| $19.75 |
| 8.91% |
| 7.00% |
| 8.91% |
| 1/28/2025 |
| $8.90 |
| $22.04 |
| FTF |
| 7.84% |
| 6.90% |
| 11.67% |
| 4/15/2025 |
| $6.84 |
| $19.15 |
| 9.81% |
| 7.50% |
| 9.81% |
| 2/5/2023 |
| $5.96 |
| $19.57 |
| FTF |
| 8.64% |
| 6.75% |
| 12.81% |
| 10/30/2024 |
| $8.46 |
| $17.80 |
| FTF |
| 8.80% |
| 6.25% |
| 12.25% |
| 1/30/2027 |
| $13.53 |
| $21.30 |
| FTF |
| 8.99% |
| 7.50% |
| 12.72% |
| 8/15/2024 |
| $7.00 |
| $20.35 |
| FTF |
| 8.94% |
| 7.13% |
| 13.11% |
| 8/15/2024 |
| $7.78 |
| $18.20 |
| FTF |
| 8.94% |
| 6.38% |
| 13.72% |
| 2/15/2025 |
| $10.41 |
| $19.46 |
| FTF |
| 9.19% |
| 7.00% |
| 13.04% |
| 11/15/2026 |
| $12.56 |
| $23.16 |
| FTF |
| 8.85% |
| 8.13% |
| 11.59% |
| 3/15/2024 |
| $4.38 |
| $22.59 |
| FTF |
| 8.93% |
| 8.00% |
| 12.06% |
| 6/15/2024 |
| $5.41 |
| $18.20 |
| 9.36% |
| 6.75% |
| 9.36% |
| 8/24/2026 |
| $13.03 |
| $24.01 |
| Bond |
| 7.08% |
| 6.75% |
| 7.08% |
| 2/5/2023 |
| $1.22 |
| $23.50 |
| Bond |
| 6.48% |
| 6.00% |
| 6.48% |
| 8/1/2023 |
| $2.62 |
| $20.15 |
| 9.99% |
| 8.00% |
| 9.99% |
| 2/5/2023 |
| $5.05 |
| $21.33 |
| FTF |
| 9.43% |
| 8.00% |
| 12.50% |
| 3/30/2024 |
| $6.17 |
| $19.33 |
| FTF |
| 10.09% |
| 7.75% |
| 12.43% |
| 9/30/2025 |
| $11.01 |
| $20.48 |
| FTF |
| 9.82% |
| 8.00% |
| 12.51% |
| 03/30/2024 |
| $7.02 |
Second Batch:
| Ticker |
| Price |
| BoF |
| S-Yield |
| Coupon |
| FYoP |
| NCD |
| WCC |
| QO Link |
| P-Link |
| $21.88 |
| FTF |
| 9.50% |
| 8.13% |
| 12.24% |
| 04/27/2027 |
| $12.26 |
| $20.26 |
| FTF |
| 9.63% |
| 7.63% |
| 12.83% |
| 07/27/2027 |
| $13.80 |
| $19.75 |
| FTF |
| 9.39% |
| 7.25% |
| 12.72% |
| 1/27/2025 |
| $9.34 |
| $18.55 |
| 10.21% |
| 7.50% |
| 10.21% |
| 2/5/2023 |
| $6.64 |
| $18.31 |
| FTF |
| 8.95% |
| 6.50% |
| 13.99% |
| 3/31/2025 |
| $10.35 |
| $17.92 |
| FTF |
| 9.79% |
| 7.00% |
| 14.88% |
| 11/30/2026 |
| $13.85 |
| $21.25 |
| 9.67% |
| 8.20% |
| 9.67% |
| 2/5/2023 |
| $3.79 |
| $20.60 |
| FTF |
| 10.03% |
| 8.25% |
| 12.70% |
| 4/15/2024 |
| $6.90 |
| $20.31 |
| FTF |
| 9.63% |
| 7.75% |
| 12.41% |
| 12/27/2024 |
| $8.59 |
| $20.61 |
| FTF |
| 9.18% |
| 7.50% |
| 12.36% |
| 9/27/2027 |
| $13.32 |
| $19.55 |
| FTF |
| 10.09% |
| 7.88% |
| 14.41% |
| 1/15/2025 |
| $9.39 |
| $19.10 |
| FTF |
| 10.50% |
| 8.00% |
| 13.78% |
| 10/15/2027 |
| $15.40 |
| $17.70 |
| FTF |
| 9.73% |
| 6.88% |
| 15.49% |
| 10/15/2026 |
| $13.75 |
| $15.97 |
| 10.98% |
| 7.00% |
| 10.98% |
| 1/15/2027 |
| $16.03 |
| $17.85 |
| 9.85% |
| 7.00% |
| 9.85% |
| 2/5/2023 |
| $7.24 |
| $21.29 |
| FTF |
| 9.73% |
| 8.25% |
| 12.36% |
| 3/30/2024 |
| $6.18 |
| $16.75 |
| 12.48% |
| 8.25% |
| 12.48% |
| 2/5/2023 |
| $8.49 |
| $16.35 |
| 12.39% |
| 8.00% |
| 12.39% |
| 2/5/2023 |
| $8.89 |
| $17.06 |
| FTF |
| 11.87% |
| 8.00% |
| 16.75% |
| 9/17/2024 |
| $11.41 |
| $20.67 |
| FTF |
| 10.46% |
| 8.63% |
| 13.02% |
| 7/30/2024 |
| $7.57 |
| $18.70 |
| 10.55% |
| 7.88% |
| 10.55% |
| 5/21/2026 |
| $12.82 |
Strategy
Our goal is to maximize total returns . We achieve those most effectively by including “trading” strategies. We regularly trade positions in the mortgage REIT common shares and BDCs because:
- Prices are inefficient.
- Long term, share prices generally revolve around book value.
- Short term, price-to-book ratios can deviate materially.
- Book value isn’t the only step in analysis, but it is the cornerstone.
We also allocate to preferred shares and equity REITs. We encourage buy-and-hold investors to consider using more preferred shares and equity REITs.
Performance
We compare our performance against four ETFs that investors might use for exposure to our sectors:
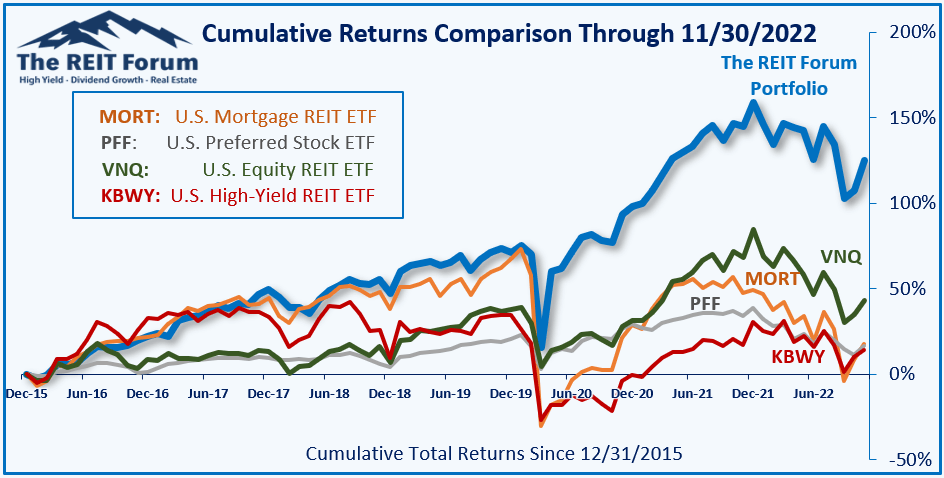
The REIT Forum
The four ETFs we use for comparison are:
| Ticker |
| Exposure |
| One of the largest mortgage REIT ETFs |
| One of the largest preferred share ETFs |
| Largest equity REIT ETF |
| The high-yield equity REIT ETF. Yes, it has been dreadful. |
When investors think it isn’t possible to earn solid returns in preferred shares or mortgage REITs, we politely disagree. The sector has plenty of opportunities, but investors still need to be wary of the risks. We can’t simply reach for yield and hope for the best. When it comes to common shares, we need to be even more vigilant to protect our principal by regularly watching prices and updating estimates for book value and price targets.
Ratings:
- PMT-B at $22.13 is better than PMT-A at $22.90.
- CHMI-B at $20.60 is better than CHMI-A at $21.35.
- AGNCN is still less attractive than AGNCM, AGNCN, and AGNCP.
Due to volatility in the shares, it might take some time to play out. However, the cash flow creates a very strong force over time.
For further details see:
Dueling Dividends