AVDV - DVYE: 10% Yield With 3 Red Flags
2023-12-05 17:49:33 ET
Summary
- iShares Emerging Markets Dividend ETF holds about 100 dividend stocks from emerging markets and has a 12-month trailing yield of 10.15%.
- The portfolio is well-diversified across sectors and holdings, and it overweights Brazil relative to China.
- However, I see 3 red flags for iShares Emerging Markets Dividend ETF: geopolitical risk, volatility, and capital decay.
This article series aims at evaluating ETFs (exchange-traded funds) regarding past performance and portfolio metrics. Reviews with updated data are posted when necessary.
DVYE strategy and portfolio
iShares Emerging Markets Dividend ETF ( DVYE ) started investing operations on 02/23/2012 and tracks the Dow Jones Emerging Markets Select Dividend Index. It has 109 holdings, a 12-month trailing yield of 10.15%, and a total expense ratio of 0.49%. Dividends are paid quarterly.
As described by S&P Dow Jones Indices , the underlying index includes stocks incorporated in emerging markets (S&P Emerging BMI). Chinese companies must be listed in Hong Kong or the U.S. and not be classified as a real estate investment trust, or REIT.
At every annual reconstitution, eligible stocks must have:
- A positive earnings-per-share ratio ((TTM)).
- Paid dividends in each of the previous three years.
- At least US$ 250 million in float-adjusted market capitalization.
- At least US$ 2 million in 3-month average daily volume (US$ 500,000 for current constituents).
Then, eligible stocks are ranked by IAD yield. The top 100 are selected in the index, with a maximum of 30 stocks by country. Some rules defining a tolerance zone are applied for existing constituents to limit turnover.
Constituent are weighted based on IAD yield, with a maximum weight of 25% by country. A constituent may be excluded between reconstitutions if the company eliminates or drastically cuts its dividend, or if it is affected by a major corporate event like bankruptcy or delisting. The portfolio turnover rate was 55% in the most recent fiscal year.
In this article, I will use iShares MSCI Emerging Markets ETF ( EEM ) as a benchmark.
Asset value is about 47% in large caps, 34% in mid-cap companies and 19% in small caps. Brazil is the heaviest country (24%), ahead of China (19.1%) and Taiwan (16.7%). India comes in 4 th position at 10.6% and other countries are below 7%. The next chart lists the top countries, representing 94% of assets. Compared to the emerging market benchmark, DVYE massively overweights Brazil, underweights China, and totally ignores South Korea. The aggregate sum of China and Taiwan is above 35%, so exposure to geopolitical risks related to China remains very high, albeit lower than for EEM.
DVYE geographical allocation in % (Chart: author; data: iShares)
The three heaviest sectors are materials (20.9%), energy (16.6%) and financials (15.7%). Compared to EEM, DVYE overweights materials, energy, utilities, real estate, and to a lesser extent industrials. It underweights others sectors. It almost ignores consumer staples.
DVYE sector breakdown in % (Chart: author; data: iShares)
DVYE is much cheaper than EEM regarding valuation ratios, as reported in the next table.
| DVYE |
| EEM |
| Price / Earnings TTM |
| 6.37 |
| 12.33 |
| Price / Book |
| 0.77 |
| 1.47 |
| Price / Sales |
| 0.56 |
| 1.24 |
| Price / Cash Flow |
| 3.25 |
| 7.59 |
The top 10 holdings, listed below, represent 20.9% of asset value. The heaviest position weighs 3.4%, so risks related to individual companies are low.
| Name |
| Weight % |
| Country |
| Sector |
| Ticker |
| REC |
| 3.42 |
| India |
| Financials |
| RECLTD |
| PETROLEO BRASILEIRO PREF SA |
| 2.29 |
| Brazil |
| Energy |
| PETR4 |
| COMPANHIA DE SANEAMENTO DE MINAS G |
| 2.19 |
| Brazil |
| Utilities |
| CSMG3 |
| ASUSTEK COMPUTER INC |
| 2.12 |
| Taiwan |
| Technology |
| 2357 |
| SIMPLO TECHNOLOGY LTD |
| 1.88 |
| Taiwan |
| Technology |
| 6121 |
| SITRONIX TECHNOLOGY CORP |
| 1.83 |
| Taiwan |
| Technology |
| 8016 |
| GRUPA KETY SA |
| 1.82 |
| Poland |
| Materials |
| KTY |
| COAL INDIA LTD |
| 1.8 |
| India |
| Energy |
| COALINDIA |
| T3EX GLOBAL HOLDINGS CORP |
| 1.78 |
| Taiwan |
| Industrials |
| 2636 |
| CPFL ENERGIA SA |
| 1.76 |
| Brazil |
| Utilities |
| CPFE3 |
Past performance compared to competitors
The next table compares DVYE performance since inception with the benchmark EEM and two emerging markets dividend funds:
- WisdomTree Emerging Markets High Dividend ETF ( DEM )
- WisdomTree Emerging Markets SmallCap Dividend ETF ( DGS ).
| Since 3/1/2012 |
| Total Return |
| Annual Return |
| Drawdown |
| Sharpe |
| Volatility |
| DVYE |
| -9.47% |
| -0.84% |
| -47.42% |
| -0.01 |
| 18.13% |
| EEM |
| 11.69% |
| 0.94% |
| -39.82% |
| 0.1 |
| 17.13% |
| DEM |
| 16.73% |
| 1.32% |
| -45.21% |
| 0.11 |
| 17.54% |
| DGS |
| 52.44% |
| 3.65% |
| -44.08% |
| 0.24 |
| 16.83% |
Data calculated with Portfolio123.
As a reference, SPDR® S&P 500 ETF Trust (SPY) has returned 312.6% in the same time (12.8% annualized). DVYE has lost almost 10% since 3/1/2012, including dividends: it is the worst performance of the three funds. It also has the highest volatility and the deepest drawdown.
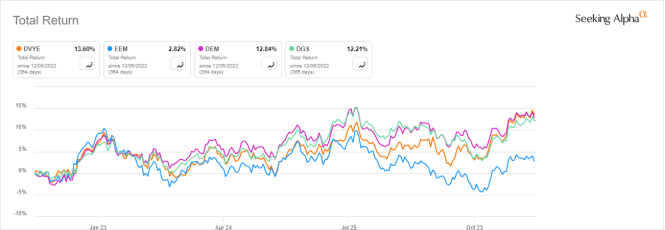
However, DVYE has been the best performer in the last 12 months, shortly ahead of the two other dividend funds:
DVYE vs competitors, 12-month return (Seeking Alpha)
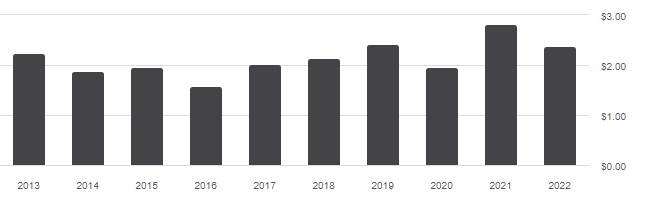
The annual sum of distributions went up from $2.24 in 2013 to $2.39 in 2022. This 6.7% increase in 9 years is far from offsetting the cumulative inflation: about 27% in the same time, based on CPI.
DVYE distribution history (Seeking Alpha)
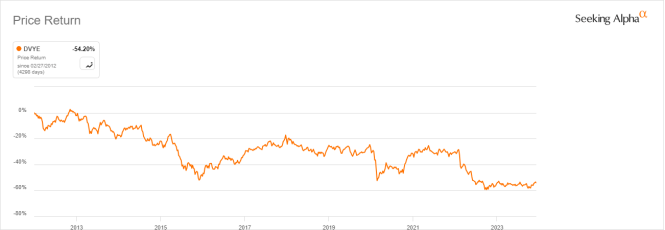
DVYE share price has lost 54% since inception, as shown on the next chart.
DVYE price return history (Seeking Alpha)
This issue is not specific to DVYE: most securities with yields above 6% suffer from capital decay.
Takeaway
iShares Emerging Markets Dividend ETF holds about 100 dividend stocks from emerging markets. It makes a larger part to Brazil than the emerging markets benchmark EEM does. The portfolio is well-diversified across sectors and holdings, with a tilt toward basic materials and energy.
I see three points of concern in this fund. First , geopolitical and regulatory risks: over one third of asset value is in China and Taiwan. Second , historical risk metrics (drawdown and volatility) are higher than for competitors. Third , capital decay since inception has resulted in a total return close to -10%. The share price has lost more than half of its value.
I think iShares Emerging Markets Dividend ETF may be used for trading or tactical allocation, but despite its high yield and good-looking valuation ratios, it is not a suitable long-term investment. DVYE is not unique in this regard: many high-yield instruments have been suffering significant capital decay. For investors looking for a global ex-U.S. dividend ETF, the Avantis International Small Cap Value ETF ( AVDV ), reviewed here , looks a better choice. It has a more attractive geographical allocation, a balanced sector breakdown, and some filters to avoid the most obvious high-yield traps.
DVYE vs AVDV, 3-year return (Seeking Alpha)
For further details see:
DVYE: 10% Yield With 3 Red Flags