PLDGP - EastGroup Properties: Wait For A Discount To Buy This Quality Industrial REIT
2023-09-21 03:14:09 ET
Summary
- EastGroup Properties develops and acquires multi-tenant distribution buildings in the Sunbelt.
- In the recent strong industrial market, EastGroup was able to raise face rents by 24.7% last year on rollovers.
- Nationally, industrial vacancies are still a low 3.7%, giving this REIT pricing power on leases.
- Vacancies are rising, though, as construction of new inventory is robust, especially in EastGroup’s markets.
- I estimate shares are 5.0-15.0% overvalued today, but could be very attractive in a market downturn.
EastGroup Properties, Incorporated ( EGP ) is a mid-cap REIT that develops, acquires and manages a portfolio of industrial buildings in "the Sunbelt States, with a specific focus on Florida, Texas, Arizona, California and North Carolina." It has regional offices in Los Angeles, Dallas and Atlanta, and is headquartered in Jackson, Mississippi. As of year-end 2022, the company owns 56.0 million square feet of multi-tenant industrial buildings with an occupancy rate of 98.7%. EGP specifically targets infill sites in markets that have an undersupply of space and about 34.0% of the company's net income is generated in the state of Texas. Moody's currently rates the company's debt as Baa2 and it is a member of the S&P Mid-Cap 400.
Shares of the company are currently priced at $176.86, down a considerable 22.4% from their peak of $227.95 in December 2021. The company's beta is 0.94 so it is slightly less volatile than the market.
Current Industrial Property Portfolio Of 56.0 Million SF
EastGroup owns 487 industrial properties and one office building across 11 states, with most of these in the south. About 90.0% of the portfolio is "business distribution buildings," of which the company has built 48.0%. Virtually all this space is concrete tilt-up and multi-tenant. Business distribution for EastGroup means the building is designed as a warehouse with a front façade of high profile office space that can also serve as a headquarters. EastGroup likes to build in industrial park settings.
The current portfolio is "449 distribution properties containing 51.2 million square feet, 14 bulk distribution properties containing 3.8 million square feet, and 25 business service properties containing 1.0 million square feet (which includes the one office building)." This portfolio is leased to about 1,600 tenants, and has a 98.7% occupancy rate. According to the company, no single tenant generates more than 2.0% of annualized base rents ((ABR)). No building represents more than 10% of ABR. Thus there is diversification in the geography, building profiles, and in the sheer number of tenants.
The company's properties typically have the specs listed below and are designed to be "last mile" distribution centers. They are near transportation hubs and in areas of new population growth, and are targeted to tenants in the 20,000 to 100,000 square foot range.
EastGroup Standard Building Specs (2022 Annual Report)
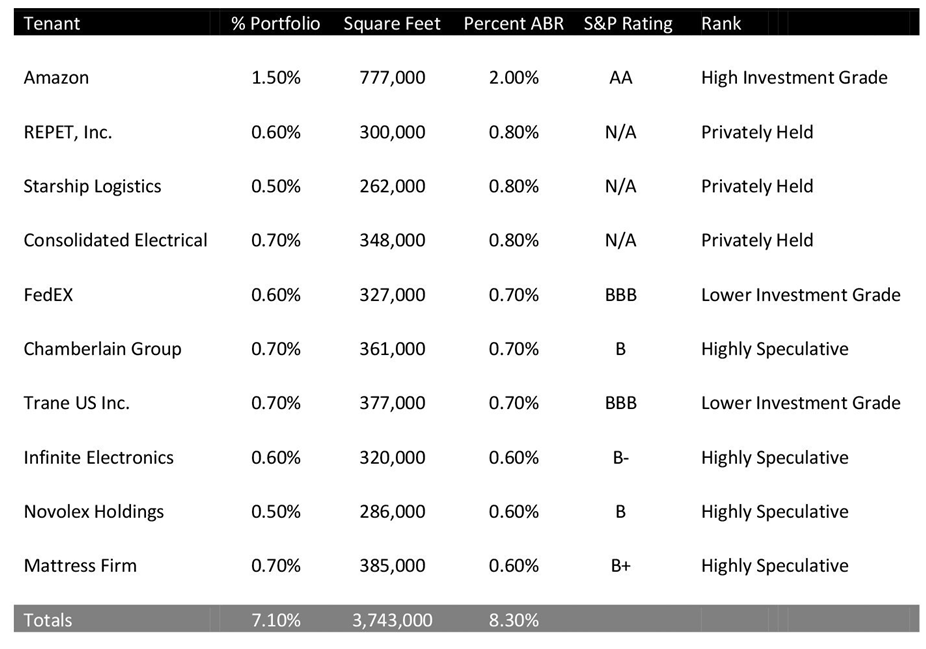
Listed below are EastGroup's top 10 tenants in terms of ABR. Many of the businesses are privately held, but Amazon ( AMZN ), FedEx ( FDX ), and Trane ( TT ) are publicly listed. These three tenants are investment grade, while many others in the top 10 list are speculative. The largest tenant, Amazon, has a very strong credit rating of AA, or high investment grade. I have listed here the Standard & Poor's ratings that I could for these tenants:
Top 10 Tenants by ABR (2022 Annual Report)
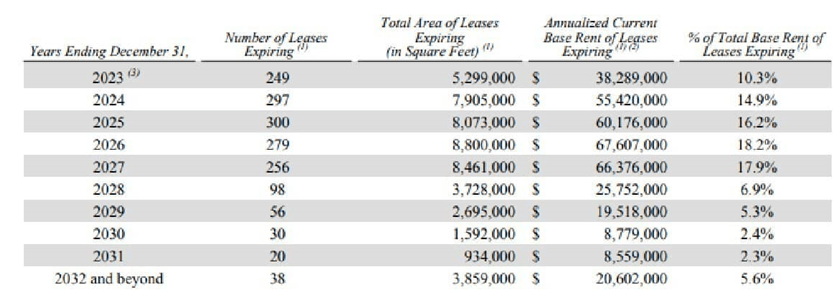
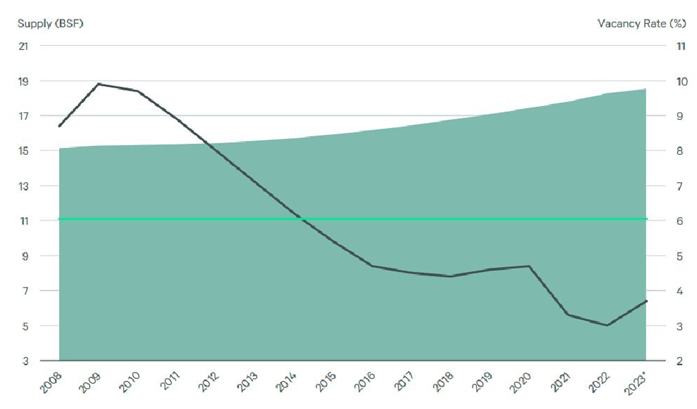
A fair number of leases expire in the next five years, and a schedule of lease expirations is provided below. This year 10.3% of the current leases are expiring, or about 5.7 million square feet. This particular year is not a concerning number for me as industrial vacancies nationally are only 3.7% as of July 2023, according to the CBRE Q2 2023 industrial outlook. That said, industrial vacancies have increased each of the last three quarters, although they remain below the 10-year national average of 4.7%. Historically this is quite low; in 2009 industrial vacancies rose to almost 20.0%. In today's market, rents are still rising and increased 9.9% nationally over the last year, so this is to EastGroup's advantage. The company is reporting that it has been able to increase rents on average by 24.7% on rollovers. This is because rents in the national industrial market have increased so rapidly that leases signed in the past are typically below market, even with escalation clauses.
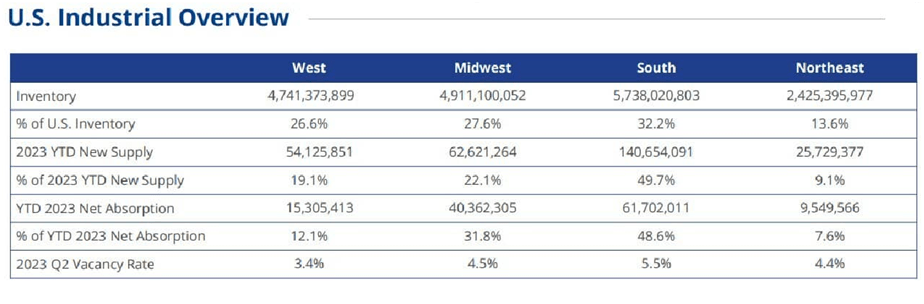
According to CBRE, though mid-year 2023, Dallas-Ft Worth was the top market for net absorption at 18.0 million square feet. Phoenix was the top market for new industrial construction nationally with 52.4 million square feet under way. This is only slightly less than the size of EastGroup's portfolio. These are both big markets for EastGroup.
Tenant Rollover Schedule (EGP 2022 Annual Report) National Industrial Vacancy and Supply (CBRE Industrial Outlook 2023)
Growing And Editing The Portfolio
EastGroup both acquires and develops distribution properties. As rents ramped up in 2019, it increased its acquisitions. This is illustrated below by year. In 2023, the company has significantly slowed the rate of new purchases as the market has begun to cool slightly.
2023 - 156,000 square feet
2022 - 1,076,000 square feet
2021 - 760,000 square feet
2020 - 347,000 square feet
2019 - 884,000 square feet
2018 - 512,000 square feet
In 2022, EastGroup bought 1,706,000 square feet of-in operation buildings and 456.3 acres of land to be held for future development. The total cost for this was $605,768,000.
The same year, the company also began construction of 14 design-build projects totaling 2.7 million square feet. Since 1996, it has built about 28.5 million square feet of warehouse distribution space. In 2022, EastGroup also started leasing at 19 projects it had built, containing 3.6 million square feet. The development cost was $461,329,000, or $128.14 per square foot.
During the year, EastGroup sold three in-operation distribution properties containing 287,000 square feet, which generated gross proceeds of $52,410,000, or $182.61 per SF. So far in 2023, it has acquired one in-operation building with 156,000 square feet for $217.95 or $32.0 million.
Rents Increases And Vacancies
Industrial Vacancies and Rents (Colliers)
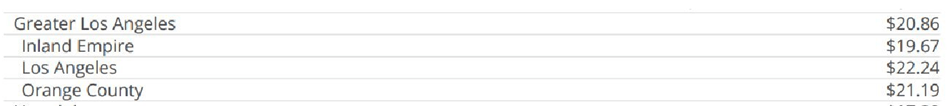
Space is tight in the industrial market. It's a good place for investors to be and rents increased by 9.9% nationally in 2022 per CBRE. EastGroup currently reports that its average rental rate per square foot was $7.06 in 2022, up 6.3% from $6.64 per square foot in 2021. This is for warehouse distribution buildings, which typically have a lower rental rate than manufacturing or flex buildings. According to Colliers Industrial Market Outlook for the second quarter 2023, Phoenix distribution space rents were $11.90 per SF, those in San Francisco were $15.24, San Diego's were $17.41, Las Vegas' were $12.75, and Los Angeles Inland Empire's were $19.67. These are all substantially above EastGroup's average rents of $7.06, so there is still a lot of room for increased income from rollovers as they occur. Below is a detail of Collier's current rent analysis for Los Angeles area markets.
Los Angeles Area Industrial Rents (Colliers Industrial Report 2023)
During 2022, EastGroup signed new leases on 9,220,000 square feet of operating properties, or 16.5% of the total square footage. For new and renewal leases signed during 2022, average face rental rates increased by 24.7%, compared to the former leases for the same space. The company says, however, that its strategy is to compete on location not on rents. While trends are positive overall, vacancy rates are beginning to rise in the industrial market. Below I have created a table of vacancy rate changes in EastGroup's major markets. They are rising in each of the 19 markets here except Denver, Charlotte, Orlando and Tampa.
Vacancies in EastGroup's Markets (Colliers Market Report and Author)
Notes On Lease Structure And Expirations
Most of the leases EastGroup signs are triple net. They require the tenants to pay their pro rata share of operating expenses, including real estate taxes, insurance and common area maintenance. The company notes that some tenants have this amount capped in their leases. The triple net aspect of the rent structure passes increases in operating costs and expenses resulting from inflation to the tenant. The typical lease term is five to ten years, with annual increases in rent. In the past these would be 3% per year, but more commonly in the market they are 4.0% today.
New Deliveries Are Changing The Market
As vacancies and interest rates dropped to new lows in 2020 and 2021, developers sensed opportunity. A lot of new buildings were approved. Construction time for warehouse distribution properties is typically 9-12 months not including the planning and entitlement time. This means that many of these new builds are starting to be delivered.
Per Colliers Industrial Market Outlook, in the first half of 2023, "supply outpaced demand significantly, with the gap expected to widen further as new developments are completed… During the second quarter, the market experienced unprecedented new project deliveries." A significant 280 million square feet of new projects have already been delivered nationally year-to-date and an additional 627 million square feet currently under construction. Colliers adds that the South is a particular focus of development activity, with over 80 million square feet delivered in the first half of the year and another 290 million square feet currently under construction. New deliveries of space nationally are significantly surpassing the space absorbed at a ratio of almost 3:1.
In 2021 and 2022, the national industrial market consistently absorbed over 100 million square feet every quarter. However, in 2023, absorption is not keeping pace with new supply.
Overview of Industrial Market (Colliers 2023 Q2 Report)
Shares Are Slightly Overvalued
In its Second Quarter 2023 results announcement, EastGroup said that FFO per share attributable to common stockholders for 2023 is now estimated to be in the range of $7.58 to $7.68. FFO is essentially the REIT cash flow and EastGroup, the company, publishes this metric in its annual and quarterly reports, but does not publish its Adjusted Funds From Operations ((AFFO)). The value of AFFO is obtained taking the FFO figure and subtracting recurring expenditures required to keep the properties running. Adjusted FFO is also a useful cross-check if it is reported.
EastGroup's FFO was $7.00 per share in 2022 and $6.09 in 2021, for an increase of 14.9%. The FFO was $5.28 in 2020 and $4.98 in 2019.
EastGroup's current share price is $176.87, which at a projected 2023 FFO of $7.63 is equal to a price/FFO multiple of 23.18. For the sake of valuation, let's look at the Price/FFO multiple of various other industrial REITs. I have excluded storage facility REITs from the analysis as they are a different breed. Below is a list of price to FFO multiples for nine different publicly listed industrial REITs of various market caps. If the chart says "N/A" the REIT did not publish the AFFO number. Unfortunately Prologis ( PLD ) and Rexford ( REXR ), which have similar product, do not publish AFFO numbers.
Excluding the EastGroup number as a comparable, the average multiple is 21.09 for the FFO group and 22.99 for the AFFO group. Again, FFO is projected to be $7.63 per share in 2023. I am expecting another Federal Reserve rate hike in 2023, so using the AFFO number to value the company and rounding it down to reflect this, I calculate the current value as 22.0 X $7.63 or $167.86. This would mean shares are overvalued by about 5.4%.
Price to FFO and AFFO Multiples (Author generated)
I have used an industrial market cap rate as a cross check to the FFO valuation. Lee & Associates publishes cap rate statistics in their North American Market Report Q1 2023. The national US index cap rate for industrial properties is 6.0%. In EastGroup's markets however, it was generally lower. In Phoenix the number was 5.4%; in Los Angeles it was 4.2%; in San Francisco 5.2%; and in San Diego 4.5%, so let's say an average of around 5.0%. So this calculation becomes $7.63/.05 = $152.60, lower still, making the current share price about 15.0% overvalued. Using the tow valuation methods here, I conclude that EastGroup shares are currently 5.0-15.0% overvalued.
Dividends Current And Past
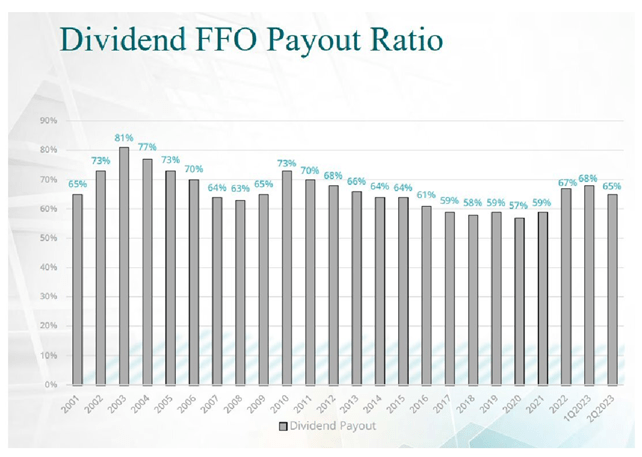
EastGroup has been paying a quarterly dividend since 1987. It began at $0.4333 per share and currently it is $1.25 per share. Along the way there were some interruptions in dividend increases. During the financial crisis of 2008-2010, the dividend was stuck at $0.52 from the first quarter of 2008 to September 2012. There was also a disruption during the time of the S&L crisis when the dividend was cut twice from $0.4333 to $0.25333, a decline of 41.5%. It stayed at this level for 4.5 years. While it was admirable that the company paid a dividend throughout the S&L crisis, this was a significant cut. The current payout ratio is a comfortable at 65.0% of FFO as illustrated below.
The company recently announced a dividend increase of 7.2% payable to shareholders in October. The new amount will be $1.27 per share quarterly. If we ignore the years when the dividend was cut or held fixed, I calculate the compound annual growth rate as 4.1% from 1987 to 2023, or about even with inflation over this time frame.
EastGroup Payout Ratio (2023 Investor Report)
At today's prices, the new yield will be 2.87%. I have gathered the dividend yields of EastGroup peers for the sake of comparison. If we rule out the extremes of Innovative industrial (IIPR) and Industrial Logistics (ILPT) the average yield is 3.04%, a bit above EastGroup's.
Dividend Yield of Peers (Author prepared)
Risks To Outlook
The company has relatively low debt, preferring to raise money through stock issuances. In 2023, there was a large issuance of $475.0 million while in 2022 there was a $75.0 million issuance. Debt is not an issue here, as you can see in the chart below. The primary risks for this industrial REIT are i) a recession which leads to higher vacancy rates in its core markets, and ii) an increase in the volume of new industrial buildings coming on the market. These items could reduce the pricing power that EastGroup has on increasing new rental rates. Also in 2026, the company has leases representing 18.2% of its annualized base rent expiring. Although this particular year in the future looks challenging, I believe the company's product profile of multi-tenant buildings, with spaces from 20,000 to 100,000 SF, helps mitigate this risk. Smaller tenant spaces in multi-tenanted buildings are less of a challenge to lease than a large, single-tenant industrial building which represents a larger commitment from a single tenant.
Current Debt and Capitalization (EGR 2023 Investor Presentation)
Conclusion
In many ways, EastGroup is an appealing company because of its simple business model of developing and acquiring multi-tenant distribution buildings in upscale industrial parks. They are well located infill properties in the path of population growth in major Sunbelt cities. The company consistently follows its business plan and has been successful doing so. In 2022, Funds from Operations ("FFO") were $7.00 per share versus $6.09 per share in 2021, an increase of 14.9%. This was the 12th consecutive year of FFO increases and the portfolio is currently leased to 98.7%. Because of the tight industrial market, the EastGroup was able to achieve substantial rent increases on new leases and renewals. I expect them to be able to continue to do this in 2024. There are many things to like about this company, however, shares are currently overvalued and the dividend of 2.87% is not particularly exciting. I've placed this one on my watch list to consider for any significant pullback in the market. Then EastGroup shares and its dividend will look a lot more appealing.
For further details see:
EastGroup Properties: Wait For A Discount To Buy This Quality Industrial REIT