BKLN - EIC: 15% Annual Returns For Past 3 Years And Still Soaring
2023-11-15 15:13:51 ET
Summary
- Eagle Point Income Co Inc is a high-yield income fund that offers monthly distributions and strong total returns.
- Eagle Point holds a higher percentage of CLO debt and a small percentage of CLO equity, making it an attractive investment for income investors.
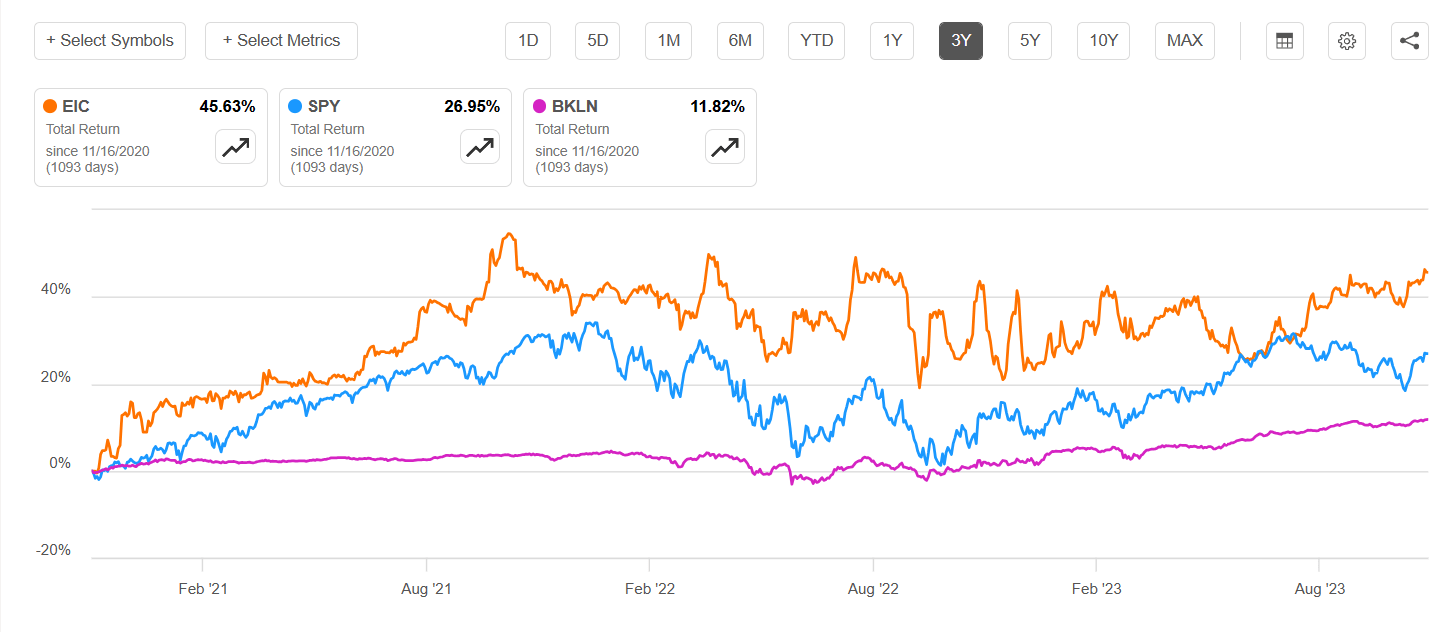
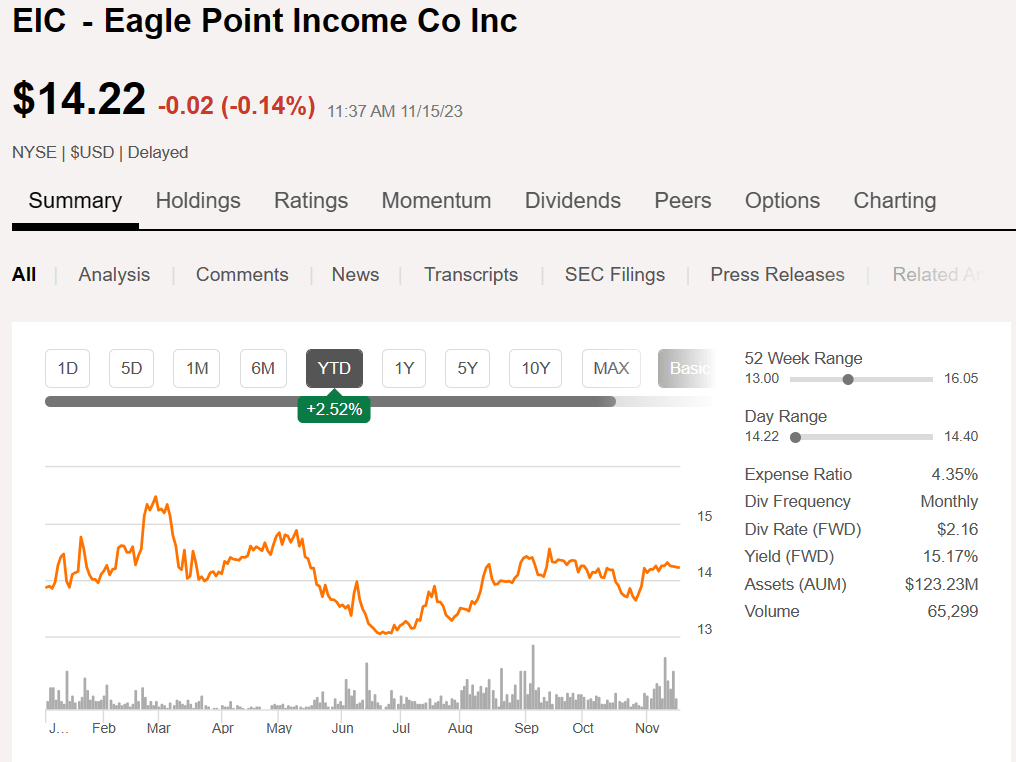
- The closed-end fund has a strong track record, with a total return of over 45% in the past 3 years, outperforming benchmarks like the SPY and Invesco Senior Loan ETF.
As an income investor seeking high yield income distributions, preferably monthly, that also offers a strong total return (i.e., some capital appreciation to accompany the income), one closed-end fund ("CEF") that comes to mind is Eagle Point Income Co Inc (EIC). Some readers may be familiar with the sibling stock from the same management team, Eagle Point Credit Company (ECC). While ECC focuses mostly on the equity tranches of collateralized loan obligations, or CLOs, EIC holds a higher percentage of CLO debt (mostly the BB-rated debt) and just a small percentage of CLO equity. If you are interested in learning more, you can read about CLOs in this excellent Pinebridge article. CLOs are all about the cash flows, as explained in that article:
Cash flows are the lifeblood of a CLO: They determine the distribution of income and principal, which determines the return on investment. The key concept is that distributions are paid sequentially starting with the senior-most tranche until each loan tranche has been paid its full distribution. Equity-tranche holders absorb costs and receive the residual distributions once the costs have been paid.
I have now built a long and strong position in EIC, making it a core holding in my Income Compounder retirement portfolio, along with ECC, Oxford Lane Capital (OXLC), and several other funds that also hold CLOs, including XAI Octagon Floating Rate & Alternative Income Term Trust (XFLT), OFS Credit Company Inc (OCCI), and most recently Carlyle Credit Income Fund (CCIF). You can read more about my IC portfolio, which uses the Income Factory® strategy coined by my fellow SA analyst, Steven Bavaria, in this recent article , "Moving From Growth To Decumulation – Asset Allocation For Investors Nearing/In Retirement."
Because EIC has only been publicly traded since 2019, it does not have a long, proven track record. I first wrote about EIC in November 2022 when I rated it a Buy at that time, "Eagle Point Income: Another High-Yield Income Fund To Consider." In that article I quoted CEO Tom Majewski, who spoke about how CLO BB debt has historically withstood economic downturns and has experienced very low long-term default rates. He went on to say,
“… We believe the performance of our portfolio over the past several years has further validated CLO BB's as a very attractive and resilient asset class.”
When I last wrote about EIC in February of this year, I rated the stock a Strong Buy: "EIC: Get Your High Yield Income From The Eagle Point Income Fund." This was what I wrote in the Summary back then, 9 months ago:
The potential for increasing income from ongoing and additional CLO investments at even lower prices looks promising for 2023 based on performance so far, and with the additional institutional investments in EIC in 2022, the future looks promising. I now rate EIC a Strong Buy at the current price of $14.19 and would suggest that investors consider adding shares prior to the Q422 earnings report, which is planned for February 22.
Over the past 3-year period EIC has offered investors a total return of more than 45% (about 15% average annual total returns), far exceeding the return of the S&P 500 (SPY) and well above the returns offered by another commonly used benchmark for Senior Loan funds, Invesco Senior Loan ETF (BKLN).
Although CLOs are comprised of senior loans, they are a different asset class with their own strict requirements and financing mechanisms. Although new CLO issuance is down, lower funding costs have led to an uptick in CLO issuance in Q3, although not reaching the highs seen in 2021 or 2022, according to this report from CapitalOne.
Year-to-date new issuance is down 21.5% as of the third quarter, but interest in the private credit space is holding on stronger than ever. Year-to-date middle market CLO issuance stands at $18.0 billion, nearly doubling last year’s 1Q-3Q total of $9.4 billion and representing a 22% share of total new issuance compared to 8%-12% in 1Q-3Q 2016-2022.
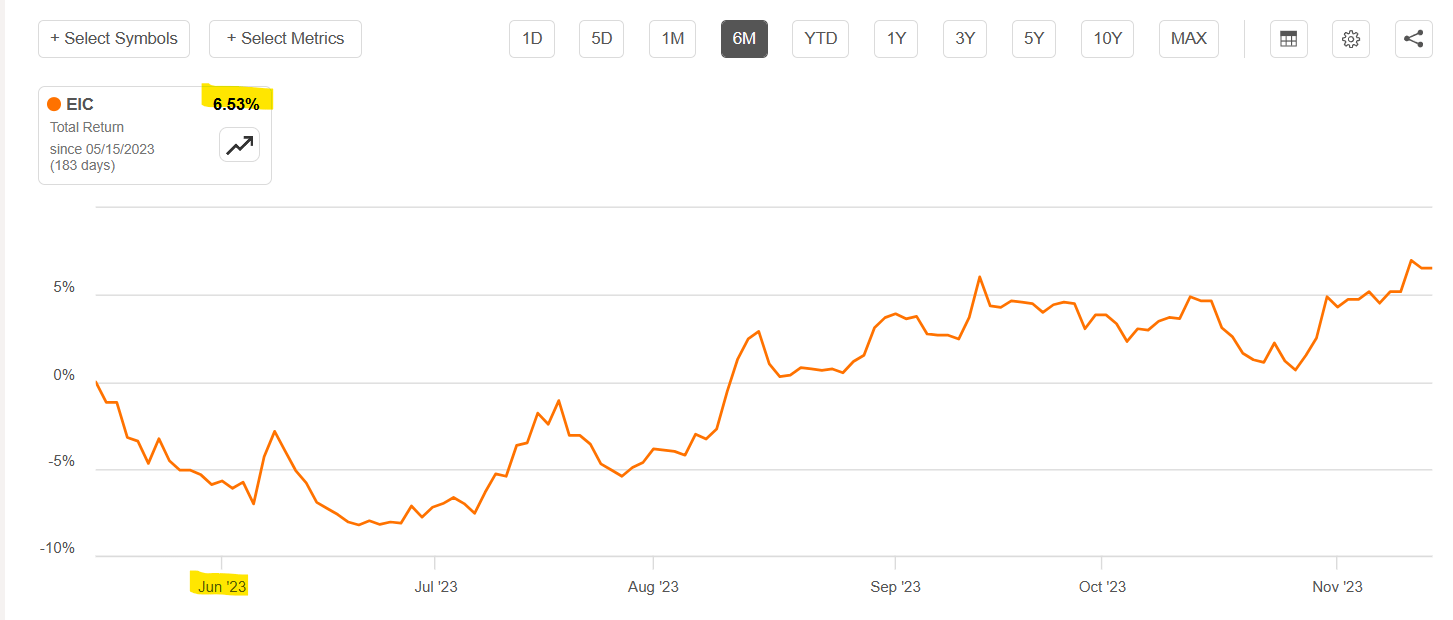
In the last 6 months, since the most recent SA analyst offered an opinion in June on why EIC common shares should be avoided, the stock has offered investors a 6.5% total return. I continue to stand by my Buy recommendation for EIC, as the stock continues to offer high yield income and the potential for additional capital appreciation after announcing Q3 earnings results .
Q3 2023 Results
On November 14, 2023, EIC announced Q3 results for the period ending September 30. In summarizing the results, CEO Majewski had this to say:
“In the third quarter, we produced NII, excluding non-recurring expenses, of $0.51 per common share, once again in excess of common distributions paid, while growing our net asset value per share by over 8%. Given our continued confidence in the Company’s portfolio, last week we were pleased to announce an increase to our monthly common distribution by an additional 11%, the highest monthly common distribution amount in our history.”
Furthermore, the company received $7.1 million in recurring cash contributions from the company’s investment portfolio which works out to $0.76 per weighted average common share. This amount far exceeds the monthly distribution, which was just raised by 11% to $0.20 per share beginning in January 2024. In addition, the weighted average effective yield of the portfolio reached 13.27% based on amortized cost, versus 12.3% as of June 30.
The NAV per common share was estimated at between $13.60 and $13.70 as of October 31. Additionally, subsequent to the end of the third quarter an additional $8.6 million of recurring cash distributions have been received from the investment portfolio. And as of October 31, some of the company’s investments had not yet reached their payment date for the quarter. This means that the Q4 results should be even more impressive than Q3.
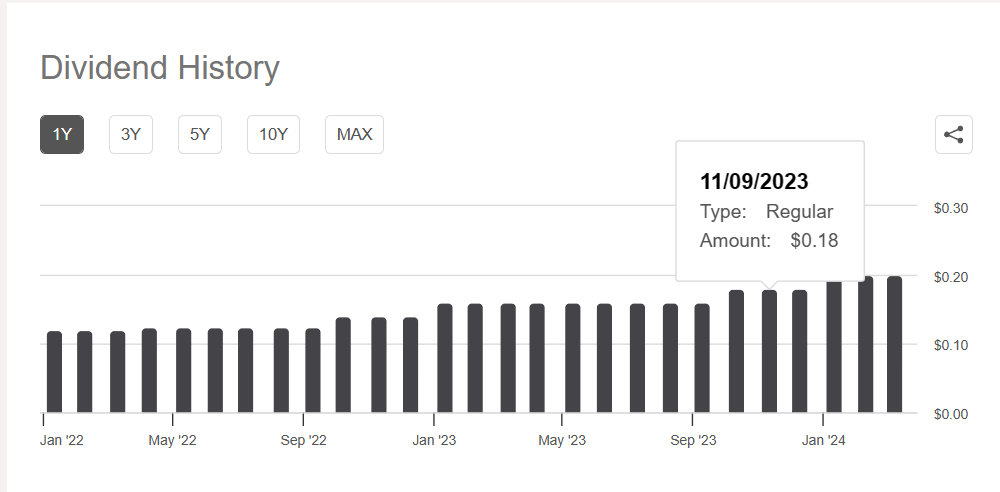
On November 8, the company declared a common stock dividend increase of 11% effective January 2024 to $0.20 per share monthly. That represents the fourth increase in the common stock dividend since the start of 2022.
Since the IPO in July 2019, EIC has paid out a cumulative $6.48 in cumulative common distributions per share.
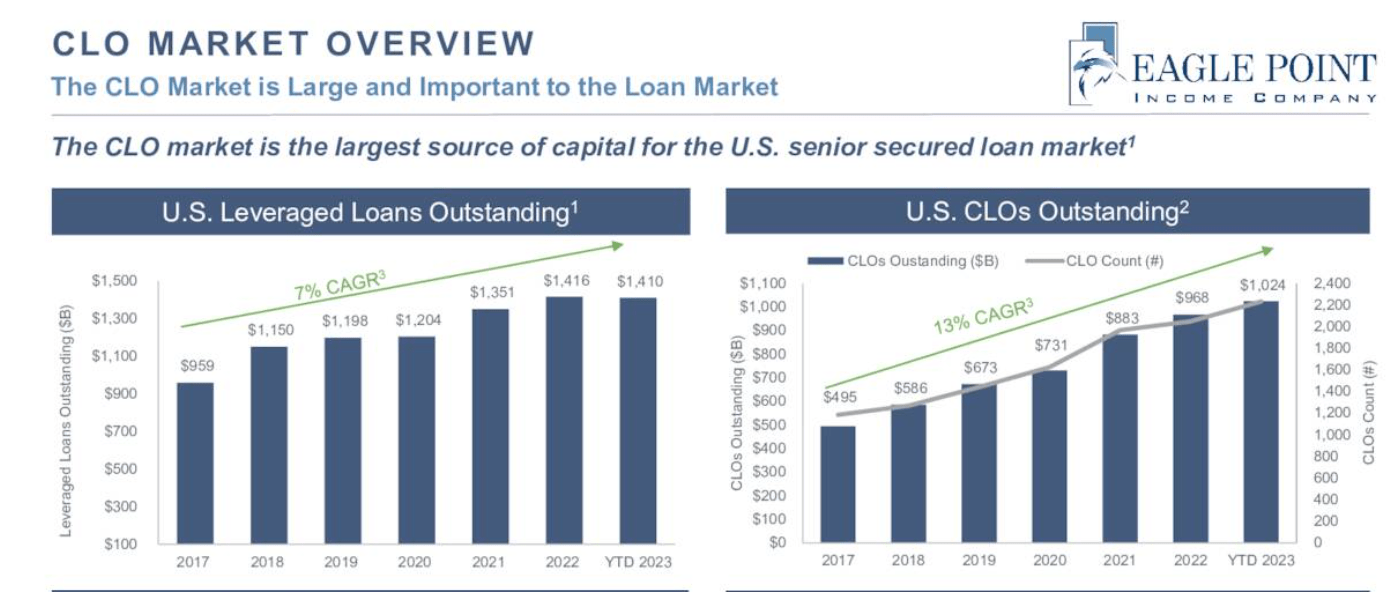
As this slide from the Q3 investor presentation illustrates, the CLO market is large and growing.
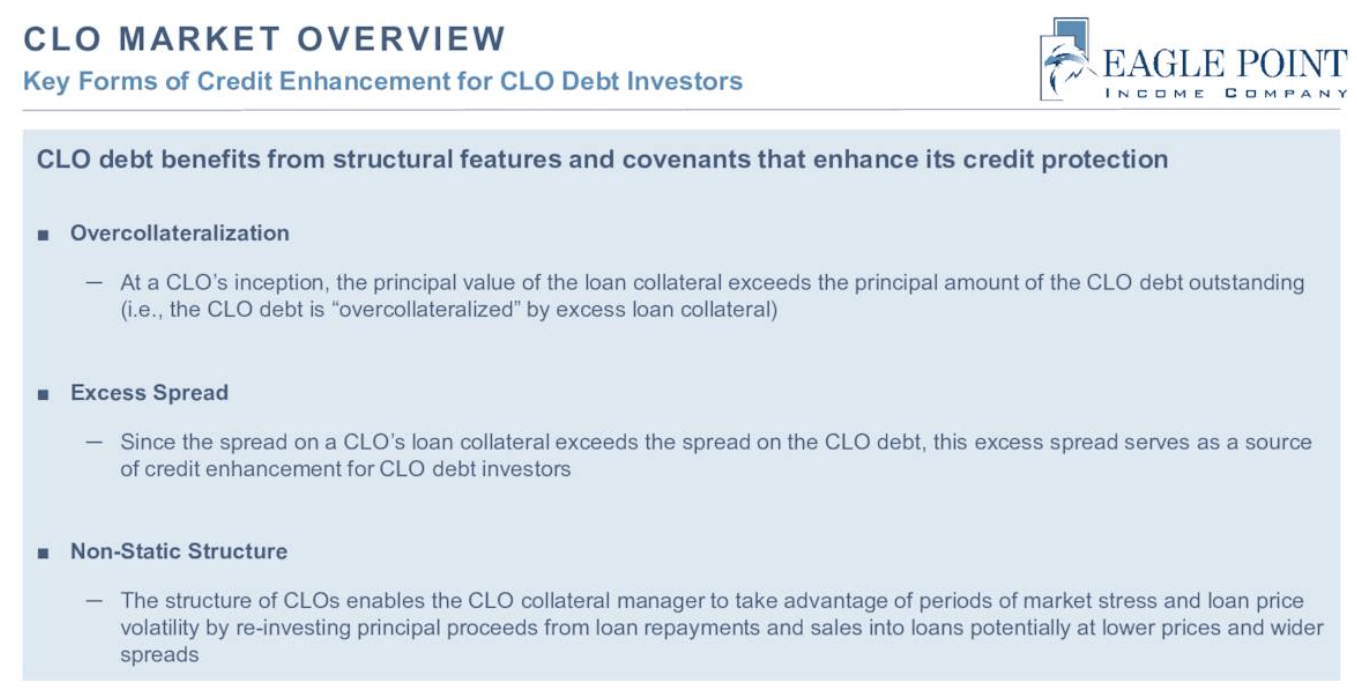
Funds that hold CLOs like EIC, ECC and others including OXLC are relatively new to retail investors, opening up a whole new source of steady and relatively low risk high yield income. Because of the way that CLOs are structured, loan repayments enable reinvestment within CLOs at a relatively high rate. The average annual repayment rate for capital reinvestment within CLOs exceeds 31% (although much lower so far in 2023). In addition, CLO debt benefits from structural features and covenants that enhance their credit protection.
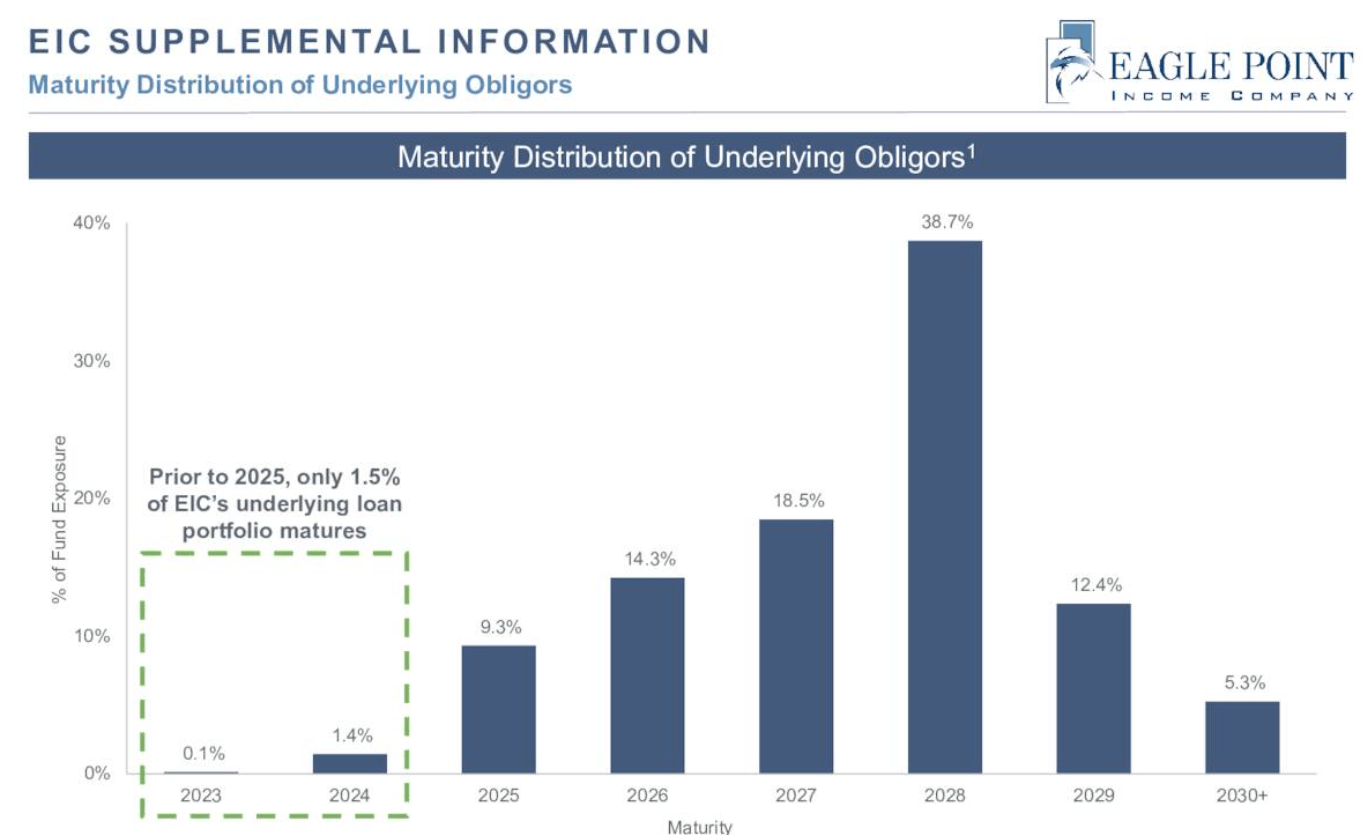
Experienced CLO managers can take advantage of these characteristics to generate higher than average returns while minimizing the risk of defaults offering CLO investors a margin of safety over other types of credit investments such as high yield bonds, or second lien loans, for example. In addition, the loans held in CLOs tend to have long maturities with less than 1.5% of the underlying obligors in the EIC portfolio maturing before 2025 as shown in this slide from the Q3 presentation.
Financial Position and 2024 Outlook
As explained on the Q3 earnings call , EIC raised $31.2 Million of additional capital from the 7.75% Series B preferred share offering in July which was deployed into new CLO junior debt and equity positions. They also opportunistically raised capital through ATM programs selling nearly 1 million common shares at a premium to NAV, generating about $0.02 of NAV accretion during the quarter. In addition, they sold about 15,000 shares of new Series B preferred stock during the quarter raising an additional $14 million in net proceeds. As of October 31, the company had over $17 million of cash and revolver borrowing capacity available, which provides ample “dry powder” for investing in new opportunities.
As CEO Majewski explained on the call,
As is evident, our portfolio continues to benefit from the floating rate nature of CLOs given that 100% of the CLO debt investments in our portfolio are floating rate. All of our CLO BB coupons are in the double-digits, and some CLO BBs have the potential to yield north of 20% in an early call scenario.
As Senior Principal and Portfolio Manager Dan Ko explained, the company is well positioned going into 2024.
During the quarter, we fully deployed the proceeds from our ATM issuance and EICB preferred offering and in total deployed nearly $51 million in gross capital into attractive CLO junior debt and CLO equity purchases. The weighted average effective yield of the CLO purchases during the quarter was a robust 15%. We continue to see attractive return profiles in the secondary market.
The 12-month default rate as of September 30 declined to 1.3%, which is well below historical averages.
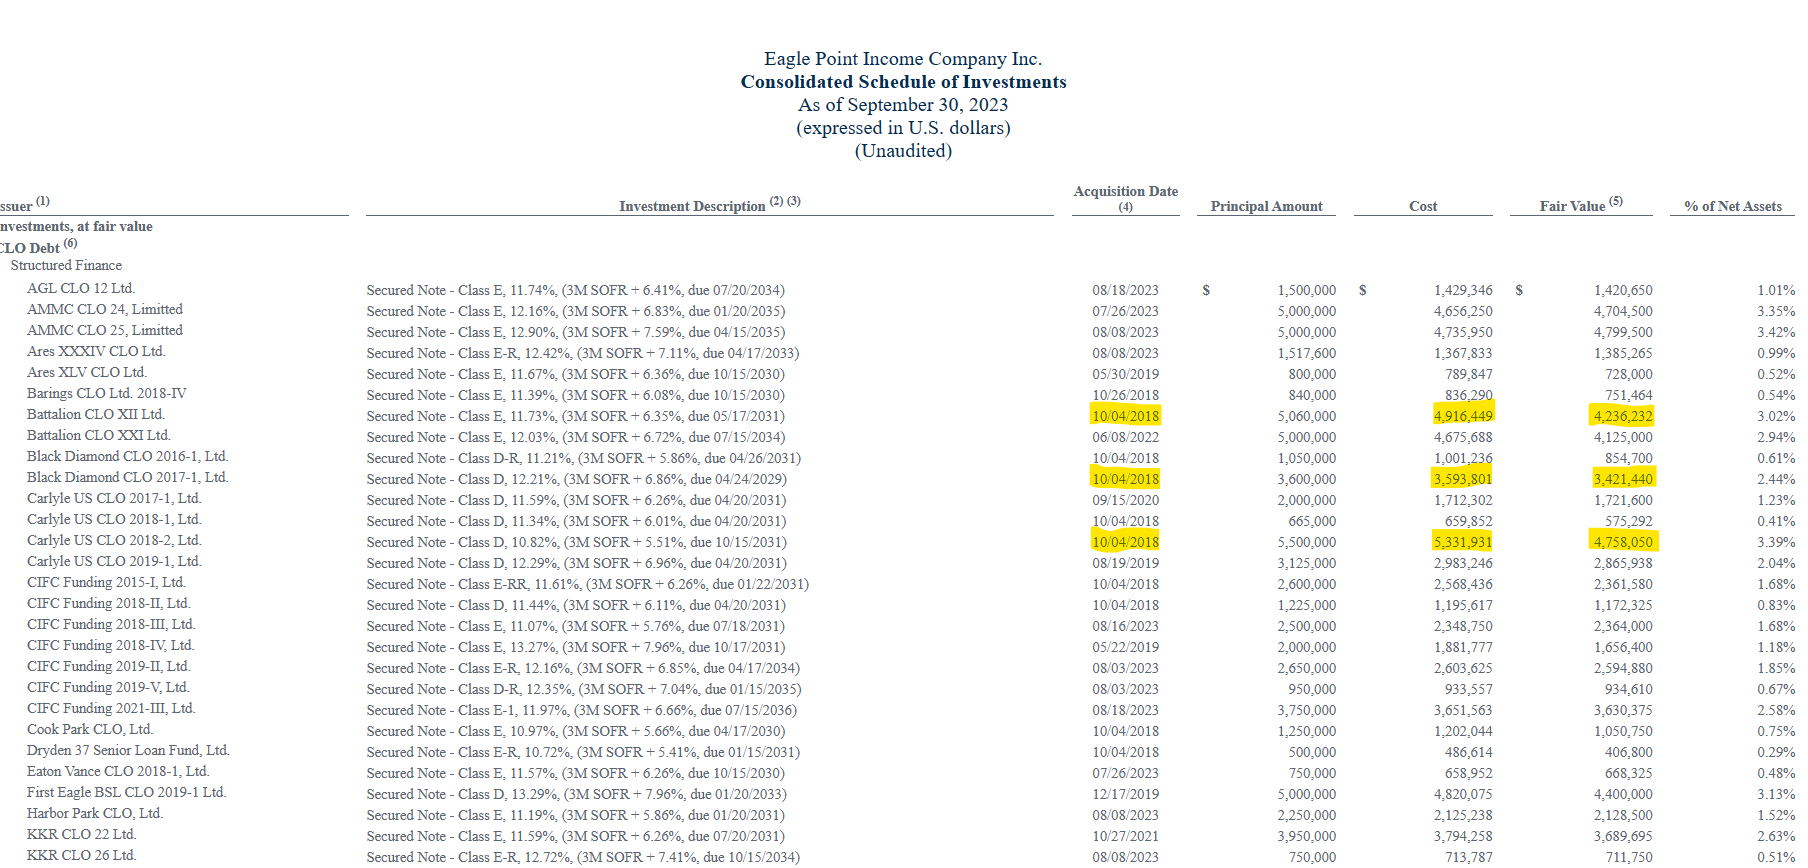
For any accountants out there reading this, or investors who wish to dig deeper into the company financials, a recent Consolidated Financial Statement was filed with the SEC for the quarter ending September 30, 2023. In that document, each CLO held in the EIC portfolio is listed along with the cost and current estimated value (as of 9/30). I am not going to include them all, but a subset of them should help to explain in part why the NAV of the stock fluctuates as the loan market adjusts the pricing of loans in the secondary market. For example, several of the larger CLOs issued in October 2018 are now priced well below cost, but some of the more recently issued CLOs are valued above cost.
On the Q3 earnings call, Dan Ko addressed the current state of the Leveraged Loan market and how that impacts pricing and valuations.
The Credit Suisse Leveraged Loan Index continued its momentum from the first half of the year and is up 10% year-to-date as of September 30, 2023. And thanks to the loan market rallying this year, the JPM CLO BB Index is up 16% year-to-date as of September 30, and the company's GAAP ROE is up nearly 20% year-to-date as of September 30 as well.
Like the Income Factory® strategy that my colleague, Steven Bavaria describes, EIC can be thought of as a sort of income factory also. That is to say, the cash flows generated from the CLO holdings are what really matters to investors, not the current value of the “factory.” Loan prices go up and down, impacting the NAV, but the payments from CLOs are based on long-term holdings that keep building and growing as those floating rate loans benefit from higher interest rates.
Furthermore, the concept of NII is not a useful determinant of the company’s ability to cover the distribution, as is generally the case in other CEFs that hold equities or fixed income, for example. When the company reports NII for the quarter, there are various considerations that should be taken into account before using that metric to judge the stock performance. Those details are explained in the Q3 earnings call by company Chief Accounting Officer, Lena Umnova ( emphasis added by me):
For the third quarter, the company recorded net investment income or NII of $3.5 million or $0.38 per share, compared to NII of $0.49 per share recorded for the second quarter of 2023 and NII of $0.40 per share for the third quarter of 2022. NII for the quarter is net of $0.14 per share of non-recurring expenses related to the issuance of the company's 7.75% Series B term preferred stock partially offset by $0.01 per share excise tax refund. Excluding these non-recurring items, NII would have been $0.51 per share above our distribution level for the quarter.
If anyone reading this might be concerned about the asset coverage ratios, that concern was put to bed by Umnova as well with this statement:
The company's asset coverage ratios at the quarter end for preferred stock and debt calculated in accordance with investment company at requirements were 283% and 5,146%, respectively. These measures are comfortably above the minimum requirements of 200% and 300%.
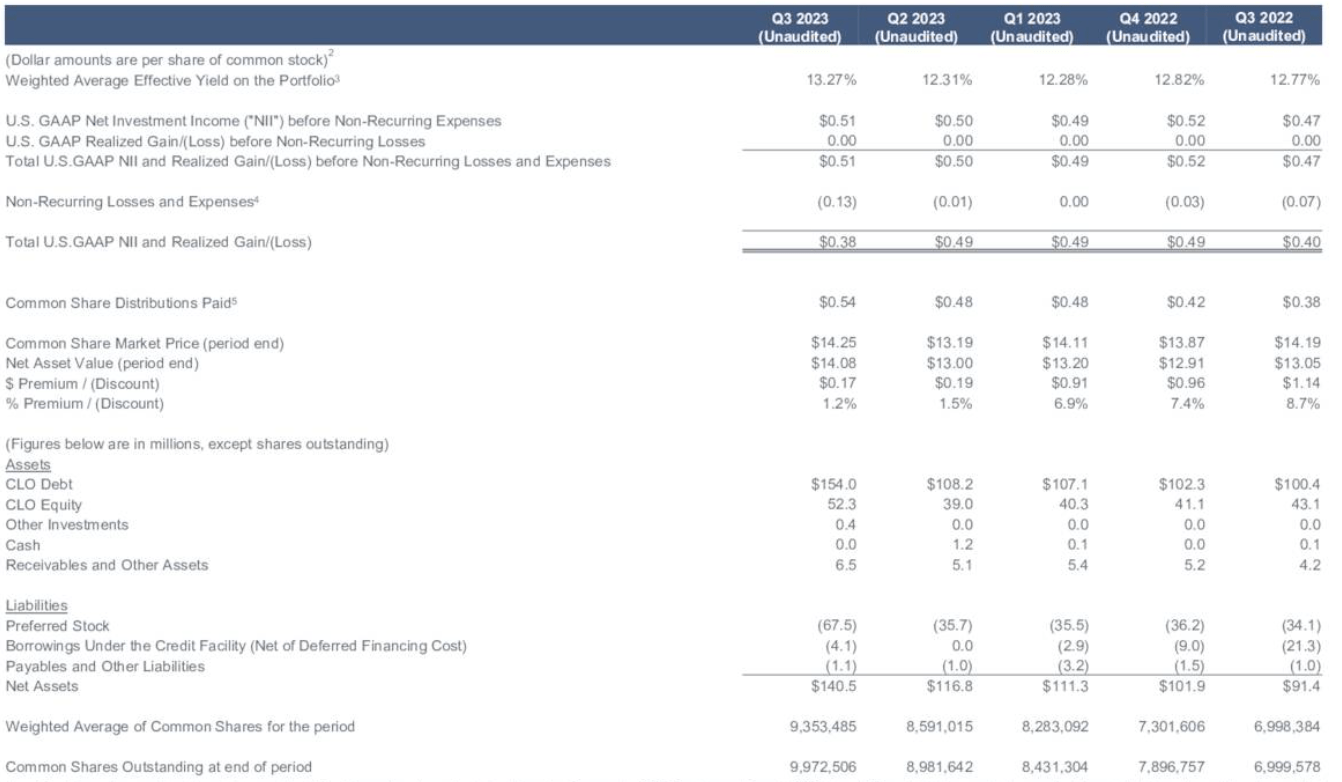
The following slide from the Q3 earnings presentation summarizes the balance sheet, with growth in CLO debt held in the portfolio increasing to $154 million in Q3 (compared to $108 million in Q2).
Net liabilities also increased to around $72 million with the issuance of new preferred shares, but overall net assets went from $116.8 million in Q2 to $140.5 million in Q3.
Summing it Up
While the stock price has traded mostly sideways for the majority of 2023, EIC offers income investors a yield of nearly 17% going forward based on the recently increased monthly distribution of $.20 per share. That distribution is well covered from recurring cash flows as explained in this update and based on comments made during the Q3 earnings call. The CEO, Tom Majewski (who was recently interviewed on Bloomberg), discussed the results for 2023 so far and prospects for 2024.
EIC has had a banner 2023 so far, and the elevated rate environment has continued to help us grow and maintain net investment income at a high level.
The three key attributes why we remain excited to be managing a BB-rated CLO debt focused fund ring today as true as ever: the potential for low credit expense as reflected by the low default rates of BB-rated CLO debt over the past 20 years, the potential for high returns compared to similarly rated corporate securities, the benefits of floating rate BB-rated CLO debt offer in markets with high interest rates.
While the market remains skeptical regarding CLOs as evidenced by a lack of share price appreciation in many of the funds that hold them, the outlook for increasing cash flows over the next several years is quite positive with continued low risk of defaults as the economy remains resilient. If that should suddenly change and the U.S. economy suffers a deep recession similar to what happened in 2008, or a black swan event like Covid-19 should occur, there could be short-term impacts to the prices of CLOs which would put downward pressure on the NAV (and thus, the stock price). However, many of the best CLO originations occurred during those bad times and that could present a buying opportunity for CLO investors should that occur.
This article from September 2022 discusses the potential risk of CLO underperformance in the event of rising defaults and offers some assurances that investors in CLO debt in particular, should be confident that their investments are relatively safe even during an event that causes rising defaults.
Barclays researchers built a series of CLO stress test scenarios to assess their performance in a downturn and determine their “break-even” default rates – in other words, the constant loan default rates (and recovery assumptions) that could impair CLO note payments. Barclays used four default scenarios: 1) Dot-com bubble (prolonged and moderately high default rates); 2) GFC (default rates spike and then come down); 3) COVID 19 (defaults jump to a moderate level and come down quickly); and 4) Severe (default/repayment/recovery rates two standard deviations more severe than seen in the GFC). Barclays’ assumptions for loan repayment, recovery, CCC share and price all aligned with the historical experience. These scenarios were tested on eight representative deals.
The results: Equity IRR dropped – and was almost wiped out in the excessively severe scenario. Break- even default rates required a median constant default rate ((CDR)) of 9% to create the first dollar of loss for BB tranches; 17% was required for BBB tranches. Single As suffered a first dollar of loss at a CDR of 32%; AAs required a CDR of 59% and AAAs were never impaired. Or, as we interpret it, CLOs performing as intended.
This information, combined with the reassuring statements from EIC company executives on the Q3 earnings call, reinforces my Buy rating on EIC stock for investors who wish to receive a steady stream of cash to compound monthly in their portfolios, like I do with mine.
For further details see:
EIC: 15% Annual Returns For Past 3 Years And Still Soaring