EMBC - Embattled Embecta Continues To Present Challenges To Shareholder Value
2023-10-17 22:00:32 ET
Summary
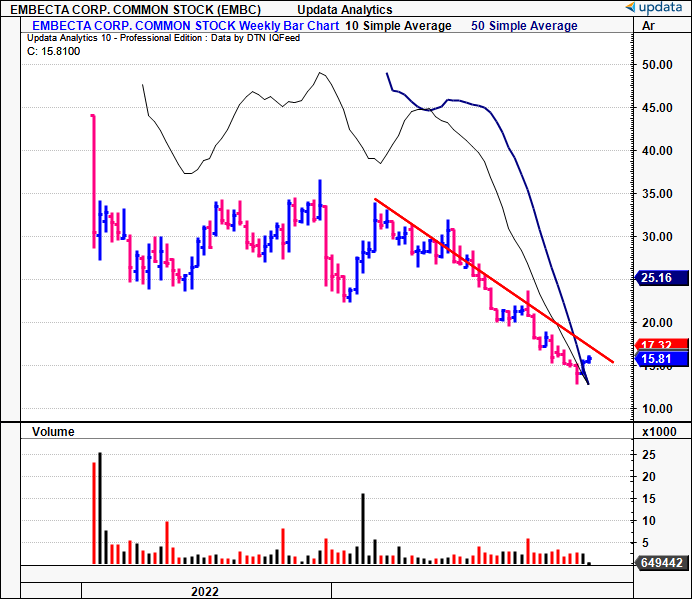
- EMBC's stock has hit its lowest marks since its listing, indicating the negative sentiment in the company.
- The company's recent financial performance has been soft, with declining top-line numbers and hurdles to demand + pricing.
- The balance sheet is saddled with debt, while its economic returns and drivers are trending lower.
Investment Summary
The carve-out of Embecta Corp. ( EMBC ) from Becton, Dickinson ( BDX ) in April last year has failed to materialize a gain in shareholder wealth, with its equity stock selling at its lowest marks since the new listing. EMBC has diverged from key equity benchmarks and now has >9% short interest (which is high by the way), a clear indication of the negative sentiment priced into the stock. If equity prices are simply a set of discounted future expectations, then EMBC's languished performance since the listing is telling of what the market foresees for this name.
Following the latest investment updates (discussed here ), it would appear there is little evidence to depart from the market's appraisal. Its latest numbers did nothing to change the view, coming in weaker YoY at the top line, with demand clearly taking a hit in its U.S. operations, and no pricing benefits to speak of.
Added to this, the following pressures lead me to believe EMBC is not an investment grade company at this point in time:
- The balance sheet i s saddled with debt, amounting to ~$1.6Bn in its fiscal Q3, with total liabilities exceeding gross assets by a factor of 1.64x.
- Shareholders therefore are holding a negative equity value of ~$809mm.
- Inventories on hand have increased at a rate 10x faster than quarterly top-line sales since its listing numbers in Q1 CY 2022 (44% vs. 4.4%, respectively).
- Pre-tax income has diminished sequentially since early 2022. Using TTM values, it has compressed from $451.5mm to ~$290mm, 36% decline. Operating cash flows have followed suit.
- The drivers of EMBC's economic returns have also trended lower since listing and continue to do so.
This report will unpack each of these factors in greater detail, along with additional insights. Net-net, I continue to rate EMBC a hold.
Figure 1.
Critical facts pattern supporting reiterated buy rating
1. Fundamentals + economic factors
EMBC put up Q3 revenues of $286mm , down ~170bps YoY on gross profit of $203mm, equating to a 66% margin [As a reminder, EMBC reported its fiscal Q3 last period, corresponding to Q2 CY 2022]. This is a compression of ~650bps YoY, correlating to operating margins of ~18%, down from 33% last year.
Management views the following guidance for this year:
(1). Sales growth of ~0.5–1%, calling for $1.14Bn at the upper end of range. It has done ~$840mm in sales so far this YTD, so it would be looking to ~$300mm in the final quarter of its fiscal '23.
(2). No additional revenues concerning its contract manufacturing of non-diabetes products to BD.
(3). Gross margin of ~66%, up 150bps from prior guidance.
(4). Earnings of $2.75–$2.80/share, also up from prior estimates.
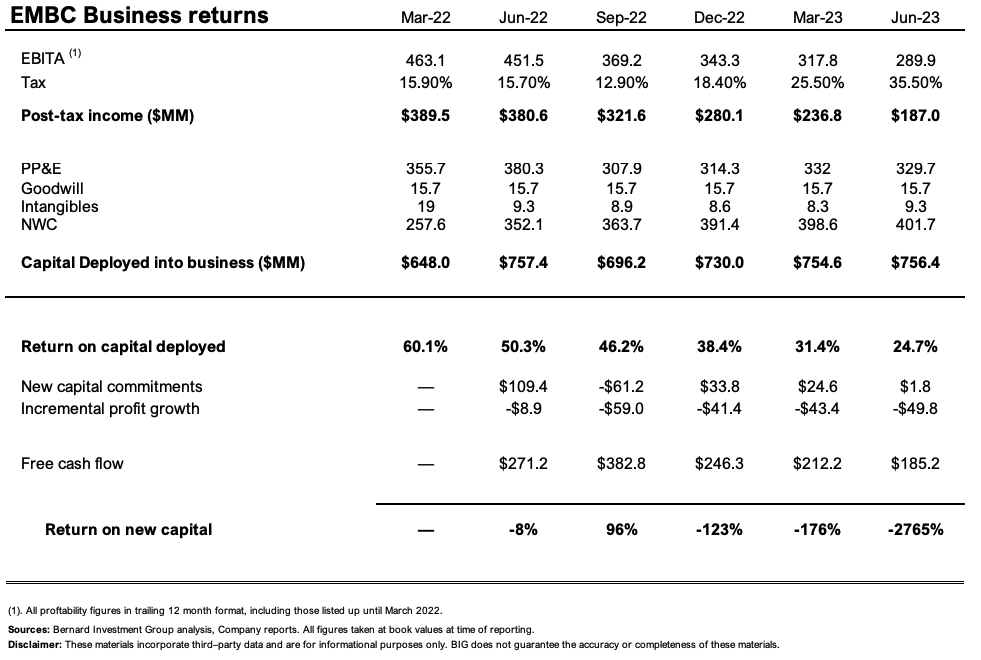
More critical to the debate is EMBC's business returns since the carve-out last year. On that front, I've observed some concerning trends as it relates to the investment context.
For example, its post-tax earnings have compressed from $380mm in Q3 last year to $187mm last period (TTM values).
It has retained and recycled $108mm back into the business since March 2022. Total capital deployed into the business is now ~$756mm. On what investments have been made, the business returns EMBC is throwing off are actually quite attractive, totaling ~25% last period (TTM values).
A more thoughtful analysis is revealing of the true economics at play here. In particular, note the following:
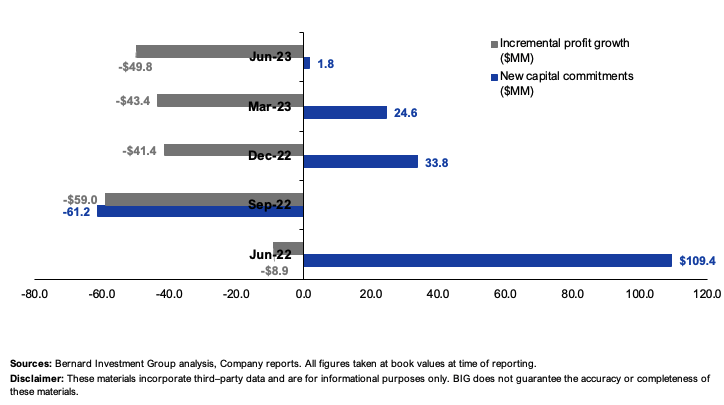
- The new capital commitments have not produced any incremental profit growth.
- In fact, the returns on new capital have been persistently negative, as seen in Figure 3. Naturally, a loss of >2,000% is not meaningful, but it highlights the point.
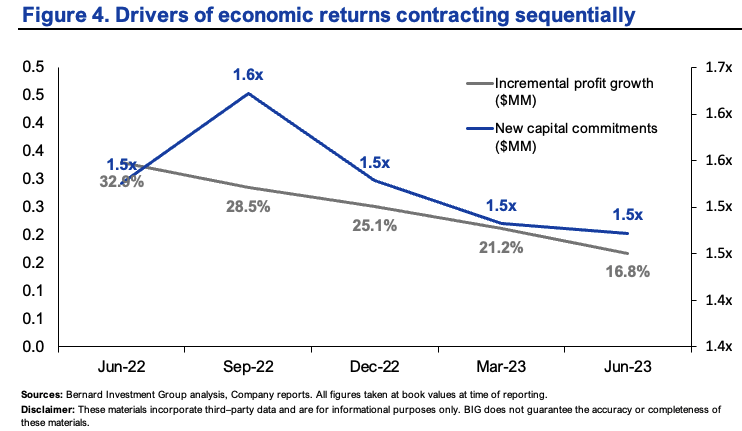
- In addition to this, the drivers of EMBC's business returns—post-tax margins and capital turnover—have each been trending lower at a sharp gradient (Figure 4).
So you've got a scenario where EMBC is ploughing cash back into its operations, but producing negative rates of return on this. In other words, any business growth is actually eroding shareholder value at this rate for EMBC.
Figure 3.
Just on the last point from above—regarding the economic drivers to EMBC's returns—you can see EMBC is a reasonably high margin, low capital turnover business. But with its declining margin profile, it runs the risk of losing this factor.
In particular, the emergence of GLP-1 class drugs (think Ozempic and colleagues) has proven to be a potential disruptor to the diabetes management industry. Not saying this has eaten into EMBC's margins at all; it's likely the lack of pricing gains it has employed that have done this in my opinion. Still, EMBC does not enjoy production advantages, and it is losing its cost differentiation advantage at this stage, which could translate to a loss of consumer advantage, and, ultimately, erode its long-term competitive position.
Related to the above, it needs to invest heavily to maintain this position, but as has already been demonstrated:
(i). Its new investments aren't producing gains in incremental profits,
(ii). The economic drivers of its growth engine are losing fuel.
These red flags cannot be overlooked in my estimation.
(2). Sentiment + technicals
Market-generated data is equally unsupportive for EMBC at this stage as well. Figures 5 through 7 outline the technical picture.
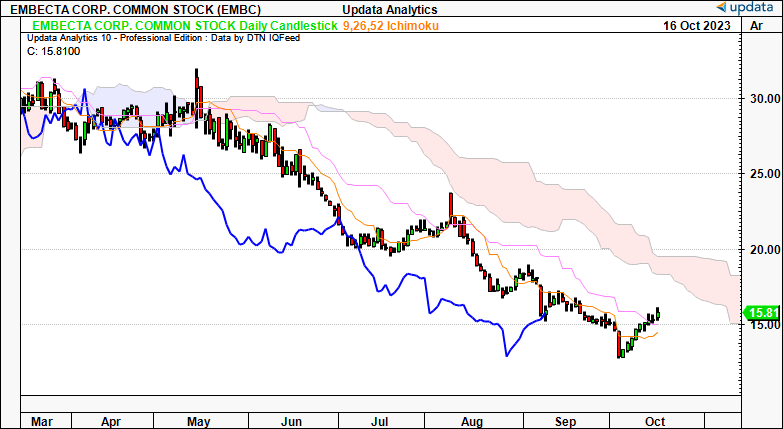
Figure 5— Daily cloud chart, looking to the coming weeks
- Both price and lagging lines are beneath the cloud, indicating negative sentiment.
- This has been the trend since April this year, correlating to an extended selloff in the company's stock.
- A break above the $19 mark is needed to suggest a bullish reversal, but for the time being, this chart supports a neutral view.
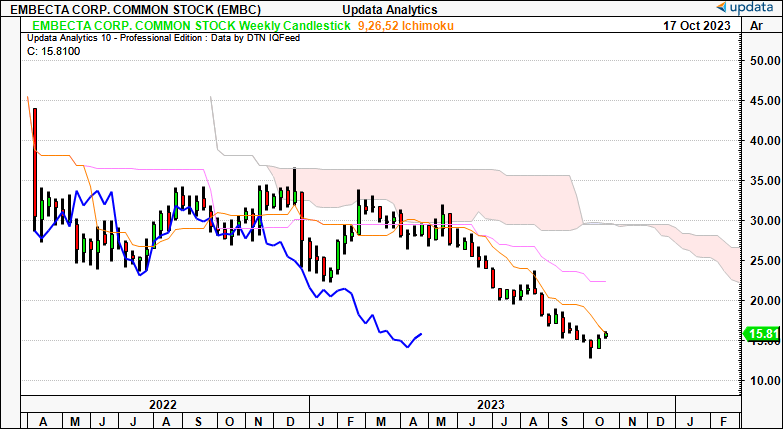
Figure 6— Weekly cloud chart, looking to the coming months
- Extending the analysis out to the coming months on the weekly chart, similar trends are in situ.
- Critically, EMBC's price and lagging lines are positioned deep beneath the cloud, making the required reversal even greater to push into bullish territory.
- On this frame, a break above $26.00 is needed to get us back to a more constructive view. Again, this is a neutral setup.
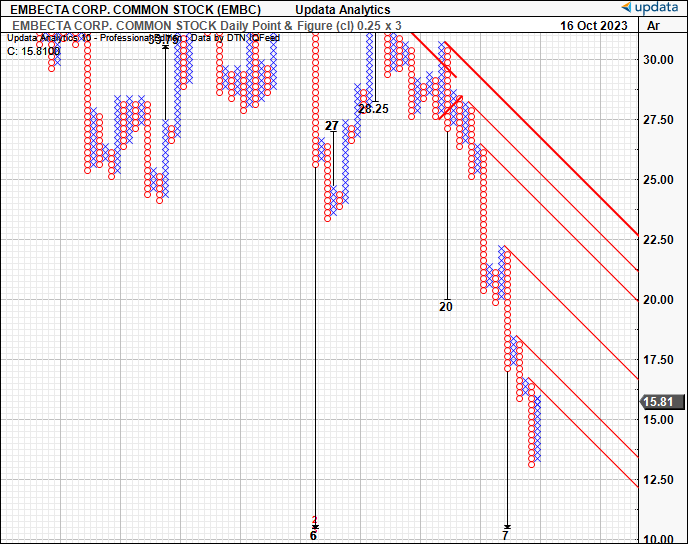
Figure 7— Point and figure studies
- P&F studies provide an excellent, objective viewpoint to gauge price action by removing the noise of time and intra-trend volatility.
- Concerningly, we have downsides as low as $7.00 from this analysis.
- This is a granular view—it looks at small changes in directional bias in EMBC's equity line, so it may be overextended—but the point is, it points to further downsides ahead.
Valuation and conclusion
For all its pressures, the stock sells at a deep discount to sector peers. It is currently priced at 5.6x forward earnings and 6.8x forward EBIT, ~70% and 56% discount to peers, respectively.
Relative value managers may be interested in these relative discounts, but I would proceed with caution. Remember that:
- The company comes with negative equity at the time being, given its high debt load and lack of asset growth.
- So it has created no market value for its level of net asset value (which is negative, as mentioned).
- Its economic value drivers are also compressing at a steep gradient, with the firm creating no additional intrinsic value for shareholders since its listing.
Interestingly enough, the company does pay a $0.60/share dividend, which gets you ~3.8% forward yield as I write. But it's not enough to overcome the downside pressures discussed here, especially on the company's business returns.
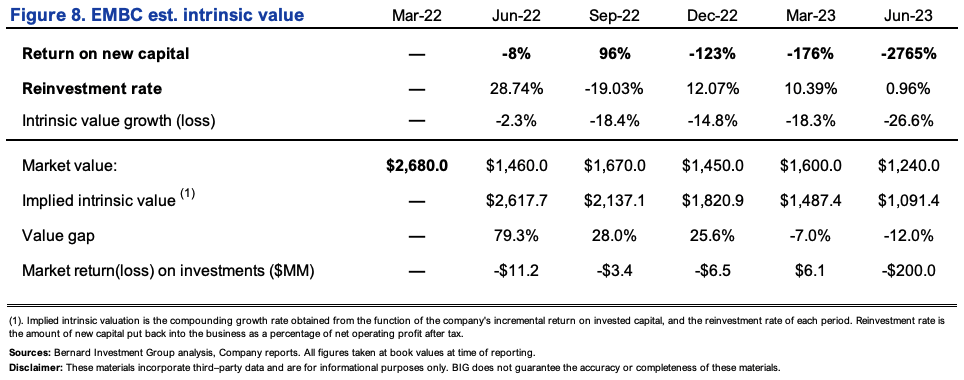
In that vein, you can see the interplay of EMBC's softening economics and its intrinsic value in Figure 8. A firm can compound its intrinsic value at the function of its incremental ROIC and the amount it reinvests at these rates. EMBC is investing at negative rates of incremental return, so it hasn't managed to compound intrinsic value since listing last year. In fact, my opinion is that it's still overvalued under this convention, by ~12% as I write. I've got it valued at ~$1Bn, or further, its investments continue to generate negative market value, showing that capital is more valuable in the investors' hands at this stage (where she or he can invest in more stable returns with lower levels of risk). This does not advocate for a buy rating, and I would suggest holding off adding to EMBC at this stage for all consilient investors.
In short, EMBC comes with its set of economic hurdles to overcome which impede a strong buy rating in my opinion. The question of opportunity cost immediately arises. You'd be putting capital at risk at the cost of adding to more selective opportunities, with much lower perceivable and known risk. In my view, EMBC is still marginally overvalued and the market has done a decent job at capturing the company's intrinsic value since its carve out and listing last year. Net-net, I continue to rate EMBC a hold.
For further details see:
Embattled Embecta Continues To Present Challenges To Shareholder Value