BIPAF - Emeth Value Capital H1 2023 Letter
2023-08-09 10:45:00 ET
Summary
- Emeth Value Capital is a private investment partnership focused on maximizing long-term net returns for a select group of limited partners. Independent thought, structural simplicity, and philosophically aligned partners feed the competitive advantage of our partnership.
- I ascribe little significance to short term results - I look out many years when making investments for the partnership and believe our results are best weighed using a similar time horizon.
- At the risk of oversimplifying, one can think of private equity marks as single-variable valuations, while public equity marks are dual-variable valuations.
Foreword
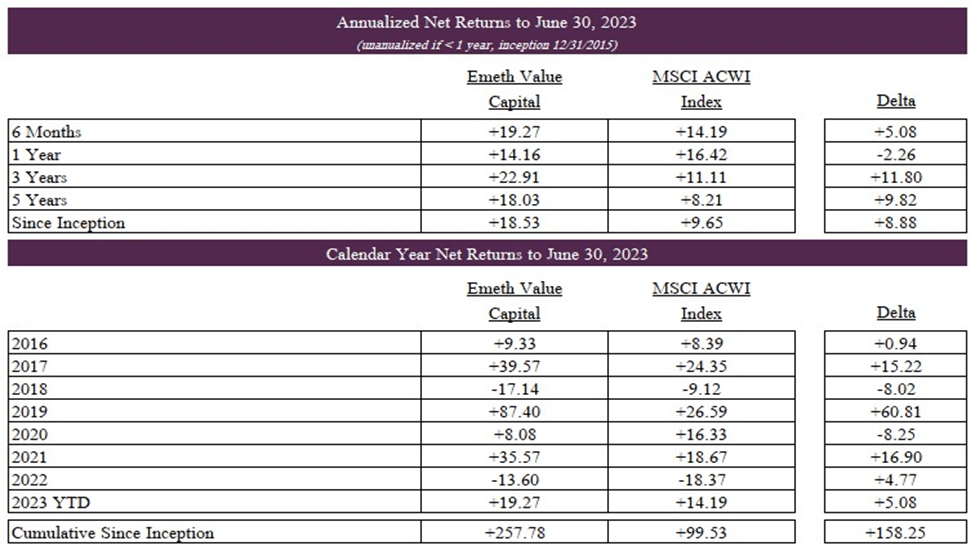
I intend to share the updated results at the outset of each letter. It is worth reiterating that I ascribe little significance to short term results. I look out many years when making investments for the partnership and believe our results are best weighed using a similar time horizon.
Price Is What You Pay, Value Is What You Get… Liquidity Is Everything In Between
I’ve taught at Columbia for 23 years, and I always make a promise to my students on the first day of class – that if they do good valuation work, the market will agree with them. I just never tell them when. (Joel Greenblatt)
For as often as the phrase “a private equity approach to public markets” is repeated, it is surprising to observe the great divide that exists between even very sophisticated long-term investors in public and private markets. There is perhaps no more well-trodden battleground than that of valuation marks. Public investors, particularly in times of market stress, are quick to express frustration that private equity portfolios are not marked to market.
The title of Cliff Asness’ recent opinion piece in Institutional Investor captures the sentiment well, “Why Does Private Equity Get to Play Make-Believe With Prices?”. The level of discontent is surprising for two reasons: first, the difference in methodology is quite easily understood, and second, contrary to public markets gospel, it is evident that liquidity and the discovery of value are in no way synonymous. Indeed, they may be opposing forces more often than not.
At the risk of oversimplifying, one can think of private equity marks as single-variable valuations, while public equity marks are dual-variable valuations. Both incorporate the level of earnings in a business, but while multiples are held relatively constant in private equity marks, public market marks also incorporate sentiment in the form of a changing multiple. The problem is that Mr. Market tends to change his opinion quite often.
Consider the case of one of our former portfolio companies, DICK’S Sporting Goods ( DKS ).
DICK’S is the largest sporting goods retailer in the United States, a position that it has held for nearly two decades. DICK’S was founded in 1948 when Richard “Dick” Stack, the father of Ed Stack, opened his original bait and tackle store in Binghamton, New York. Since assuming control of the then two store chain in 1984, Ed Stack has grown the family business into a full-line sporting goods store with more than eight hundred locations nationwide.
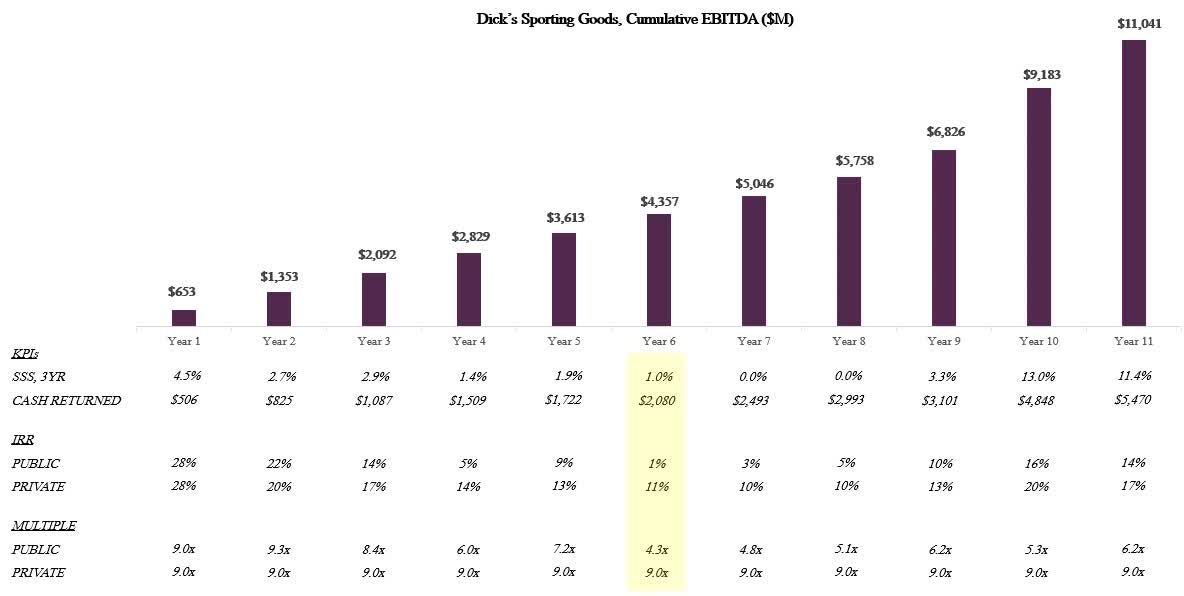
The company went public in 2002 and has since increased its total revenue by 10x, from $1.2 billion to $12 billion, while also returning over $5 billion in cash to shareholders. In its forty year history, DICK’S has never had a period where comparable store sales, measured over rolling three year intervals, was negative. Turning back to our discussion, let’s consider a hypothetical investment made in DICK’S Sporting Goods in 2012.
The graphic above details the progression of cash flows and how the theoretical private marks would differ from the actual public marks observed over this timeframe. At year zero, DICK’S Sporting Goods had no debt and was available for purchase for $5 billion, or 9.0x EBITDA. During the initial three years, the marks follow a similar trajectory. However, the consistency is short lived. In years four through six, after having risen to a $6.2 billion valuation with over $1 billion in cash distributed back to shareholders, the public marks successively adjust the valuation down by $1.8 billion, up by $1.3 billion, and then down by $2.5 billion.
During these same years, company cash flows remained nearly identical at $750 million per year, and a further $1 billion in cash was returned back to shareholders. And so, six years into this investment, after cash flows had grown thirty-four percent in aggregate and $2 billion had been returned to shareholders, Mr. Market felt that this business now warranted half the multiple it did only a few years earlier, or 4.3x EBITDA. This is despite one of DICK’S largest competitors, Sport’s Authority, filing for Chapter 7 bankruptcy in year five, which ceded several percentage points of market share to the remaining retailers, and US corporate tax rates falling in year six, which increased free cash flow conversion.
In short, the company was priced to disappear over the coming decade. The investment marked to market would have shown a one percent IRR, while constant multiples would have yielded an eleven percent IRR. Of course, the business has not disappeared. In fact, adjusted for the hunting and gun department, which DICK’S decided to remove from 500 of its stores, the business’ same store sales have comped positive every year since year six.
An added bonus that no one could have foreseen was that the business would also strengthen materially as a result of the pandemic. Today, DICK’S generates $1.8 billion in EBITDA, and over the full course of the eleven year investment the public and private marks have converged back to a mid-teens IRR.
So, what is the correct valuation? It is impossible to know with certainty. However, we can be reasonably confident that it is unlikely a business with stable cash flows is changing in value by one-third in either direction year to year, and it is unlikely that 4.0x is a proper multiple for a business with no debt and a thirty year history of growing profits. To paraphrase Christopher Schelling’s article “Why Private Equity Gets Valuations Right,” perhaps it is the short-term volatility of public markets, not the muted volatility of private markets, that’s a bug, not a feature.
Brookfield Corporation ( BN ) Overview
Brookfield Corporation is a leading global alternative asset manager with more than $400 billion of assets under management. The group has a strong heritage as an owner and operator of real assets and is among the largest global investors in infrastructure, real estate, and renewable power. Since 2019, Brookfield has also been the majority owner of Oaktree Capital Management, a prominent credit-focused investment firm led by Howard Marks.
Brookfield Corporation is by far the largest balance sheet investor among alternative investment firms, with more than $50 billion in internal permanent capital invested alongside clients. Under the leadership of Bruce Flatt, who personally holds a shareholding of more than $2.5 billion, Brookfield has compounded at twenty percent per annum for three decades, equating to more than a 200x increase in shareholder value.
Company History
In 1954, Edper Investments was established as an investment holding company for brothers Edward and Peter Bronfman, the nephews of Canadian liquor magnate Sam Bronfman. The Bronfman family founded Distillers Corporation Limited in LaSalle, Quebec in 1923, which ultimately became The Seagram Company. Seagram was, for many years, the largest producer and distributor of liquor in the world, and its portfolio included iconic labels such as Crown Royal, Captain Morgan, Chivas Regal, and The Glenlivet.
Although Sam founded the businesses alongside his four brothers, he steadily maneuvered them out of the company until gaining complete control in the 1950s. When Sam forced his brother Allan to sell the shares of Seagram held in a trust for his children, Edward and Peter, the proceeds became the seed capital for Edper Investments. In the years that ensued, the brothers ventured into multiple industries including real estate, natural resources, and financial services. However, the pivotal moment for Edper occurred with the arrival of Jack Cockwell in 1968.
While an accountant by title, Cockwell orchestrated a ferocious activity of dealmaking over the coming decades that would build Edper into one of the largest global conglomerates. At its apex, the group controlled more than five hundred private and publicly traded subsidiaries, and its public holdings alone accounted for fifteen percent of the total capitalization of the Toronto Stock Exchange. Underpinning this rapid ascent was a structure pioneered by Cockwell called cascade financing.
It works like this: a subsidiary of Edper offers $200 million in new stock, of which Edper invests $100 million of its own capital for a controlling stake, and the remaining $100 million is raised from third party investors. Then, a second subsidiary offers $400 million in new stock, of which the first subsidiary invests the $200 million raised from its offering for a controlling stake, while the remaining $200 million is raised from third party investors.
Then, a third subsidiary offers $800 million in new stock, of which the second subsidiary invests the $400 million raised from its offering for a controlling stake, while the remaining $400 million is raised from third party investors, etc. In this way, Edper has control all the way down the line of companies, potentially with several billion dollars of investable capital, all upon the basis of its initial $100 million investment.
This structure supplemented with non-recourse debt financing was akin to financial magic for Edper, as control often allowed the group to secure priority for its own economic interest while simultaneously gaining immense leverage on its invested capital. However, in the late 1980s a perfect storm of commodity deflation, stress in commercial real estate, and anathema for the conglomerate model wreaked havoc on Edper.
In a matter of years, the capitalization of Edper declined by ninety percent, and by the mid1990s the Bronfmans had exited their ownership entirely. Cockwell assumed the role as CEO and the following years would mark the onset of simplification for Edper as important subsidiaries like Hees International and Brascan Limited were formally merged into the group. In addition, behind the scenes in the mid-1990s Bruce Flatt was hard at work saving Edper’s real estate arm, which would become Brookfield Property Group.
Flatt earned a reputation as a shrewd dealmaker, and following the terrorist attacks of 9/11, his hands on approach in restoring properties owned by Brookfield immediately adjacent to the World Trade Center secured his position as Cockwell’s choice as successor. In 2002, Bruce Flatt was named the CEO of Brascan Corporation (fmr. Edper). Under Flatt’s leadership, Brascan began to focus itself around three core operating businesses - real estate, financial services, and power generation.
It was at this time that Brascan also began its foray into third party asset management, which was initially conceived as a way to leverage the company’s existing capabilities to increase overall return on capital. The initial asset management strategies included a $400 million restructuring fund formed in partnership with Canada Pension Plan Investment Board and a $600 million real estate lending fund. In both strategies, Brascan committed approximately half of the capital itself.
The opportunity for scale within asset management soon became apparent, and by 2006 Brascan had officially changed its name to Brookfield Asset Management and had grown to approximately $9 billion in fee bearing private capital. Fast forward, and in less than two decades Brookfield has increased its fee bearing capital under management by approximately 40x, and the asset management division, which required negligible capital investment to establish, produces more in fee income per year than the entire market capitalization of Brascan when Bruce Flatt took over in 2002.
Company History Cont. - The Demerger
While most publicly traded asset managers derive value principally from fee income, Brookfield has long had two core drivers of value: internal invested capital and asset management fee income. However, in 2022 Brookfield announced its intention to spin off its asset management division into a separate public company, anticipating that pureplay exposure would highlight the value of the asset management franchise.
This transaction would create two public companies - the pureplay asset management business that would retain the name Brookfield Asset Management, and the remainco that would be renamed Brookfield Corporation. Management believed that, valued under a framework comparable to peer alternative asset managers, the new entity could be valued as high as $60 - $80 billion.
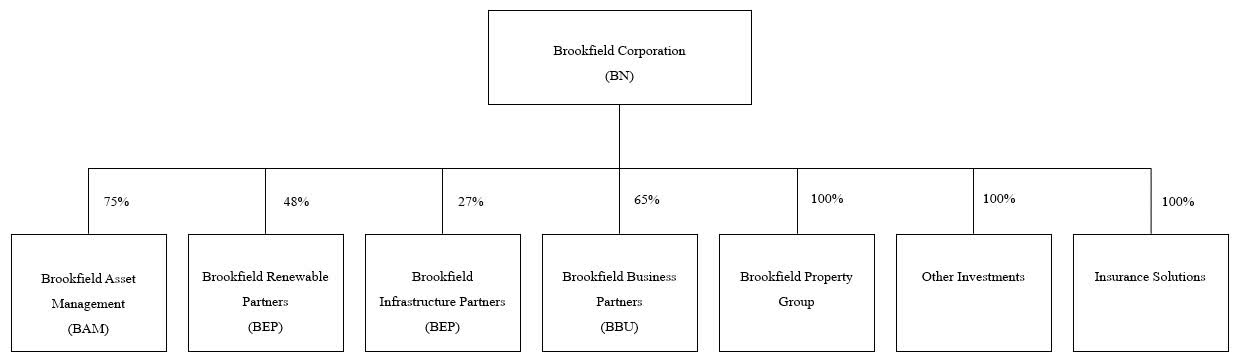
In addition, because Brookfield Corporation would retain seventy-five percent ownership of the asset manager, the transaction would serve as a revaluation catalyst for the remainco, as Brookfield Corporation would then own ± $50 billion of a publicly listed asset manager in addition to the ± $50 billion of operating assets it already owned.
One notable difference, however, was that in contrast to peers like Blackstone that earned significant fee income from carried interest, the transaction was structured such that Brookfield Corporation would keep all carried interest from the existing funds and one-third of all carried interest from all future funds. This was a significant component of value, as realized carried interest was expected to be approximately forty percent of all fee income going forward, and realized carry from existing funds would account for virtually all carry through 2030.
Nonetheless, on December 12, 2022 the demerger was successfully completed, and Brookfield Asset Management began to trade at a $60 billion valuation, or roughly 30x fee related earnings. At the same time, shares of Brookfield Corporation lost $15 billion of market capitalization. Therefore, while the transaction was intended to shed light on value across Brookfield, the lofty valuation fetched by the asset manager actually served to increase the discount of Brookfield Corporation even further.
Approximately ninety-three percent of cash earnings power was retained by Brookfield Corporation in the transaction, but its equity value fell by twenty percent. This created a unique opportunity to invest in what was already an under-appreciated high-quality business.
Brookfield Renewable Partners ( BEP | 48%)
Brookfield Corporation has $9.2 billion invested through Brookfield Renewable Partners, a publicly traded permanent capital vehicle that invests in renewable power and decarbonization solutions. The partnership is Brookfield’s longest standing listed investment vehicle and over the past two decades has assembled one of the world’s largest portfolios of hydroelectric, wind, solar, and renewable storage assets.
The origins of Brookfield Renewable trace back to the Great Lakes Hydro Income Fund, which owned three hydroelectric generating stations located along the Lievre River that produced an annual average of 1,400 gigawatt hours ( GWH ) of electricity. Following its listing, Great Lakes Hydro under the leadership of Richard Legault acquired and developed an additional thirty-nine hydroelectric generating stations from 1999 to 2010, adding more than 4,000 GWh of annual electricity production.
Meanwhile, because Great Lakes Hydro was a controlled subsidiary of Brookfield, Richard Legault, alongside other executives at Brookfield, spearheaded efforts to assemble an extensive portfolio of hydroelectric power assets that were owned by Brookfield directly. By 2010, Brookfield Renewable Power Inc., a wholly owned subsidiary of Brookfield, had acquired 128 hydroelectric generating stations that it owned in addition to the assets owned via Great Lakes Hydro.
Shortly thereafter, in 2011, Brookfield opted to consolidate all its renewable power assets into one investment vehicle under what was already a unified management structure, which formed Brookfield Renewable Partners. The new entity owned and operated 170 hydroelectric generating stations in North America and Brazil that produced 15,200 GWh of annual electricity, or more than a 10x increase since inception.
In addition, the partnership inherited three wind facilities, two natural gas fired power plants, and a substantial 5,000 GWh development pipeline of renewable power projects. Notably, in contrast to more recently established renewable energy platforms, Brookfield Renewable Partners remained almost entirely hydroelectric power focused until 2011, and its cash flows remained over seventy percent hydro-centric until 2020.
This resulted from Brookfield’s strong value orientation and aversion to projects that relied heavily on subsidy markets. Today, Brookfield Renewable Partners owns and operates 229 hydroelectric power facilities that produce an annual average of 20,000 GWh of electricity. These hydro assets remain the bedrock of the current portfolio and account for approximately half of the partnership’s $1.4 billion in assetlevel cash flows.
What’s more, quality of cash flows varies greatly across the renewables sector. Hydro assets achieve the highest relative capacity factors, offer natural energy storage solutions in the form of reservoirs, and, in contrast to solar and wind assets that have a useful life of twenty-five years, are perpetual in nature. For example, the original Lievre River assets that were contributed to the Great Lakes Hydro Income Fund were constructed between 1929 and 1954. In 2022, Brookfield Renewable Partners signed a new forty year power purchase agreement ( PPA ) with the government of Quebec to offtake the power from these exact assets.
In other words, by the end of this term the oldest of these generating stations will have been revenue producing for more than 130 years. As a result, the capital required to sustain production from hydro is seven times less than that of wind and solar, resulting in a free cash flow conversion that is nearly fifty percent greater.
Nevertheless, as hydroelectric assets have become increasingly scarce and as the economics of other renewable technologies have improved in recent years, Brookfield Renewable Partners has been rapidly scaling its solar and wind portfolio. At present, the partnership owns 131 wind facilities, 156 utility scale solar facilities, and more than 6,000 distributed generation facilities, often in the form of commercial and industrial solar or community solar installations.
These non-hydro assets collectively produce more than 11,000 GWh of electricity and more than $700 million in cash flows per annum. Of note, development expertise has become increasingly important in these newer verticals. As such, Brookfield Renewable has acquired a number of world class development platforms over the last several years, including X-ELIO, Urban Grid, and Scout Clean Energy, where the transactions not only consisted of attractive operating assets but also substantial development pipelines.
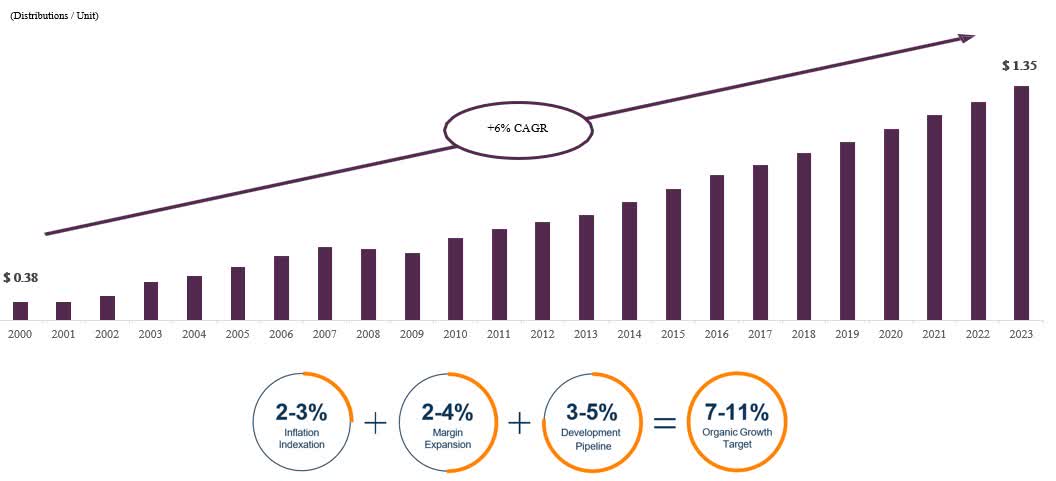
From a standing start, the partnership now has a development pipeline of over 200,000 GWh of power projects, primarily in wind and solar, that offer accretive deployment opportunities, as greenfield projects target fifteen to twenty percent returns. Indeed, this development activity is now reaching an inflection point for the partnership. Over the next three years, Brookfield Renewable expects to bring online over 25,000 GWh of development that on a proportionate basis will contribute $170 million in annual cash flows.
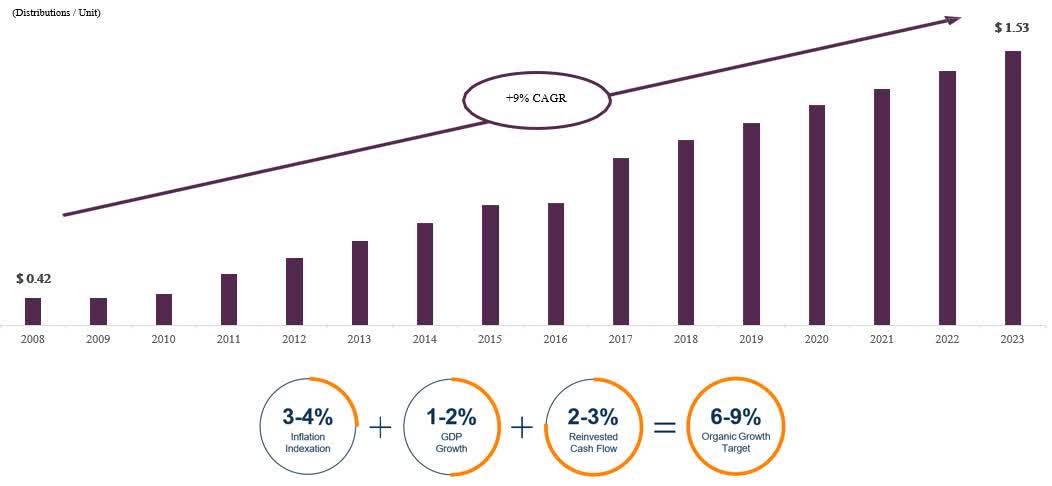
In other words, this activity supports five percent per annum cash flow growth across the entire renewables portfolio, which Brookfield believes it can sustain given its depth of pipeline. In addition to this, the partnership has significant visibility into cash flow growth from re-contracting capacity as it becomes available and via production indexed to inflation. Brookfield Renewable Partners expects 5,500 GWh of generation to come available for re-contracting over the next five years that should fetch an average $25/MWh uplift as prices are rebased to market rates, which will contribute an additional $130 million in cash flow per annum or three percent annual growth.
Furthermore, approximately seventy percent of production revenues are inflation linked, which at a three percent long-term inflation rate secures two percent annual growth in cash flows. Finally, this growth is delivered with exceptionally high downside protection. Brookfield Renewable Partners has seventy percent gross margins across its portfolio, and ninety percent of revenue is contracted for an average of fourteen years. This is matched with asset-level non-recourse financing that has a twelve year weighted average duration and a fixed interest cost of approximately five percent.
For more than two decades, Brookfield Renewable Partners has compounded at seventeen percent per annum, or nearly one thousand basis points in excess of global equity markets. Today, Brookfield Corporation receives $420 million in distributions from its capital invested through Brookfield Renewable Partners, or roughly a 4.5 percent yield. When married with the growth drivers detailed above, this is expected to continue to deliver a low-teens total return.
Brookfield Infrastructure Partners ( BIP | 27%)
Brookfield Corporation has $7.6 billion invested through Brookfield Infrastructure Partners, a publicly traded permanent capital vehicle that is one of the largest owners and operators of critical global infrastructure. The entity was demerged from Brookfield in 2008 and was seeded with interests in 1.2 million acres of timberlands in Canada and the United States and interests in 10,900 kilometers of electricity transmission assets in Chile, Brazil, and Canada.
The oldest of these assets, Great Lakes Power Transmission Co., an electricity transmission system based in Ontario, was acquired by Brascan in 1982. Brookfield Infrastructure Partners has significantly enhanced the quality, scale, and diversity of its portfolio over the last fifteen years. The timber assets were fully divested, and rail networks, toll roads, diversified terminals, last-mile utilities, midstream energy, and digital infrastructure were added.
The partnership now owns many of the world’s premier infrastructure assets, several of which were acquired for value during a dislocation. For example, in 2020 Brookfield Infrastructure Partners acquired a six percent ownership interest in Sabine Pass, the largest LNG export facility in the United States. The transaction occurred amid unprecedented lows in natural gas pricing and an oversupplied LNG market. The partnership paid $1 billion for its interest, which was funded with forty percent equity and sixty percent low cost debt.
In 2022, Sabine Pass generated $2.5 billion in earnings, or approximately $120 million in earnings against Brookfield Infrastructure Partners’ $400 million equity investment, equating to a thirty percent cash on cash yield. Moreover, in February 2023 Sabine Pass commenced planning on a large-scale brownfield capacity expansion of up to twenty million tons per annum (mtpa), representing a potential sixty-five percent increase in production.
Construction could begin as early as 2025 and would support years of highly accretive capital deployment. Although the supernormal returns of this transaction are atypical, Brookfield Infrastructure Partners has a proven record of consistent dealmaking across market cycles. Since inception, the partnership has generated $7 billion in proceeds at a blended twenty-six percent IRR across twenty-two concluded investments. Eighteen of these investments achieved greater than a fifteen percent IRR, and only one investment lost money.
Reverting to the broader portfolio, Brookfield Infrastructure Partners segments its operations into four areas: utilities, transport, midstream, and data. The utilities segment owns and operates a portfolio of regulated assets, including electricity and gas transmission assets, and last-mile utility interconnection and distribution infrastructure. The current rate base for these assets is $7.3 billion, and Brookfield Infrastructure Partners earns a blended twelve percent regulated return on this base, which equates to $870 million per annum, or thirty percent of aggregate cash flows.
The transport segment is comprised of infrastructure assets that are involved in the movement of freight, commodities, and passengers. This includes 32,000 kilometers of rail, 3,800 kilometers of toll roads, 11 diversified terminals (container, dry bulk, etc.), the largest LNG export facility in the United States, and the world’s largest metallurgical coal export facility. These assets charge fees for access or volumes processed and are ninety percent contracted for an average of ten years. They also account for $800 million in annual cash flows, or roughly thirty percent of the aggregate.
The midstream segment consists of natural gas transmission, processing, and storage systems. This includes 25,600 kilometers of pipelines, 17 natural gas and natural gas liquids processing plants, 600Bcf of natural gas storage, and the Heartland Petrochemical Complex. This segment produces $800 million in annual cash flows, or thirty percent of the aggregate, which are eighty percent contracted for an average of eleven years. Finally, the data segment encompasses infrastructure that supports the transmission, storage, and processing of data. This includes 209,000 telecom towers, 46,600 kilometers of fiber optic cable, 881,000 fiber-to-the-premise connections, and 50 data centers.
As Brookfield Infrastructure Partners’ newest vertical, the data segment currently generates $280 million in annual cash flows, or roughly ten percent of the partnership’s total. These cash flows are ninety-five percent contracted for an average of fourteen years. Notably, while the partnership has an expertise in acquiring quality infrastructure, development capabilities also play a key role. This can take the form of capacity additions or other strategic investments that are part of the value creation roadmap for an acquired asset or funding a de novo project.
For example, within the data segment Brookfield signed an agreement with Intel in August 2022 to jointly invest up to $30 billion in a leading semiconductor fabrication facility in Arizona. Brookfield Infrastructure Partners will invest $3.6 billion for their share of the project, with the remaining capital coming from Intel and Brookfield’s flagship infrastructure funds. This is one of many large-scale capital projects that could result from the reshoring of critical manufacturing in the United States.
Since inception, Brookfield Infrastructure Partners has compounded its unit value at fifteen percent per annum, or nearly nine hundred basis points per annum in excess of the global equity index. Today, Brookfield Corporation receives $320 million in distributions from its capital invested through Brookfield Infrastructure Partners, or a 4.2 percent yield. When married with organic growth underpinned by inflation-indexed cash flows, volume growth closely linked to GDP, and accretive capital recycling, this is expected to continue to deliver a low teens total return.
Brookfield Business Partners ( BBU | 65%)
Brookfield Corporation has $5.5 billion invested through Brookfield Business Partners, a publicly traded permanent capital vehicle that invests in industrials and business services companies. The group spun off from Brookfield in 2016 and was seeded with sixteen existing private equity investments across industrials, construction, oil and gas, and business services. Notable holdings included GrafTech, the leading producer of graphite electrodes, and Multiplex, a prominent Australian construction company.
The portfolio value at inception was $2.5 billion, and Brookfield retained seventy-eight percent ownership. To date, under the leadership of Cyrus Madon, Brookfield Business Partners has realized $5.5 billion in proceeds while generating an average four times multiple on capital and thirty percent IRR across twelve concluded investments. In addition, the partnership has executed more than twenty new investments, totaling $8.0 billion in deployed capital, over the last seven years.
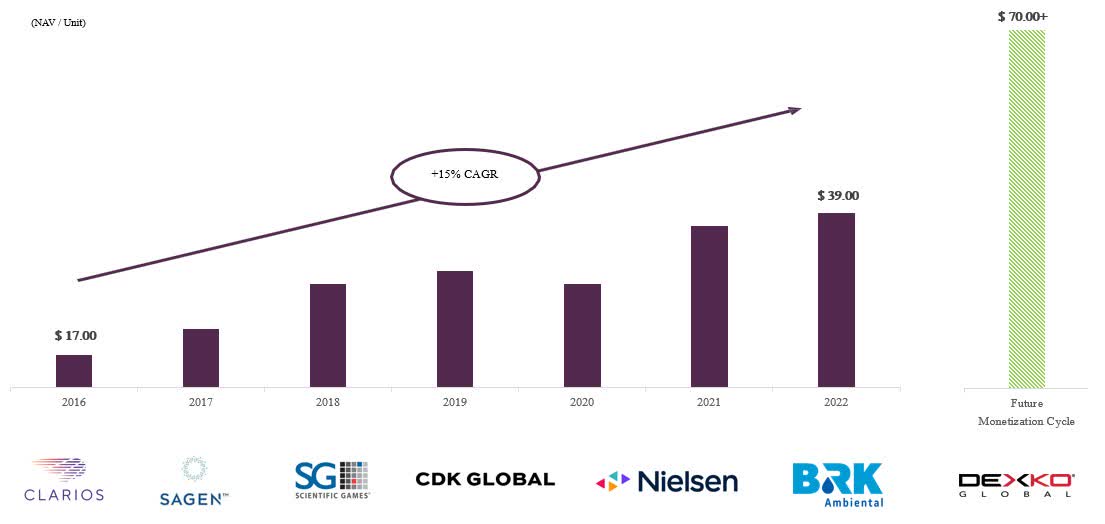
What’s more, the quality of portfolio companies improved meaningfully over this time as proceeds were recycled from the sale of smaller, more cyclical businesses to fund the acquisition of larger businesses with increased scale, significant barriers to entry, and more resilient cash flows. For instance, the four largest companies within the current portfolio - Nielsen, Clarios, Sagen, and CDK Global - generate over ten times the cash flow of the four largest companies in 2016.
However, what has remained unchanged over the years is Brookfield’s intense operational approach. At the outset of each investment, Brookfield crafts a detailed value creation plan, which, given the capital structure often employed in leveraged buyout transactions, has an outsized influence on shareholder outcomes. For example, over the last five years on an average equity capital base of less than $5.0 billion, Brookfield Business Partners has improved EBITDA at its underlying companies by $275 million.
In other words, these improvements, which are often implementable regardless of the macro environment, added $2.75 billion in net asset value at a ten times multiple. Likewise, Brookfield has plans in motion across its portfolio companies to surface an additional $500 million in EBITDA over the coming years, which has the potential to significantly increase the existing $8.5 billion net asset value. Indeed, when coupled with natural deleveraging, these initiatives provide visibility to a base return of 1.7x - 2.0x, or approaching $11 billion for Brookfield Corporation’s share over the coming monetization cycle.
Other Investments
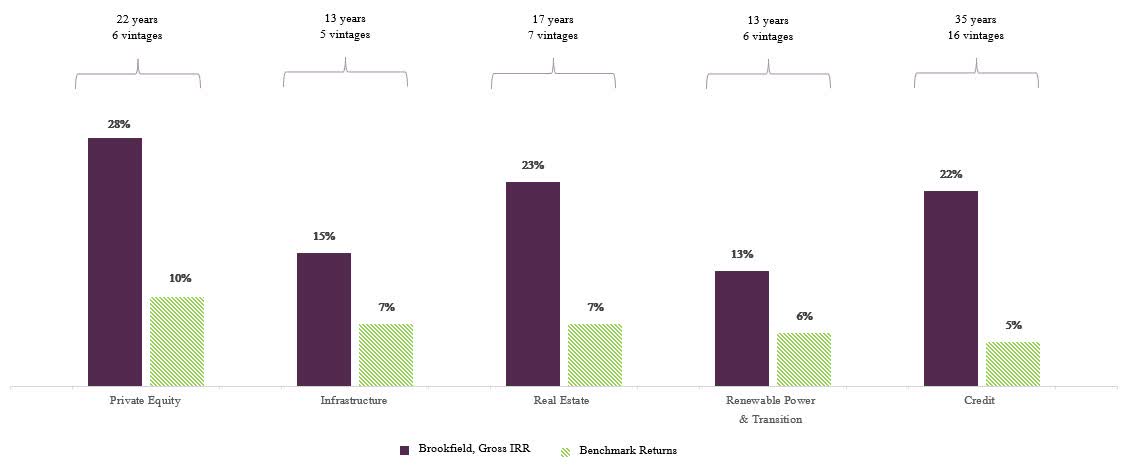
In addition to its listed perpetual capital vehicles, Brookfield Corporation has $12.4 billion invested directly in its institutional funds alongside limited partners. This includes $7.7 billion invested in the Brookfield Strategic Real Estate Partners (BSREP) flagship fund series, which owns assets with operational upside across office, retail, multifamily, logistics, hospitality, triple net lease, self-storage, student housing, and manufactured housing.
These funds target eighteen to twenty percent gross returns, which Brookfield has achieved over multiple vintages. A further $1.4 billion is invested in other private real estate funds, which are comprised of core, core plus, value-add, and real estate debt strategies. Beyond real estate, $1.5 billion is allocated to Brookfield’s private equity funds, which include the Brookfield Capital Partners ( BCP ) flagship fund series, Brookfield Special Investments (BSI), and Brookfield Growth (BTG).
These funds have compounded returns on a gross basis at almost thirty percent per annum over the last two decades. Finally, $1.6 billion is allocated to opportunistic credit funds that are primarily managed by Oaktree Capital Management. For more than three decades, Oaktree’s value-driven and contrarian approach to credit investing has delivered compounded annual returns in excess of twenty percent on a gross basis.
Brookfield Property Group
Remember that interest rates rise once, but our cash flows can keep growing forever. (Bruce Flatt)
Brookfield is one of the world’s largest investors in real estate, particularly in office properties, and as such has garnered its share of headlines in the current environment of increasing rates. The corporation, in addition to owning investments through its managed real estate funds, directly owns a $22 billion portfolio of global office and retail properties. Also, Brookfield Property Group owns a $2 billion portfolio of residential properties and land across the United States and Canada.
Although the expansion of the real estate platform began in earnest in the 1990s, Brookfield has been active in various facets of the real estate business since the 1970s. In fact, the entity that would become the primary real estate arm for Brookfield was formerly the Canadian Arena Corporation, the owner of the Montreal Canadians and the Montreal Forum, which Brookfield acquired in 1971. Over the last half century, Brookfield’s wholly owned property portfolio has been curated through a mix of select asset purchases, internal development, and large scale portfolio acquisitions, such as with GGP, Trizec, Rouse, BCED, and Olympia & York.
Today, the office portfolio consists of interests in 106 properties in some of the world’s leading commercial markets, such as New York, London, Sydney, Toronto, and Berlin. These properties are valued in aggregate at $11.4 billion and are segmented into two categories: (i) ninety value-add office assets with operational upside potential and (ii) sixteen core office assets that are irreplaceable trophy properties. The latter category includes iconic mixed-use office complexes, such as Manhattan West in New York and Canary Wharf in London, and accounts for approximately $8 billion of the total office portfolio net asset value.
These properties have maintained strong occupancy rates at ninety-four percent on average and have an average remaining lease term of nine years. Furthermore, an additional thirty-one office properties within the value-add segment are ninety-eight percent occupied on average with a remaining lease term of eight years, which accounts for another $1.2 billion in net asset value. In other words, in contrast to broad-brush media reporting that highlights office vacancy rates exceeding twenty percent in major metros, more than eighty percent of Brookfield’s office portfolio is covered by long-term contracted, high-occupancy assets, of which most are trophy properties with significant mixed-use components.
Brookfield believes there is a simple explanation for the disparity - the post pandemic recovery in office has been heavily weighted toward the best office assets. Corporates seeking to lure employees back to the office, often while simultaneously consolidating their footprint, naturally opt to trade up in quality. This has accelerated obsolescence at Class C and B properties and driven record rents at the premium end of the market.
Within the retail portfolio, Brookfield currently owns interests in 113 properties that include some of the highest productivity shopping centers in the United States. These assets were acquired when Brookfield led the restructuring of General Growth Properties in 2010, initially acquiring a twenty-five percent ownership interest for $2.65 billion before ultimately acquiring the entire company in 2018.
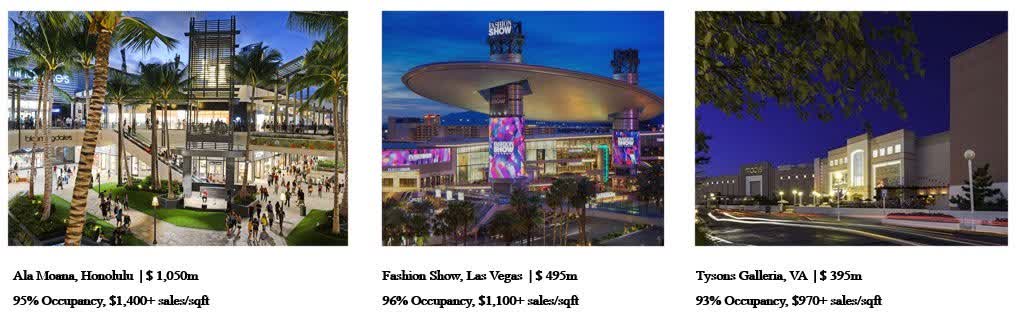
At present, these properties are valued at $10.8 billion and, like office, are segmented into two categories: (i) ninety-four value-add retail properties and (ii) nineteen core retail assets that are irreplaceable trophy properties. The latter category accounts for $6.4 billion of the aggregate retail net asset value and includes properties like Ala Moana in Honolulu and Fashion Show in Las Vegas, where occupancy is high and tenant sales per square foot are double to triple that of an average shopping mall. Furthermore, an additional twenty-six retail properties within the value-add segment are ninety-six percent occupied on average and account for another $3.2 billion in net asset value.
In other words, nearly ninety percent of Brookfield’s retail portfolio net asset value is covered by quality, high-occupancy assets. Indeed, in 2022 tenant sales increased to approximately seventeen percent above pre-covid levels across Brookfield’s retail properties, which marks the strongest year on record.
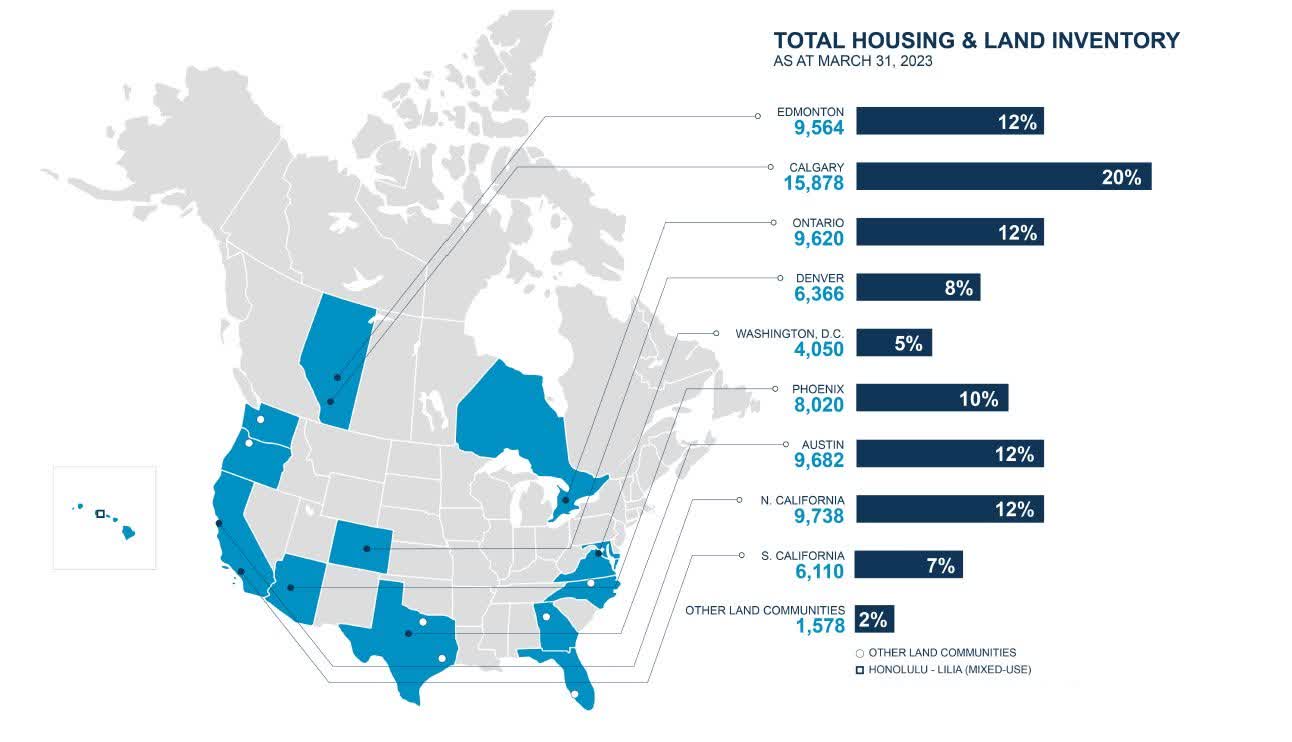
Finally, with thirty-nine years of operating experience, Brookfield Residential is one of the longest standing real estate verticals for Brookfield. The group has delivered strong returns over many market cycles as a land developer in North America and currently owns more than 70,000 residential land plots in supply constrained markets like Calgary (AB), Austin (TX), Denver (CO), Washington D.C., Phoenix (AZ), California, and Ontario.
Brookfield will acquire and oversee raw land through the entitlement phase, which can span many years, and once approvals have been obtained will build homes on a portion of the development while selling the balance of lots to other home builders. Margins for land sales have consistently been around forty percent, while home building has generated eighteen percent margins. Although the business is more valuable as an ongoing operating entity, consider that Brookfield Residential could generate more than $7 billion in gross proceeds from liquidating its existing land bank as entitlements are received.
Insurance Solutions
Since 2020, Brookfield has invested heavily in scaling its insurance solutions business. This division underwrites predictable, long-term insurance liabilities, primarily in the life and annuity verticals, and leverages Brookfield’s investment capabilities to earn a spread over and above the cost of funds. Likewise, there are adjacent institutional markets, such as pension risk transfer and reinsurance, in which Brookfield has been active since 2017, that have similarly predictable long-dated liability structures.
These markets offer tremendous scale to alternative asset management firms, as there are $4.5 trillion of life and annuity liabilities and $3 trillion of private sector defined benefit liabilities in the United States alone. Moreover, it has become evident that the bottleneck in this space is not originating liabilities, but rather sourcing quality assets to match against those policies. In this respect, the large asset management platforms are extremely well positioned, as their investment capabilities are significantly more sophisticated than a traditional insurance company.
Perhaps the best way to frame Brookfield’s insurance solutions business is as a better form of a bank. In contrast to banks who borrow short and lend long, the insurance division borrows long and invests long. For example, at inception an annuity contract can have a duration of seven to ten years, which allows Brookfield to originate and hold higher yielding long-term assets against these policies. Generally, Brookfield will target a net spread that is 100 basis points to 150 basis points greater than the cost of funds, which translates to a mid-teens return on equity.
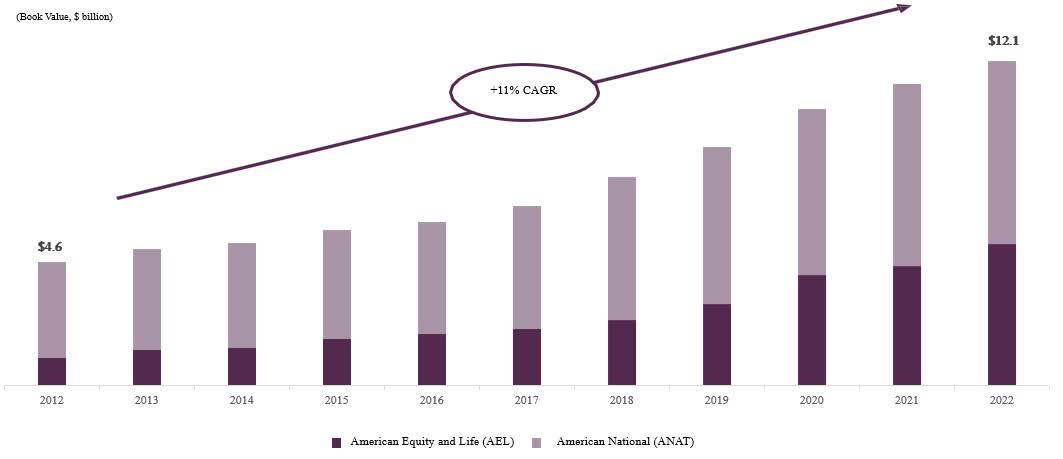
There have been several important building blocks that have set the foundation to scale Brookfield’s insurance operations. In 2021, Brookfield agreed to acquire American National, a leading life and annuity provider with more than $6 billion of book value, for $5.1 billion. The company has a long history of profitable underwriting, and its conservative balance sheet allocation provided scope to drive immediate earnings growth through leveraging Brookfield’s investment platform.
Under Brookfield’s mid-teens return on equity target, which is currently being exceeded, American National was acquired for less than seven times earnings. More recently, Brookfield agreed to acquire American Equity and Life, a leading fixed-indexed annuity provider with $5.5 billion of book value, for $4.3 billion. This also represents an attractive acquisition price and is set to increase Brookfield’s aggregate direct written annuity volumes to nearly $8 billion annually.
Finally, in contrast to the insurance strategies at other alternative firms that are solely focused on the retirement services sector, Brookfield intends to scale its property and casualty underwriting, as well. American National has grown its written premiums in property and casualty from $1 billion in 2013 to a run rate of $1.8 billion, while achieving loss ratios consistently less than seventy percent. These premium volumes are split roughly half and half between personal lines, such as home and auto, and commercial lines, such as agriculture, business owner, workers compensation, and other specialty lines.
In addition, Brookfield recently agreed to acquire Argo Group, a specialty property and casualty insurer, for $1.1 billion. This adds a further $1.5 billion in annual written property and casualty premiums, where Argo has a long history of underwriting with less than seventy percent loss ratios. As Brookfield leverages its expertise in optimizing the organizational structure of the combined property and casualty operation, achieving an industry average expense ratio of twenty-six percent would result in a mid-nineties percent combined ratio and a mid-teens return on equity.
Valuation
Brookfield Corporation’s invested capital growth is supercharged by profits from one of the best business models in the world, alternative asset management. The alternative asset management sector has tripled in size over the last decade, growing from approximately $5 trillion to $15 trillion in assets under management.
However, Brookfield and other large global platforms have managed to grow at nearly double this rate, or in excess of twenty percent per annum. Institutional investors (pensions, endowments, sovereign wealth funds, etc.) account for ~$100 trillion in global investable assets, and these groups have doubled their allocations to alternatives over the past decade. The rationale is simple: private markets have outperformed their public counterparts by 400 basis points per annum across both equity and credit.
Moreover, while private asset classes have traditionally been perceived as requiring an illiquidity premium, allocators are increasingly weighing the inconveniences of liquidity (i.e., career risk) in their decision making. If two investments are expected to have identical returns over the long term, is daily liquidity really worth the heartache of knowing that at some point you will have to explain to your board why an investment is down thirty percent in six months?
What’s more, the largest markets in global finance remain practically untouched by alternatives. Individual investors account for ~$170 trillion in global investable assets, and their exposure to alternative investments is negligible. The democratization of alternatives is reaching an inflection point, and it will be the platforms with the longest track records and best brands that will flourish in this new channel. Increasing institutional allocations aside, consider that if alternatives reach only ten percent penetration in retail portfolios, this would double the current market size.
This has set up the alternative investment sector for yet another robust decade of growth. To add to this, Brookfield in particular is well positioned. The group has strong franchises in asset classes that are growing immensely in investor demand, such as renewables and infrastructure, and its acquisition of Oaktree has supported the rapid scaling of its insurance business. Today, Brookfield oversees more than $400 billion in assets under management that generates $2.2 billion in fee related earnings.
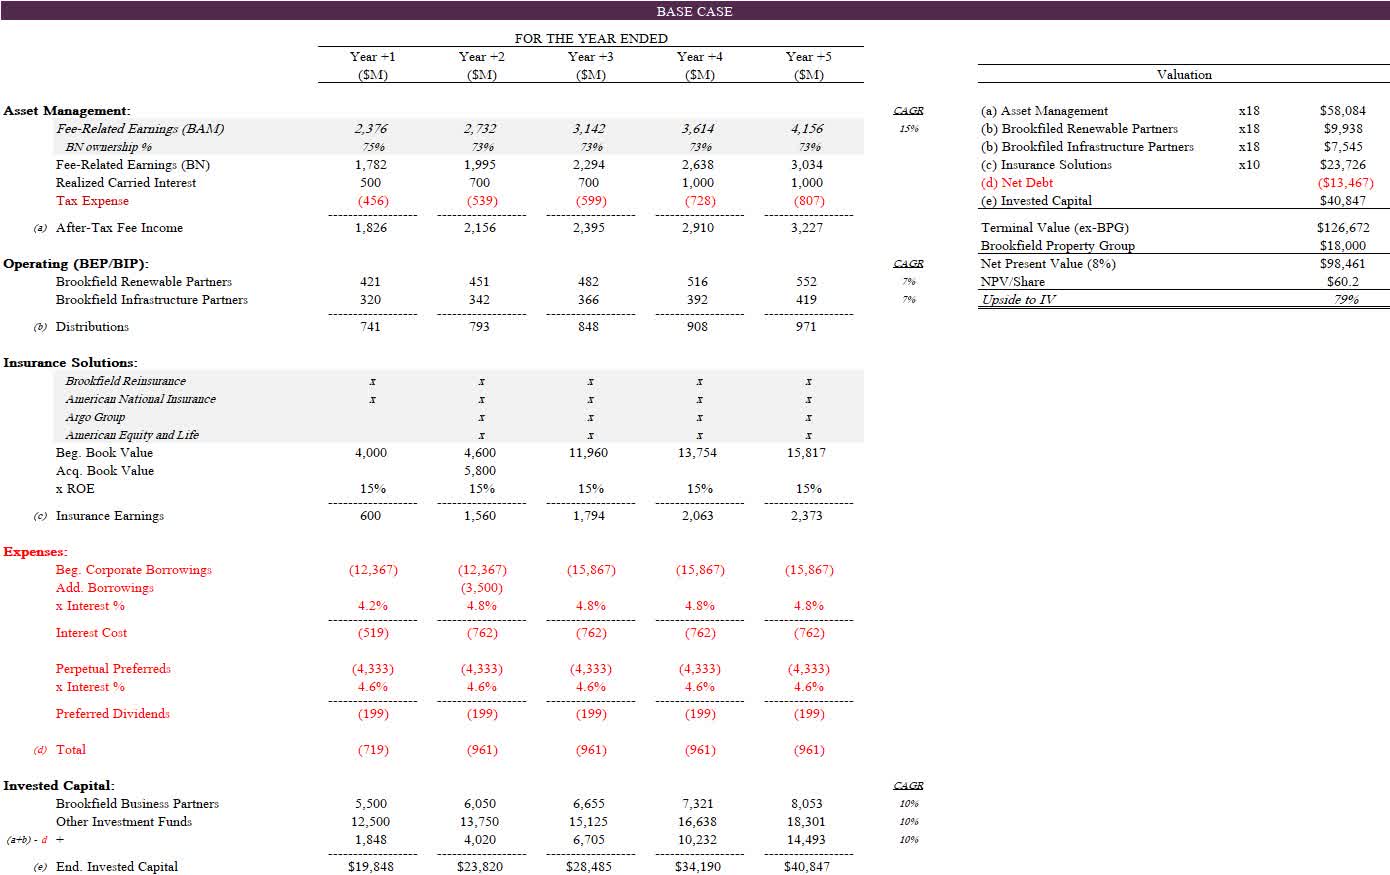
Brookfield expects to raise more than $100 billion in new AUM per year over the next five years and grow fee related earnings at twenty percent per annum.
The base case scenario modeled above is conservative on several measures. First, these projections imply that Brookfield misses its 2027 fee related earnings target by twenty percent and that realized carried interest falls sixty percent below Brookfield’s own internal modeling. This would be a notable departure from Brookfield’s history of exceeding its five year plans. Furthermore, a blended after-tax multiple of 18x on asset management income represents a significant discount to peers that commonly value headline fee related earnings, a pre-tax figure, at a multiple of 25x or more.
Second, while Brookfield Renewable Partners and Brookfield Infrastructure Partners are expected to achieve their growth plans, an exit multiple of 18x implies minimal capital appreciation over the next five years. These platforms have traded between a four to six percent distribution yield over the last decade, and so, in addition to offering a low-teens prospective return, this valuation would fall at the low end of the historical range.
Third, a 10x multiple is used for the insurance solutions segment. Although some may note that this translates to a premium to book value, this is precisely what has attracted so much private equity capital to the space. For every dollar of capital retained in the insurance business, Brookfield believes it can generate fifteen cents of long-term recurring earnings that, while labeled insurance, are principally derived from its core competency - sourcing quality investments. It is also worth noting that the model gives no credit to inorganic activity in the insurance segment beyond those deals already announced.
Fourth, capital invested in Brookfield Business Partners and via Brookfield’s fund structures is expected to compound at ten percent per annum, a sizeable discount to prior fund results across asset type and vintage.
Finally, Brookfield Property Group is expected to decline in value by twenty-five percent over the five year period, while also producing zero distributions. This is likely overconservative, as less than half the net asset value relates to office and because rates are expected to fall meaningfully over this period while property-level cash flows will continue growing.
Bringing this all together, the result is a base case scenario of $60.2 per share, or seventy-nine percent upside to intrinsic value. Expressed another way, Brookfield Corporation is expected to reach $88 per share over the next five years, which would result in a 2.6x multiple on capital and twenty-one percent IRR from the current share price.
Conclusion
Our opportunity set of assets that are underappreciated, run by operators with high co-ownership, and available at attractive prices remains robust. As always, I am happy to speak with you at length about any of our companies, and I remain grateful for your trust and partnership.
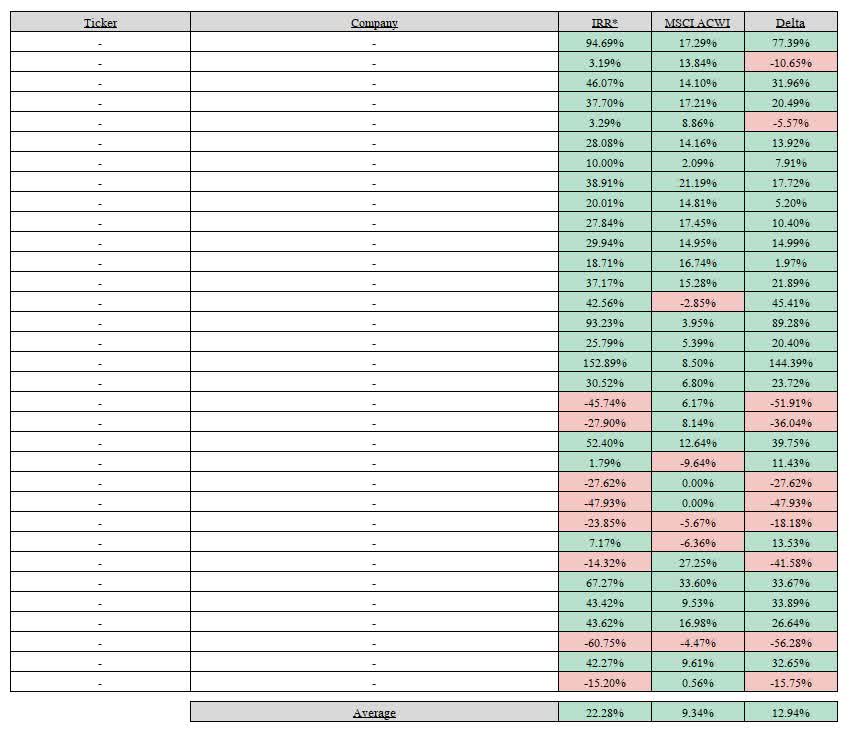
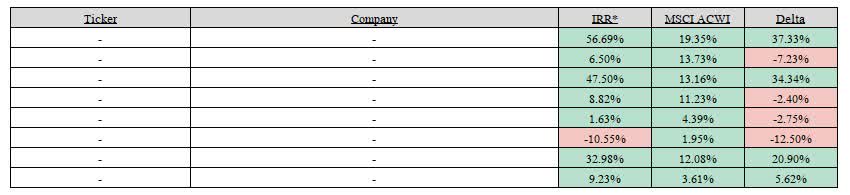
Appendix A: Realized Investments
| *Table above reflects the IRR of realized portfolio investments (unannualized if < 1 Year), and the equivalent IRR that would have been achieved had each invested dollar been allocated to MSCI ACWI. |
Appendix B: Unrealized Investments
| *Table above reflects the IRR of unrealized portfolio investments (unannualized if < 1 Year), and the equivalent IRR that would have been achieved to date had each invested dollar been allocated to MSCI ACWI. |
| Disclosures Investment in Emeth Value Capital are subject to risk, including the risk of permanent loss. Emeth Value Capital’s strategy may experience greater volatility and drawdowns than market indexes. An investment in Emeth Value Capital is not intended to be a complete investment program and is not intended for short term investment. Before investing, potential clients should carefully evaluate their financial situation and their ability to tolerate volatility. Emeth Value Capital, LLC believes the figures, calculations and statistics included in this letter to be correct but provides no warranty against errors in calculation or transcription. Emeth Value Capital, LLC is a Registered Investment Advisor. This communication does not constitute a recommendation to buy, sell, or hold any investment securities. Performance Notes Net performance figures are for a typical client under the standard fee arrangement. Returns for clients’ capital accounts may vary depending on individual fee arrangements. Net performance figures for Emeth Value Capital, LLC are reported net of all trading expenses, management fees, and performance incentive fees. Reported returns prior to January 1 st , 2021 reflect the personal account performance of Emeth Value Capital, LLC’s sole managing member, and therefore represent related performance. All performance figures are unaudited and are subject to change. Contact Emeth Value Capital welcomes inquiries from clients and potential clients. Please visit our website at Emeth Value Capital or contact Andrew Carreon at acarreon@emethvaluecapital.com |
Editor's Note: The summary bullets for this article were chosen by Seeking Alpha editors.
For further details see:
Emeth Value Capital H1 2023 Letter