EHC - Encompass Health: Incremental CapEx Adds Tremendous Torque To Flywheel
2023-08-07 00:27:06 ET
Summary
- Encompass Health Corporation has revised its growth outlook and capital investment spends for FY'23.
- EHC's growth strategy relies on building same-store revenues and adding new facilities to its portfolio.
- The company's de novo model and capital deployment trends add tremendous torque to its economic flywheel.
- Net-net, reiterate buy.
Investment briefing
Following another strong quarter from Encompass Health Corporation (NYSE: EHC ) numerous investment updates need deconstructing. Chief among these are the revisions to its growth outlook and some changes to its capital investment spends for the remainder of FY'23.
I had rhapsodized ad nauseum on the robust economic characteristics within EHC's investment arsenal that warranted it a buy on my rating back in May . This was the 4th allocation since mid-FY'22. I have sized up the position at each of the secondary entry points. Since I first profiled EHC in August last year , the stock has rallied ~33% into the green as I write.
Here I'll cover the moving parts in the EHC investment debate and explain why I believe EHC continues to be a buy on long-term value creation. If market returns do in fact resemble business returns over time, my opinion is EHC is primed to continue pricing higher over the coming 12—24 months. Net-net, reiterate buy.
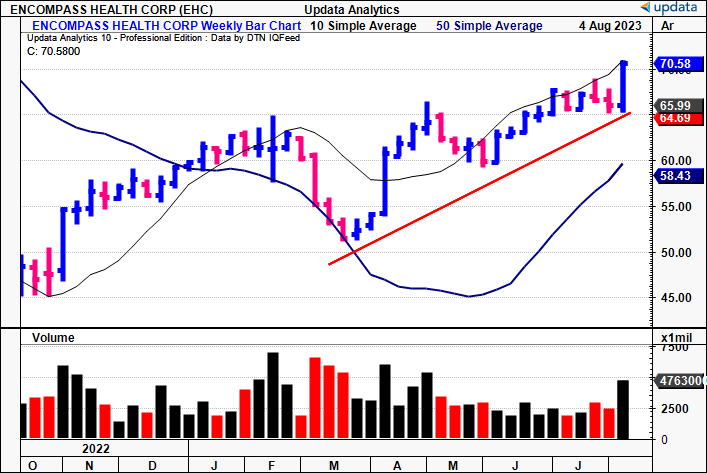
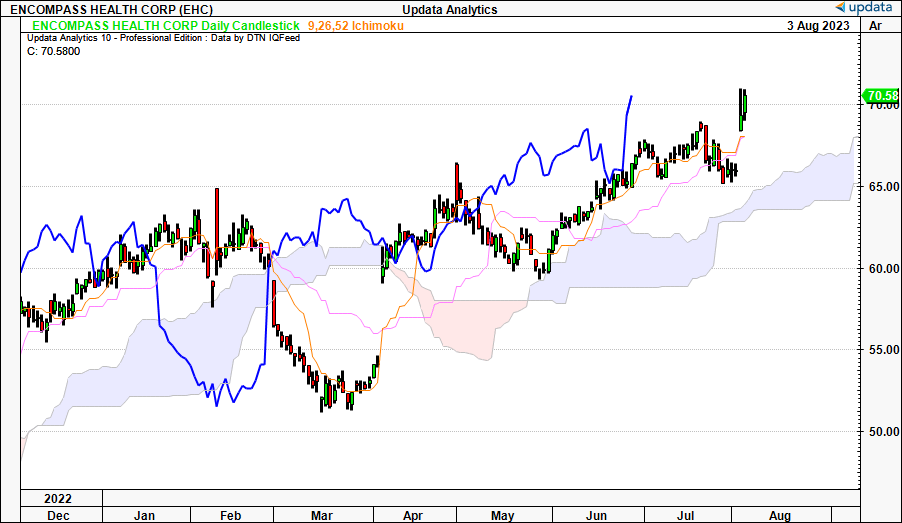
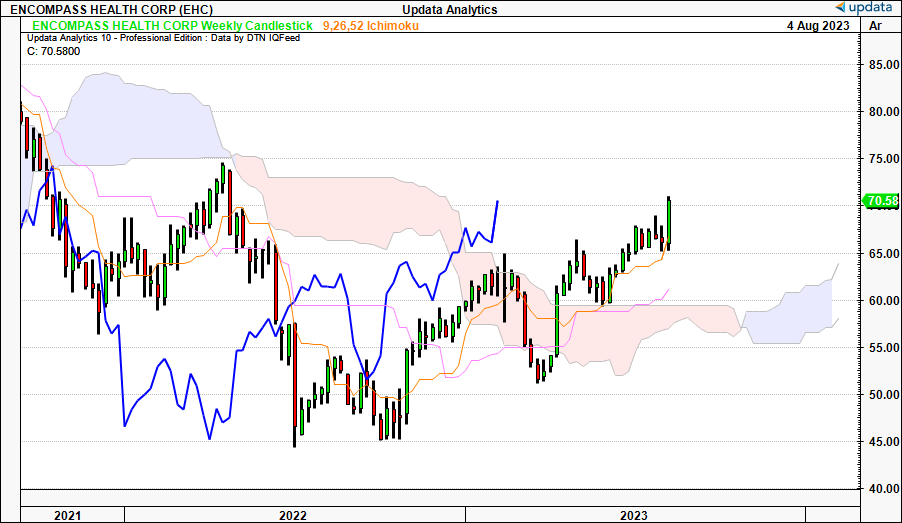
Figure 1. EHC price evolution [note: weekly bars].
Critical updates to investment thesis
EHC is the largest owner–operator of inpatient rehabilitation hospitals in the U.S. The economics of its growth strategy are relatively easy to comprehend, making it tremendously attractive in my eyes. It is a function of building same-store revenues [steady-state] + growth from adding de novo facilities to its portfolio [growth contribution]. It recognizes this on the basis of
In that vein, the company must deploy capital in two major avenues:
- Investments in new (de novo) facilities, adding additional beds this way;
- Building new beds in existing facilities; and
- Maintenance CapEx into existing facilities.
The economic features of this de novo model are central to my investment thesis, and I'll be constantly linking back to this point throughout the analysis.
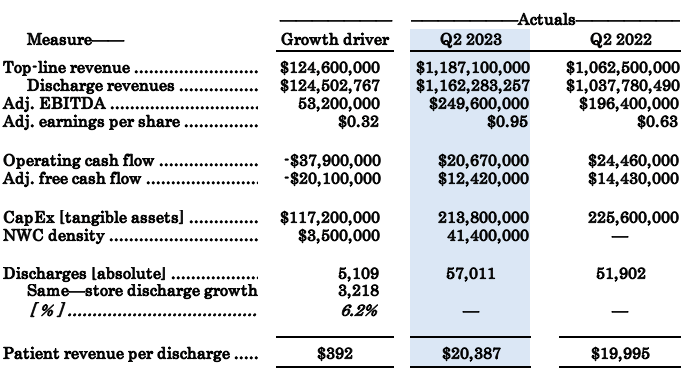
(1). Q2 earnings run-down
It was a tremendously strong 2nd quarter for EHC in my opinion. It clipped top-line revenues of ~$1.19Bn, up 11.7% YoY, and pulled this to adj. EBITDA of $249.6mm and adj. earnings of $0.91—up 50% from last year. These are strong growth percentages in my opinion.
Of this, discharge revenues are the most important numbers to extrapolate in my opinion:
- Patient discharge revenues were up $124.5mm YoY to $1.16Bn.
- This stemmed from an additional 5,109 discharges on top of Q2 last year. It grew total revenue per discharge by $392, or 200bps YoY, as a function of pricing and volumes.
- On a same-store basis, discharges grew by 3,128, meaning 1,981 or 27% of discharge growth came from new facilities.
This is where we start to see the company's flywheel in motion. Based on the revenues from new additions, my estimates put the patient revenue/discharge from its new facilities at $25,139, ahead of the overall discharge revenue of $20,287 per patient.
Figure 2.
(2). Capital deployment trends going forward
As mentioned, EHC's growth strategy relies heavily on contributions from new facilities, and new "beds" to add shareholder value. This requires ongoing investments into the same. The cash for this has to come from somewhere—for EHC, it has been a combination of issuing new debt, and recycling after-tax profits back into the business. As a testament to its capital allocations, investors are treated to a $0.60/share forward dividend, a payout ratio of ~17% of earnings, with $0.15/share declared in June.
Back to the CapEx strategy, the following points are relevant to the investment debate:
- The firm opened 2 de novos in Q2, adding 110 beds in doing so. It now has opened 5 facilities this year, comprising a total 259 additional beds. Also,10 beds were added to its existing hospital base.
- It looks to add 476 beds in total for FY'24, and collectively over the coming 2-3 years, aims to add another 996 beds to its books, ~1,255 including Q2 FY'23's additions.
- It held 10,611 licensed beds last period at 72.4% occupancy, resulting in 7,682 active beds during the quarter. This resulted in avg. revenue per bed of $0.155mm for the quarter [$0.62mm annualized], with operating profit per bed of $32K.
- Presume it maintains this occupancy, avg. run rate per bed. With EHC's projections for bed growth, this could add an additional $154mm in quarterly revenue [$617.5mm annualized] over the next 2–3 years, on an additional quarterly EBITDA of $31.8mm [127.5mm annualized].
Figure 3.
Data: Author, EHC SEC Filings
EHC's growth CapEx—i.e., investment in new facilities—for the YTD is ~$94.1mm, adjusting for a $21.3mm maintenance capital charge. At the rate of 5 new openings this year, EHC averaged ~$18.82mm investment per de novo on this (94.1/5 = 18.82). It now has 158 facilities in its portfolio. As a basic exercise, I've gauged what the annualized capital charge on its expansion plans might be into FY'26.
So far YTD, my calculations have the avg. quarterly revenue per de novo at $2.5mm and the avg. operating profit per de novo is ~$1mm [Figure 4]. Hence, the quarterly return on investment per new facility comes to 5.4%, 22% annualized. Critically, this is above the existing return on capital [discussed later] indicating the company's new facilities are more profitable than its existing ones. This is a tremendously valuable business flywheel that means:
- EHC has multiple opportunities to reinvest cash flows and deploy these to opening new facilities at high rates of return (22% annualized); and
- That capital allocation decisions are made far easier by this calculus—keep adding new beds, and/or opening new facilities.
Figure 4. EHC quarterly unit economics [capital allocation]
Data: Author
Figure 5. New openings offering leverage to profitability via high returns on the invested capital.
Data: Author
All going to plan it will have opened 7 de novos this year, 7 in FY'24, 8 in FY'25 and 4 in FY'26. Granted, some of these will be joint ventures, rendering the average investment number quite relevant in this instance.
At this pace of allocation I can see the firm pushing $131—$150mm in growth capital to this strategy into FY'25. Cumulatively, this gets me to $489.3mm in incremental capital EHC plans to deploy in the coming years. On my profitability estimates, this could result in a return on incremental capital deployed of 26% (127.5/489.3 = 0.26), illustrating my points raised earlier on the economic flywheel at bay here.
Figure 5. Note—2023E includes YTD 2023
Data: EHC Investor presentation, author
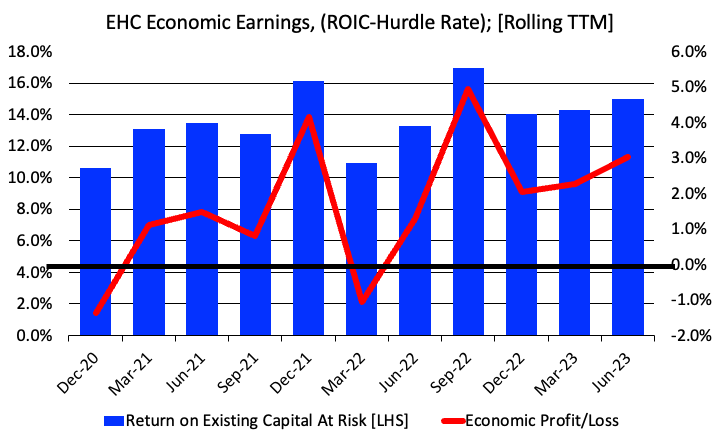
(3). Linking business returns to market returns
How this links back to the company's investment prospects is equally as critical to gauge. In my opinion, this is best shown by the economic earnings EHC has, and can generate moving forward.
Economic earnings are those profits earned above a specific hurdle rate—in this instance, the long-term average market return of ~12%. Hence, any of EHC's business returns on its capital at risk above 12% are marked as economic profits, and vice-versa.
A firm creates value for its shareholders when it produces economic earnings above the hurdle rate. Should it fail to do so, no amount of financial growth or earnings upside can offset the destruction of shareholder value. This is because investors want to position against the most valuable and efficient ways to compound capital. Market returns also closely mirror business returns over time, thus why measuring returns on capital deployed is so imperative in the first place.
Hence, you want your company do be generating returns on its own capital above the market return on capital—i.e., ~12%—to suggest it will compound its intrinsic value going forward. If it can deploy large sums of money at high rates of return—even better. if not, we still get this cash flow distributed to us as shareholders, either through dividends/buybacks, or as earnings growth.
You can see how EHC has compounded its intrinsic value and created economic value for its shareholders over the last 3-years in the chart below [Figure 6].
The following observations are made:
- Economic profits have trawled from -1% to ~3% over the testing window (TTM figures).
- This comes as the returns produced on its existing capital are each >12%, bar the two negative periods.
- Adding to this is the economic flywheel discussed earlier, where the incremental returns are now > than the historical ones.
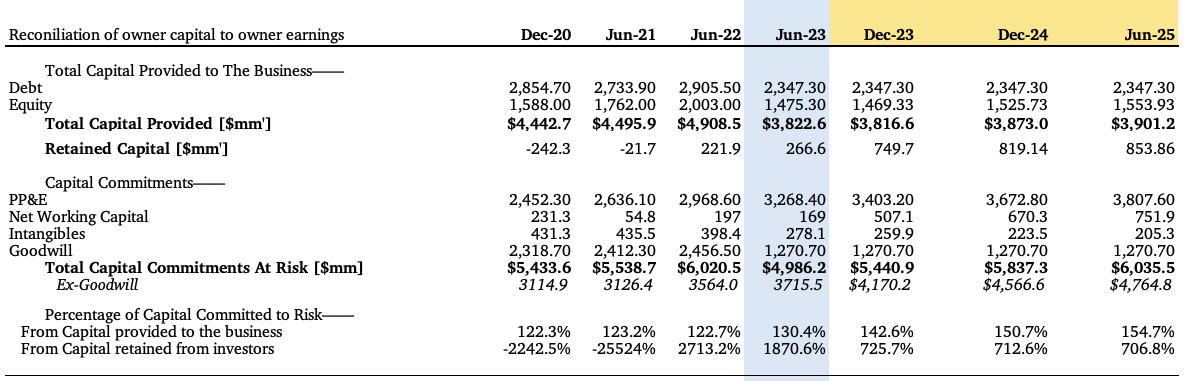
This follows a reduction in capital density from $5.4Bn to $4.98Bn over this time, yet, the total capital put at risk from capital provided to the business (debt, equity) is >130% [Figure 7], telling me EHC has recycled ~30% of retained earnings to growing asset base since 2020.
Figure 6.
Figure 7.
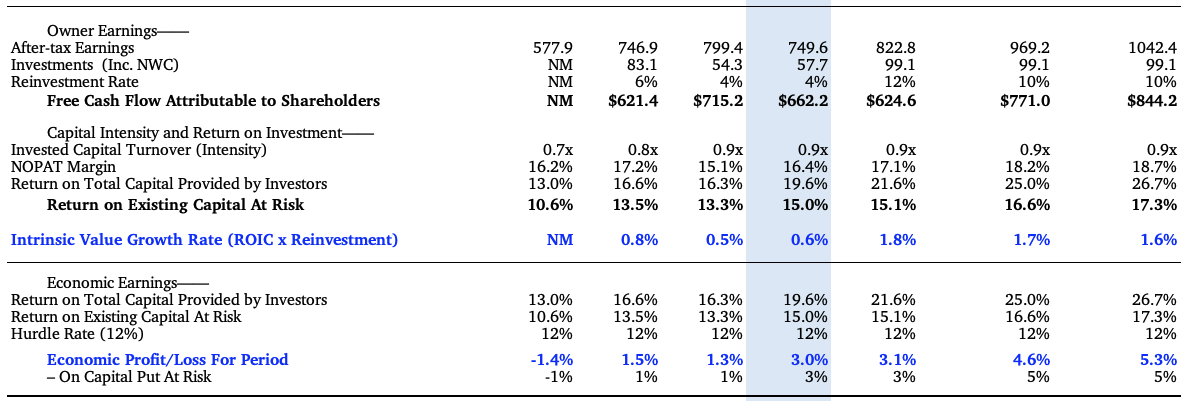
What does this mean for shareholders though? The clues lie in Figure 8, where we see three major talking points:
- EHC routinely spins ~$600—$700mm in cash flow to its shareholders each period on a TTM basis [defined as post-tax earnings less investments made, less additional reinvestment for growth]. Part of this has stemmed from asset disposals, the rest from operations.
- The high ROICs are made up from capital intensity of 0.9x invested capital turnover and a post-tax margin of ~16%. Going forward, I am looking to capital intensity of ~0.9x and post-tax margins of ~18%, adding another 2 points of profitability to the business.
- You can see the firm compounding its intrinsic value at ~1.5–2%, ahead of historical rates of ~0.5–1%.
- I'd call for economic profits of ~3–5% over the coming years, in-line with findings outlined earlier with the company's growth plans.
Figure 8.
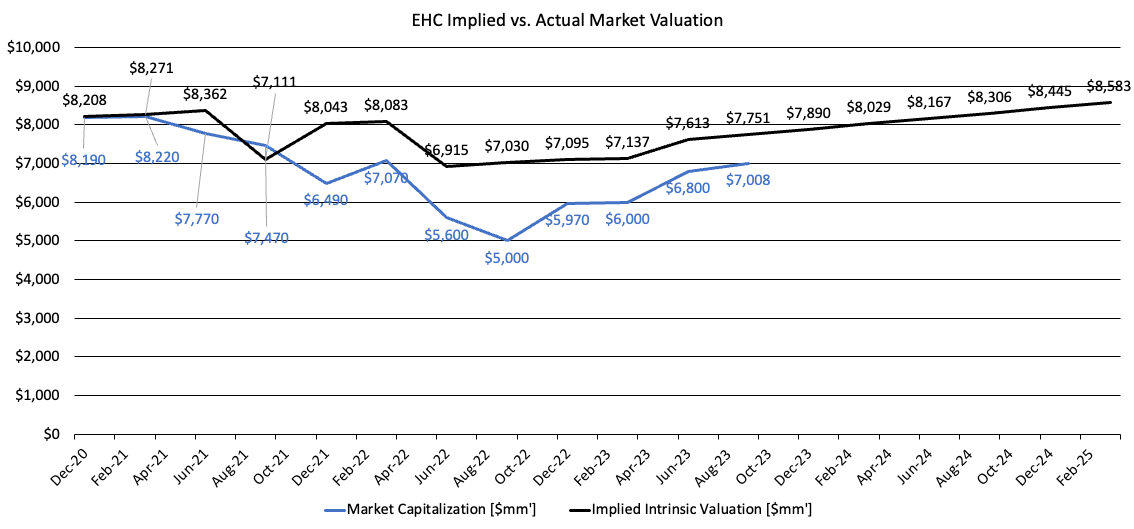
Where I see this adding the most value is in the company's intrinsic value moving forward. I've plotted my assumptions against EHC's quarterly market cap ranges below [Figure 9]. On my calculus, I've got EHC undervalued at ~$750mm in market value at the time of writing. Moving forward, my assumptions call for intrinsic value growth to $7.9Bn by FY'23 yearend, otherwise ~13% upside potential, and $8.58Bn by FY'25, 21% value gap, thus supporting a buy rating.
Over the coming 3 years, my assumptions also have the company producing $2.66Bn in owner earnings, or $26.62/share. The return of 21% gets me to $4.76 for every $1 at risk (1/0.21 = 4.76 =>1) suggesting there's good value on the table. Moreover, if the opportunity cost (hurdle rate) is 12%, we'd be getting tremendous value on these growth assumptions. Hence, I am eyeing the next price objective to $85.80.
Consensus forward P/E of 21x gets you to $78.5/share, using FY'24 consensus EPS data (21x3.75 = 78.5). Hence, I am above Wall Street's estimates of value here, at 25x (85.5/3.75 = 25x).
Figure 9.
(4). Technicals equally supportive
To finish the case, there are clear supportive technical signals adding bullish weight to the thesis. Looking at trend indicators, the stock is positioned well above the cloud support on both daily and weekly time frames. Both look out to the coming weeks and months, respectively. This tells me that the prevailing market trend for EHC is bullish, providing further evidence that today's market price is an attractive entry point.
Figure 9.
Figure 10.
Conclusion
This deep dive uncovers many of the robust economic characteristics that EHC's business presents us with. I believe EHC is an investment grade company based on these. In particular, its de novo strategy is clear cut and offers a simple calculus to extrapolate value. I personally favour these businesses as projecting future cash flows and returns on capital is more visible in my view.
Further to this, EHC is creating economic value for its shareholders by successfully recycling profits back into its growth operations to fund its expansion plans. Key to this is the returns it is seeing back on this capital deployed are above the market return on capital, a hurdle rate of 12% used here.
The economic earnings resultant from this tells me EHC can compound its intrinsic value to ~$85.50 per share into the coming future, and it is worth that much today in my eyes, considering a 2-year investment horizon. Critically, if we were to extend this out further, my opinion is EHC would likely be worth more on my assumptions. However, given the current macro-climate, I've been keeping my investment projections tighter to avoid the forecasting risk. Net-net, reiterate buy.
For further details see:
Encompass Health: Incremental CapEx Adds Tremendous Torque To Flywheel