EOS - EOS: A Worthy Candidate For Your Income Portfolio
2024-01-07 09:00:00 ET
Summary
- Eaton Vance Enhanced Equity Income Fund II is a closed-end fund that primarily invests in common stocks of high-growth companies, offering high income and reasonable growth potential.
- For nearly 19 years of its existence, it has offered nearly 9% of annualized total returns, managed a sensible distribution policy, and is currently paying 7.51% in distribution income.
- We believe it deserves a place in your income portfolio; we would rate the fund as a 'hold' for existing owners and a 'buy' for new investors. However, it may be better to dollar cost average the buys instead of lumpsum.
Introduction:
Eaton Vance Enhanced Equity Income Fund II ( EOS ) is a closed-end fund incepted in January 2005. The fund invests mostly in the common stocks of high-growth companies.
As per the fund's literature , " Its primary investment objective is to provide current income, with a secondary objective of capital appreciation. The Fund invests in a portfolio of primarily large- and midcap securities that the investment adviser believes have above-average growth and financial strength and writes call options on individual securities to generate current earnings from the option premium."
EOS is heavily concentrated in the technology sector, weighing over 43%. The fund writes covered calls (options) on the part of the portfolio to generate income.
Chart-1:
Author
Other salient features of this fund are as follows:
- Focused on high-growth companies, concentrated in technology stocks, but decent allocations to healthcare, financials, communications, and consumer sectors.
- The fund has distributed nearly $25 a share in distributions since its inception in 2005 while maintaining the NAV to a large extent. At the end of 2023, the NAV stood at $19.77, slightly higher than the inception NAV of $19.
- The fund uses zero leverage.
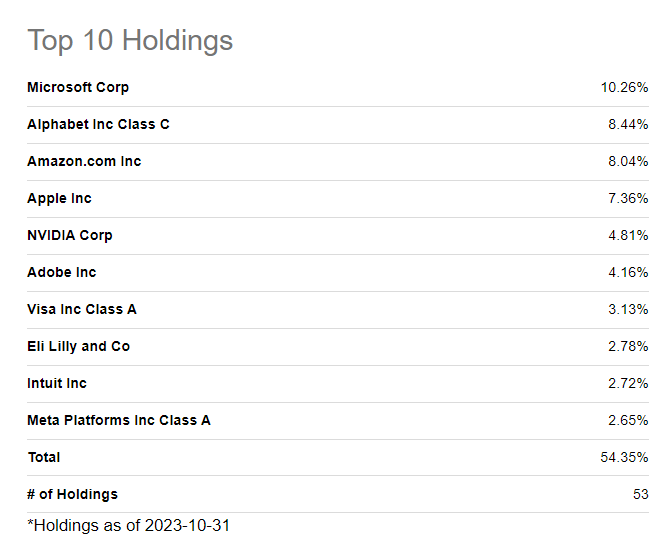
- Concentrated but still diverse exposure: As of Oct. 31, 2023, the fund was invested in 53 securities; however, the top 10 holdings constituted nearly 54% of the assets.
- As of Jan. 02, 2024, the fund had roughly $1.02 billion worth of assets under its management.
- The fund is an actively managed fund and has an expense ratio of 1.09%, which includes the advisor fee of 0.99%. There is no leverage, and as such, there is no interest expense.
- As of Jan. 02, 2024, its distribution yield on the market price was 7.51% and 7.12% on the NAV.
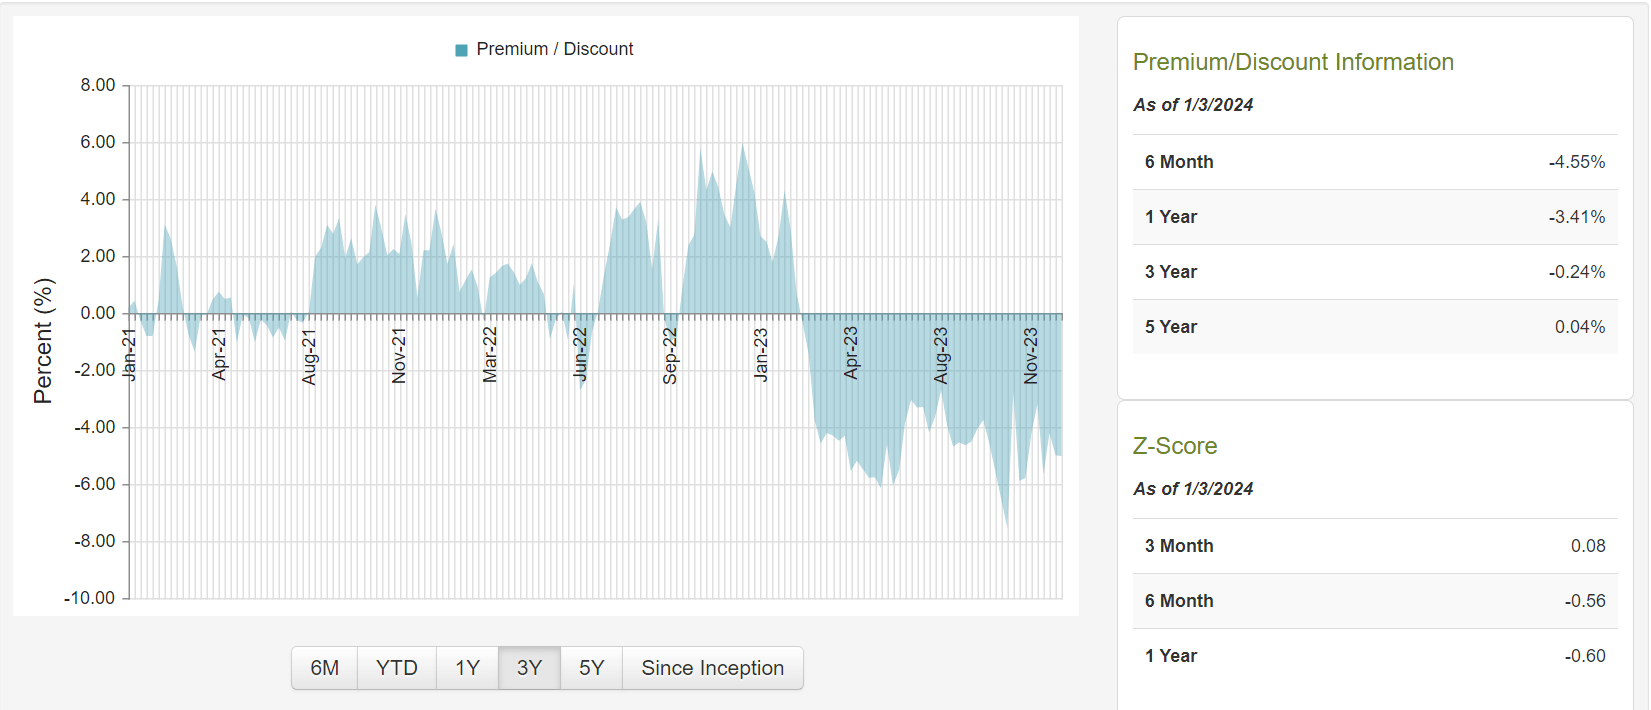
- As of Jan. 02, 2024, EOS's market price offered a discount of -5.20% to its NAV., compared to the 6-month average discount/premium of -4.55% and the 3-year average of -0.24%.
Is the fund a better investment than the benchmark index funds?
So, what is the proper benchmark for this fund? Since it deploys a mix of investment in high-growth stocks and also a covered-call strategy, it uses two benchmarks.
- Russell 1000 Growth Index
- Cboe S&P 500 BuyWrite Index
Since EOS writes covered calls on roughly 50% of its portfolio; ideally, a benchmark should be 50% Russell-1000 Growth Index and 50% Cboe S&P 500 BuyWrite Index.
Let's compare the performance of the EOS fund with a hypothetical fund that is composed of two ETFs (IWF and PBP), representing the Russell-1000 GRTH Index and S&P 500 BuyWrite index in equal proportions (50% each). In the table below, we can see that EOS did pretty well covering most time-frames.
Table-1:
| Performance (Total) |
| 1-YR |
| 3-YR |
| 5-YR |
| 10-YR |
| Since Jan. 2008 |
| EOS |
| 35.25% |
| 5.29% |
| 13.91% |
| 11.08% |
| 8.85% |
| A Mix of Two benchmarks (50% each, IWF, PBP) |
| 27.09% |
| 7.70% |
| 12.97% |
| 10.02% |
| 8.09% |
Who should invest in EOS over a High-Growth Index fund?
You should prefer EOS over a high-growth index fund like the Russell-1000 Growth Index fund if:
- Income (from investment) is very important to you and is either needed right now or will be needed in the next few years.
- Do not like the idea of selling shares (of an investment) to raise income, as it causes too much uncertainty and emotional stress.
- If income is more important to you than the growth of capital, then this fund deserves a place in your income portfolio.
Financial Outlook:
Let's look at the Fund's Financial health and performance. Unfortunately, the most recent annual report that the fund has released is for the period from Jan. 2022 to Dec. 31, 2022. However, we have the semi-annual report for the period ending June 30, 2023. The annual report for the year 2023 won't be available for some time.
Net Investment Income:
The net investment income (or NII in short) is the net income that a fund earns from its investment in the form of dividends, distributions, interests, and any other generated income (for example, buy-write options) minus all of the fund's expenses, including management fees, operating expenses, commissions, and interest on leverage, if any. For equity-based funds, especially in high-growth sectors like technology, the NII is not very relevant compared to fixed-income funds.
Here is what it looks like in terms of NII, Distributions, and Net Assets at the beginning and end of the statement period.
(all amounts are in US $ (except Shares Outstanding) for the 6-month period ending Jun. 30, 2023, and the 12-month prior period ending Dec. 31, 2022; negative amounts are shown inside parentheses).
Table-2:
| Item Description |
| $ Amount (for the 6-month period ending Jun. 30, 2023 |
| $ Amount For the 12-month period ending Dec. 31, 2022 |
| Total Investment Income |
| $3,980,049 |
| $9,201,155 |
| Total Expenses |
| $4,824,669 |
| $10,244,338 |
| Net Investment Income / (loss) |
| $(844,620) |
| $(1,043,183) |
| Realized Gain/loss |
| $56,398,444 |
| $55,804,003 |
| Un-Realized Gain/Loss |
| $129,969,535 |
| $(382,397,093) |
| Net increase/decrease in net assets from Operations |
| $185,523,359 |
| $(327,636,273) |
| Distribution to Shareholders |
| $ (36,147,657) |
| $(54,766,262) |
| Other factors causing increase/decrease (inc. stock issuance/sold, div reinvested) |
| $3,817,923 |
| $18,459,713 |
| Net increase/decrease in net assets |
| $153,193,625 |
| $(391,881,943) |
| Net Assets - beginning of the period |
| $820,142,417 |
| $1,212,024,360 |
| Net Assets - end of the period |
| $973,336,042 |
| $ 820,142,417 |
| Shares Outstanding (no of shares) |
| 52,307,415 shares |
| 52,075,876 shares |
| Per Share Data - Net Asset Value per share, beginning of period |
| $ 15.750 |
| $23.720 |
| Per Share Data - Net Asset Value per share, end of the period |
| $ 18.610 |
| $ 15.750 |
The NAV of the fund stood at $19.77 at the end of year 2023, as of Dec. 31, 2023.
The year 2022 was universally bad for stocks, especially technology and other growth stocks. EOS suffered a massive decline in NAV in 2022 from the highs of 2021. The rising interest rate regime over the last two years hit hard the high-growth securities. However, the NAV for the fund has recovered roughly by 26% during the year 2023. After including distributions on an NAV basis, the fund has returned over 35% in 2023. It still has some catch-up to do with previous highs.
Distributions:
EOS provides a monthly distribution of $0.1152 per share, which comes out to be a yield of 7.51% at current prices (as of 01/02/2024). This fund follows a managed distribution plan [MDP] and adjusts the distribution upwards or downwards based on what the fund is expected to earn (including capital gains). It increased the distribution amount back in 2021 by 38% but then reduced it in 2022 by 16%. In a way, adjusting the distribution as per the expected earnings (both capital gain and income) helps the fund maintain its NAV. The fact that the fund has managed the NAV in positive territory over the course of 19 years speaks about how the fund has been managed. All this while, it has paid distributions of $24.85 a share until Dec. 2023.
Overall, management has done a reasonable job for income investors by managing the distribution policy and making the distributions sustainable.
So, is the distribution covered?
The answer in one word is NO. This is basically an equity fund concentrated in the technology sector and high-growth stocks. Many of these holdings don't even pay dividends, or they pay very little. The fund employs the covered-call strategy on a maximum of 50% of the portfolio to generate income. But most of this income is consumed by the fund's expenses. So, in a nutshell, it generates negative net income. Basically, the fund has to rely on the capital gains to be able to pay the distributions. In a good year, it is not an issue as the fund can comfortably generate enough capital gains to cover the payout, but in a bad year like 2022, it does not cover the distributions, and it has to rely on ROC (return of capital). If the downturn persists for a long time, it can become a problem and hurt the NAV permanently. However, this fund has gone through and survived several crises since its inception, for example, the financial crisis, the once-in-a-century pandemic, and, most recently, the 2022 tech correction.
Discount/Premium:
The fund is currently trading at a decent discount of -5.20% (to its NAV). But if you look at its 3-year history, it has traded at a very small discount of 0.24% (average). However, the fund's NAV has gained quite a bit in 2023, to the extent of 26%, in addition to the distributions. The gains have been on the back of the recovery in the technology sector as well as the broader market. So, irrespective of the discount, it is not as cheap as it was at the beginning of last year.
Chart-2: Premium/Discount information
Fund's Holdings:
The fund is diversified into many sectors like technology, Financials, Healthcare, Consumer Staples and Discretionary, Industrials, etc. However, technology takes the major share, roughly 44%. It has 53 individual stock holdings. Some of its largest holdings are Microsoft ( MSFT ), Alphabet ( GOOG ), Amazon ( AMZN ), Apple ( AAPL ), NVIDIA Corp ( NVDA ), Adobe ( ADBE ), Visa ( V ), Eli Lilly ( LLY ), Intuit ( INTU ), and Meta ( META ). The top 10 holdings constitute 54% of the total assets.
Table-3: Top 10 Holdings
Performance:
Here is a comparative look at the fund's performance with the S&P 500 since 2005.
Table-4:
| EOS (Mkt Prc) |
| EOS (NAV) |
| S&P 500 |
| Since Inception (Feb. 2005 - Dec. 31, 2023) |
| 8.66% |
| 8.98% |
| 9.73% |
| 10-YR performance |
| 11.73% |
| 11.08% |
| 11.93% |
| 5-YR performance |
| 13.08% |
| 13.91% |
| 15.61% |
If someone is purely looking for growth and high returns, this fund is NOT for them. As shown above, simply investing in the S&P 500 could have returned 0.75% (3 quarters of a percentage point) higher on an annualized basis. However, the S&P 500 pays less than a 1.5% dividend yield and had at least 20% higher drawdowns than EOS during the last 19 years. So, the S&P 500 does not suit income investors very well as you have to sell shares to raise the income, and that's where it gets very tricky. It is very appealing for income investors to get a reliable and sustainable income without worrying about when to sell and how much to sell. So, is losing 0.75% on growth annually worthwhile to be able to get sustainable income? It is a subjective question, and to many, the answer would be yes.
The long-term performance of EOS has been reasonably good as well but slightly inferior to the S&P 500. Let's see how it compares over the last 19 years with the S&P 500.
Table 5: (Data as of Dec. 31, 2023)
| From Feb. 2005 to Dec. 31, 2023 |
| EOS (on NAV) |
| SPY (S&P 500 ETF) |
| Annualized Return [CAGR] |
| 8.95% |
| 9.73% |
| Max. Drawdown |
| -40.4% |
| -51% |
| Std. Deviation |
| 14.37% |
| 15.22% |
| Fees |
| 1.09% |
| 0.095% |
| Leverage |
| 0% |
| 0% |
| No of holdings |
| 53 |
| 504 |
| Market Co-relation |
| 0.96 |
| 1.0 |
| Assets (Current) |
| $1.02 Billion |
| $487 Billion |
| Dividend/ Distribution Yield % (Current) |
| 7.51% |
| 1.4% |
| Allocation (Current) |
| 44%-Technology, 12%- Communication, 9% healthcare, 21% Consumers, 14%-others. |
| Largest 500 US companies |
Note: Some of the data (e.g., number of holdings and leverage) may not be current as of Dec. 31, 2023.
Risk Factors:
Investors need to be aware of certain risk factors that are associated with this fund and CEFs in general. The near to mid-term future performance of EOS will be somewhat tied to the movement of interest rates. However, as of now, all indicators are pointing to interest rates going down in 2024, so we can expect some tailwinds for most income investments, as well as technology companies. That should translate to much better performance for EOS as well. However, this fund carries no leverage, and there is no direct impact from the interest rates, but there is an indirect correlation to how its holdings perform.
Risk factors could be summarized as follows:
- The macroeconomic conditions and the movement of interest rates in 2024. If high-interest rates somehow stay higher than expected, then that will be a headwind for this fund.
- The geo-political situation, in general.
- The occurrence of a recession in 2024, however, is likely to be a shallow one by most estimates now.
- We have observed above that almost all of the distributions (for this fund) come from capital gains, as covered-call income is consumed by expenses. If the broader market were to enter into a down cycle, there would be no capital gains to pay for distributions, and that may result in forcing the fund to pay the distributions by means of destructive ROC (return of capital).
Concluding Thoughts:
If you are a retiree or less than five years away from retirement, and you need your capital to earn you at least 5-6% income yield, then this fund deserves a place in your income portfolio. However, your income portfolio should in itself be diversified into 10-12 funds.
Many times, we hear the argument that why can't we just hold an index fund like the S&P 500 and sell shares to generate income? Especially when, for nearly 19 years of its existence, EOS has lagged the S&P 500 (though just by 0.75 percentage points). Sure, that is an option for folks who can do that effectively without emotions. But for most investors, we have seen that it is very difficult to emotionally deal with selling their shares to generate income. Most people don't want to deal with issues like when to sell, how much to sell, and other what-if scenarios. For income investors, including retirees, EOS should certainly be a worthy candidate, with its reliable (but variable at times) monthly income.
We rate EOS as a 'hold' for the existing owners at this time. However, if you are a new buyer, you should plan to buy it in two or three lots, giving you the benefit of dollar-cost-average. We think that with interest rates declining from here, EOS should do reasonably well in 2024.
For further details see:
EOS: A Worthy Candidate For Your Income Portfolio