FTDS - Federal Reserve Watch: Quantitative Tightening Continues
Summary
- The Federal Reserve continues its quantitative tightening, and it keeps the pliers tight around the monetary facet.
- The Fed's securities portfolio continues to decline.
- The M2 money stock has now been in decline for about ten months.
- These data all seem to point toward a decline in the U.S. economy.
- We are in uncharted territory.
What does quantitative tightening look like?
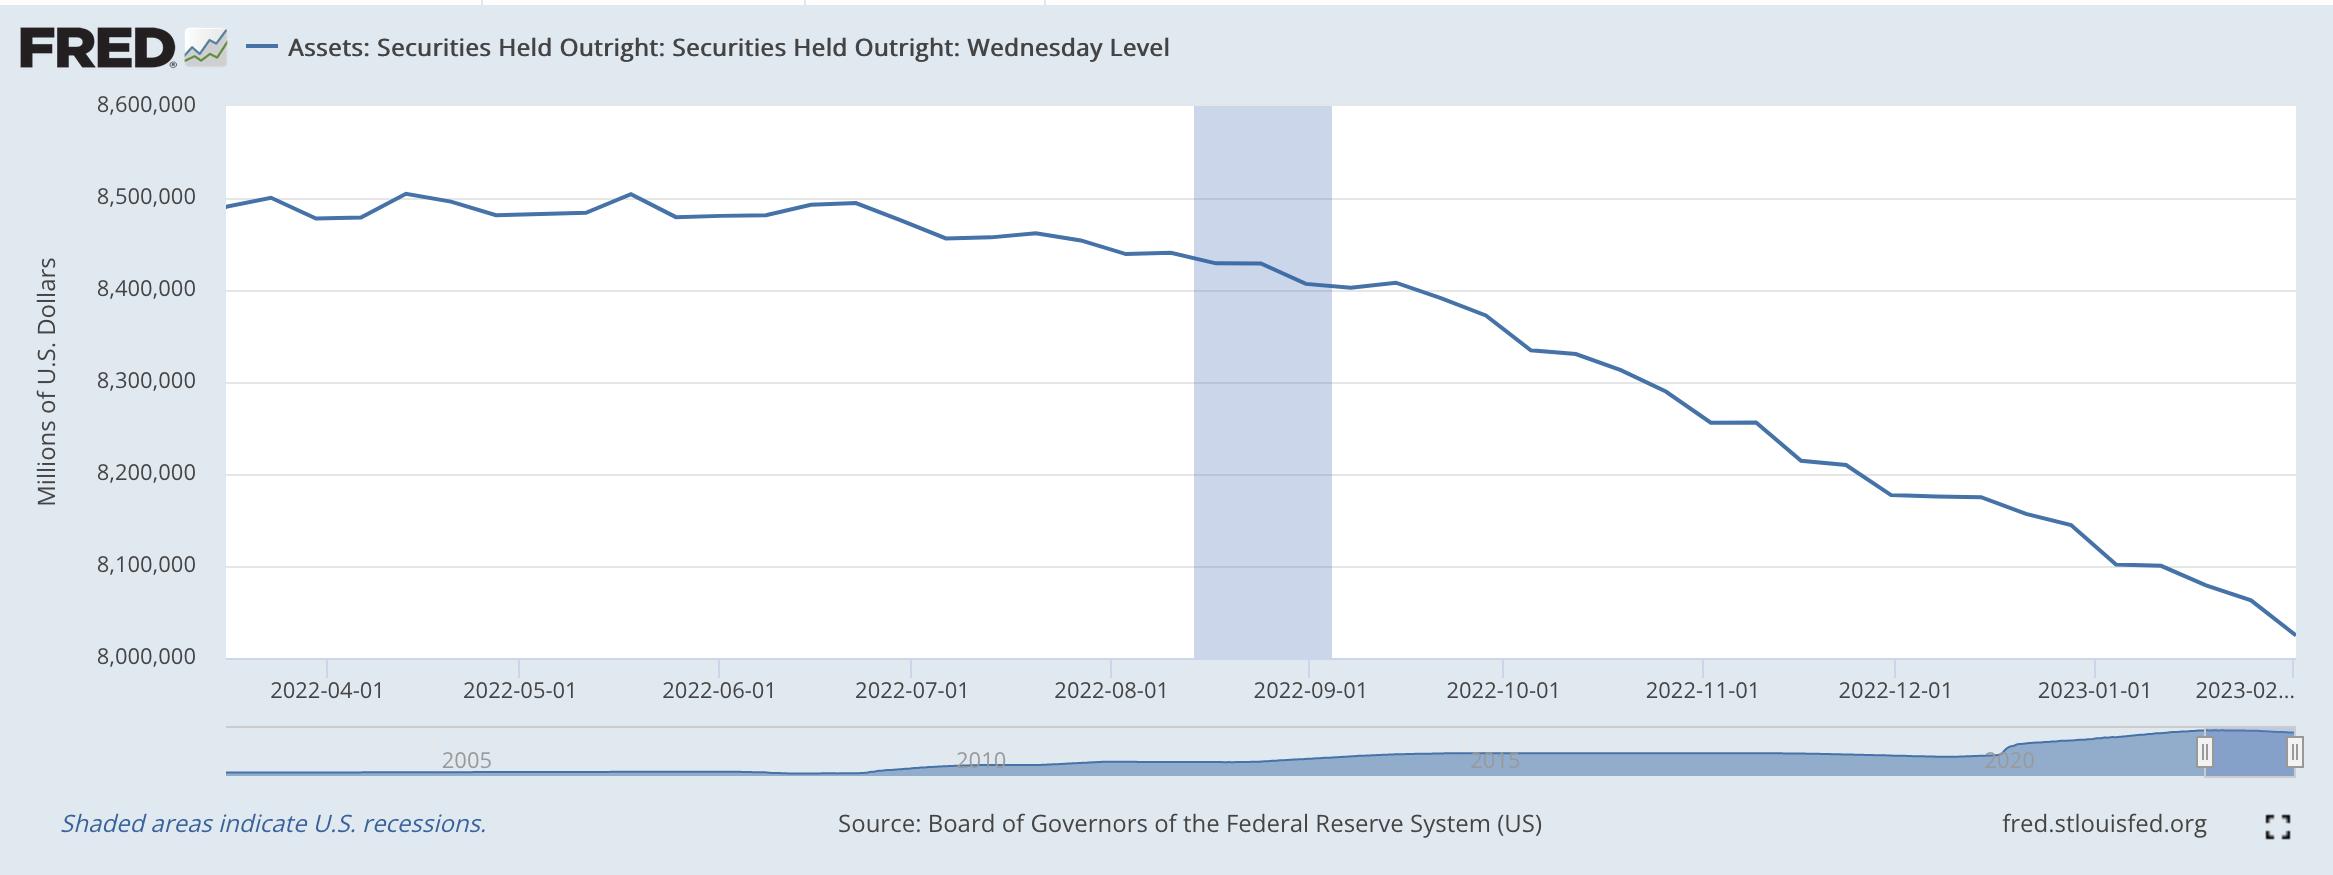
The Federal Reserve has been engaged in what it calls "Quantitative Tightening" since the middle of March in 2022.
In quantitative tightening, the Federal Reserve is continuously reducing the size of its securities portfolio by relatively regular amounts.
Here is what quantitative tightening looks like in the current Federal Reserve operations.
The time span covered in this chart is about 10 1/2 months.
What does quantitative easing look like?
Here is what Jerome Powell and the Fed did from April 1, 2020, until June 1, 2022, for 25 months. At around acquisitions of $120.0 billion per month, the Fed acquired almost $3.0 trillion during this time.
So, quantitative tightening is just the opposite of quantitative easing.
The question now is how long will the Fed's quantitative tightening go on.
The Fed's securities portfolio, on February 1, 2023, totaled just over $8.0 trillion.
The "excess reserves" on the Fed's balance sheet, the line item "Reserve Balances with Federal Reserve Banks" totals just over $3.0 trillion.
Just how far does the Federal Reserve need to "tighten" in order to bring the banking system back into a more stable position, a position when there is not "too much" liquidity in the system?
Isn't that the real question?
Just how long does the Fed need to continue its quantitative tightening in order to reverse itself from the creation of the "asset bubble" the Fed generated in the period January 2020 through June 2021?
This is the battle now going on within the Federal Reserve System and the U.S. banking system.
This is why investors and analysts need to focus on what the Fed is doing to its securities portfolio, to its balance sheet and not just focus on where the Fed is taking the Fed's policy rate of interest, the Federal Funds rate.
The Money Stock
Some other data have appeared on the horizon that causes us to ask some interesting questions.
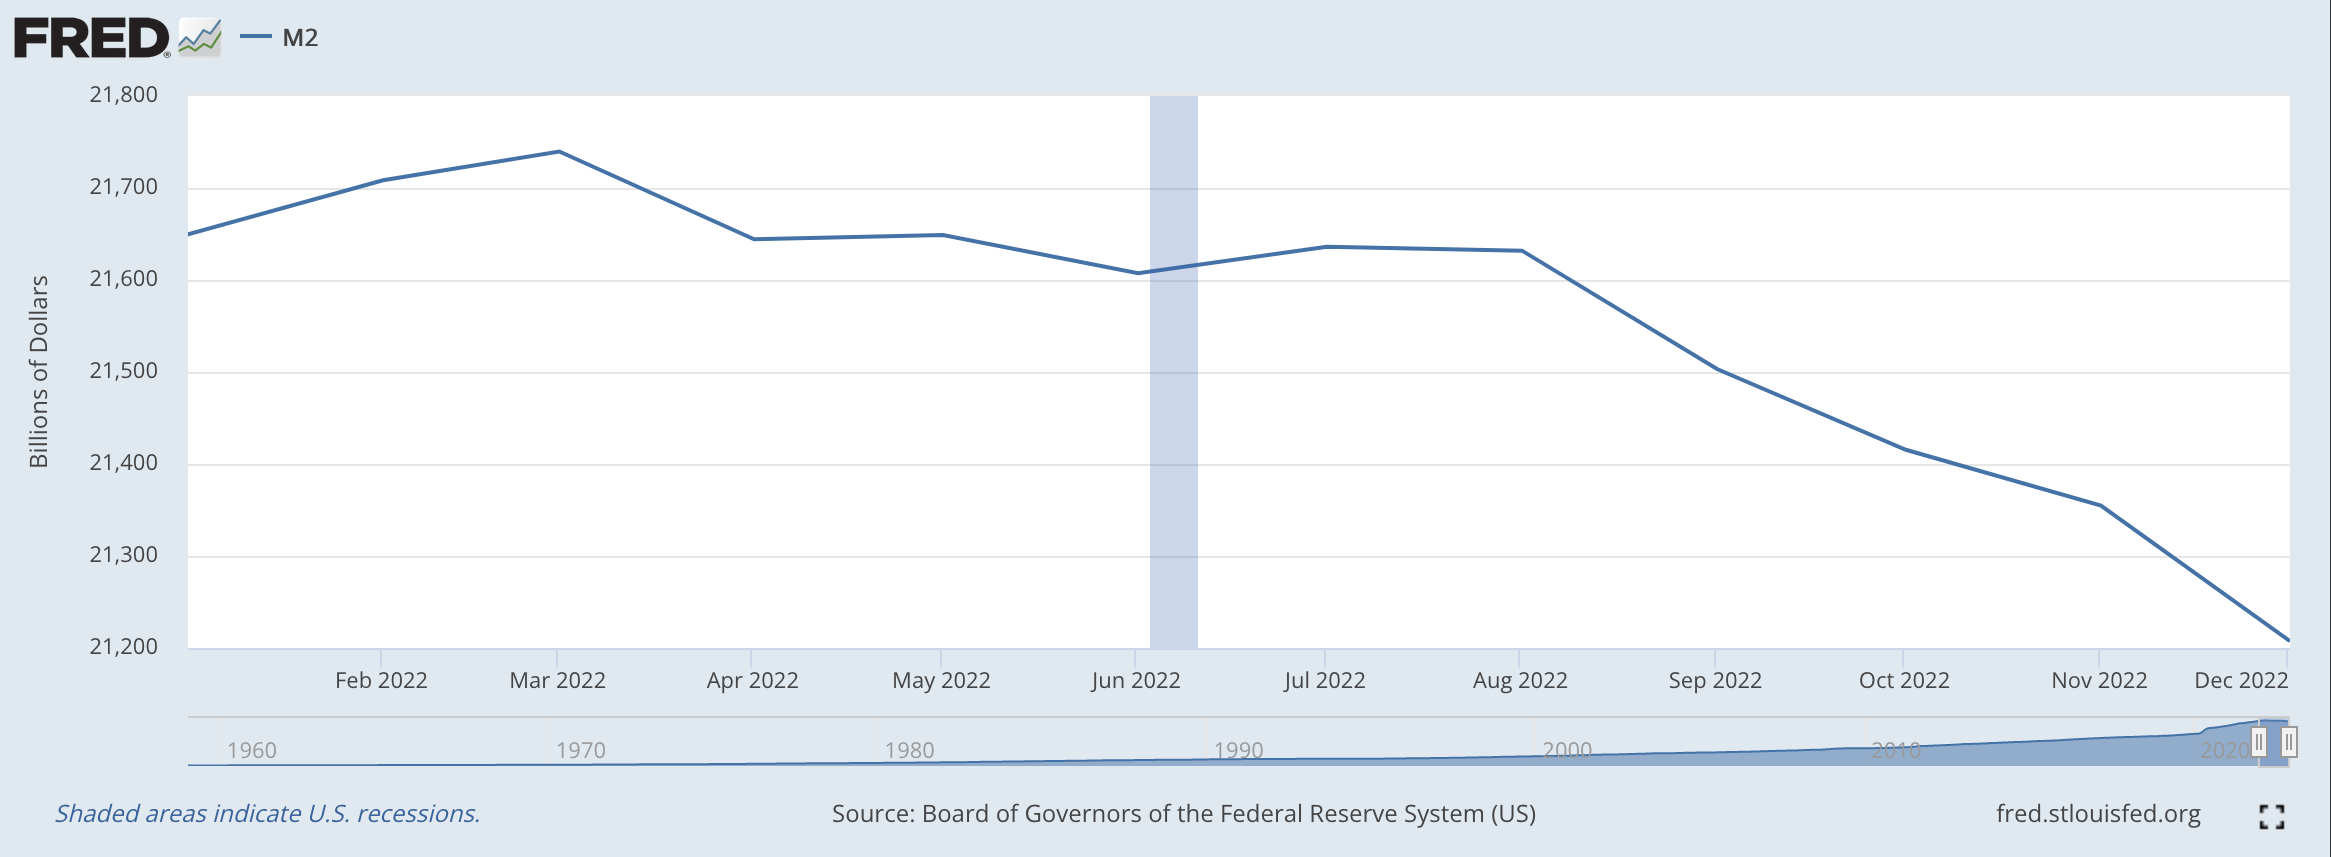
Specifically, I am referring to the M2 money stock measure.
For several months now, the M2 money stock has been in decline.
Take a look.
Since the Federal Reserve began "tightening" up on monetary policy, the M2 money stock has been declining.
That is, the quantitative tightening that the Fed began in March 2022 has resulted in a decline in the M2 money stock.
Historically, the U.S. economy has gone into a recession following a decline in the M2 money stock.
So, we have now seen 10 months in which the M2 money stock has been in decline. In most cases, historically, the U.S. economy has begun to decline within this amount of "lag" between the downturn in the money stock and the downturn in real GDP.
So, it looks as if the Fed's quantitative tightening is having an impact on the economy. And, keep watching.
One note: the M2 money stock had not declined in one month since the ending of the Great Recession in 2009 before the current decline began. Check out the chart.
So, things have changed.
The Federal Reserve has never ever run a monetary policy like this effort of quantitative tightening.
The quantitative tightening has resulted in a decline in the M2 money stock.
Will the economy follow this decline in the M2 money stock?
Conclusion
So, the simple story for this week is that the Federal Reserve continues its policy of quantitative easing.
The banking system has responded, and the M2 money stock is now declining.
The U.S. economy should follow the M2 money stock and go into a decline.
Inflation should slow down.
The questions that are still on the table.
The banking system has excess reserves of $3.0 trillion and the financial system is awash in liquidity. Will this offset the Fed's efforts to tighten up on liquidity? Is the financial system so awash with cash created in the Fed's asset bubble, that it can offset the current Federal Reserve moves?
If the M2 money stock continues to decline and the economy goes into a recession, will the Federal Reserve "pivot" from its tightening policy and not follow through its effort to bring inflation back down to 2.0 percent?
Finally, just how long will the Federal Reserve continue its quantitative tightening if the stock market doesn't collapse or if we avoid some other market disruption?
Fed Chair Jerome Powell carried on quantitative easing for more than two years, the Fed's asset bubble. Could quantitative tightening go on for that long?
Watch the Federal Reserve.
For further details see:
Federal Reserve Watch: Quantitative Tightening Continues