PLXS - Fiduciary Management Q1 2023 Investment Letter
2023-04-12 03:30:00 ET
Summary
- Fiduciary Management, Inc. is an independent money management firm. FMI’s equity investing strategies apply a value discipline, with a focused approach firmly rooted in fundamental research.
- Our two most impacted holdings during this recent crisis were Zions Bancorp. and discount broker Charles Schwab.
- Although there will likely be some profit headwinds that stem from this crisis, we viewed the large declines in these shares as overly punitive, and thus believe the risk/reward for each is increasingly attractive.
- Although there will likely be some profit headwinds that stem from this crisis, we viewed the large declines in these shares as overly punitive, and thus believe the risk/reward for each is increasingly attractive.
INVESTMENT STRATEGY OUTLOOK - MARCH 31, 2023
From this point forward, we are moving to a new format for our letters. At FMI, we have one investment team, one philosophy, and one research process, thus we have decided to transition to a single letter, where we will cover all our investment strategies collectively. We will discuss our performance by fund at the outset of each letter, touch on key domestic and international investment topics, and feature a few existing portfolio holdings at the end. As we have done historically, we will provide perspective on the market, the investment landscape, and our portfolios.
The first quarter of 2023 was one for the history books, highlighted by a global banking crisis and severe financial market volatility. Three banks failed (Silvergate Capital Corp., Silicon Valley Bank, and Signature Bank), while Credit Suisse Group ( CS ) was "rescued" by UBS Group ( UBS ), and a consortium of big U.S. banks have attempted to shore up First Republic Bank ( FRC ). Global interest rates declined dramatically, adding fuel to the growth stock rally that had already been underway since the start the year. Financials came under significant pressure during the quarter, while technology stocks were off to the races. Growth significantly outperformed Value across market capitalizations and geographies, a relative headwind for FMI given our valuation discipline. FMI's quarterly performance commentary is outlined below:
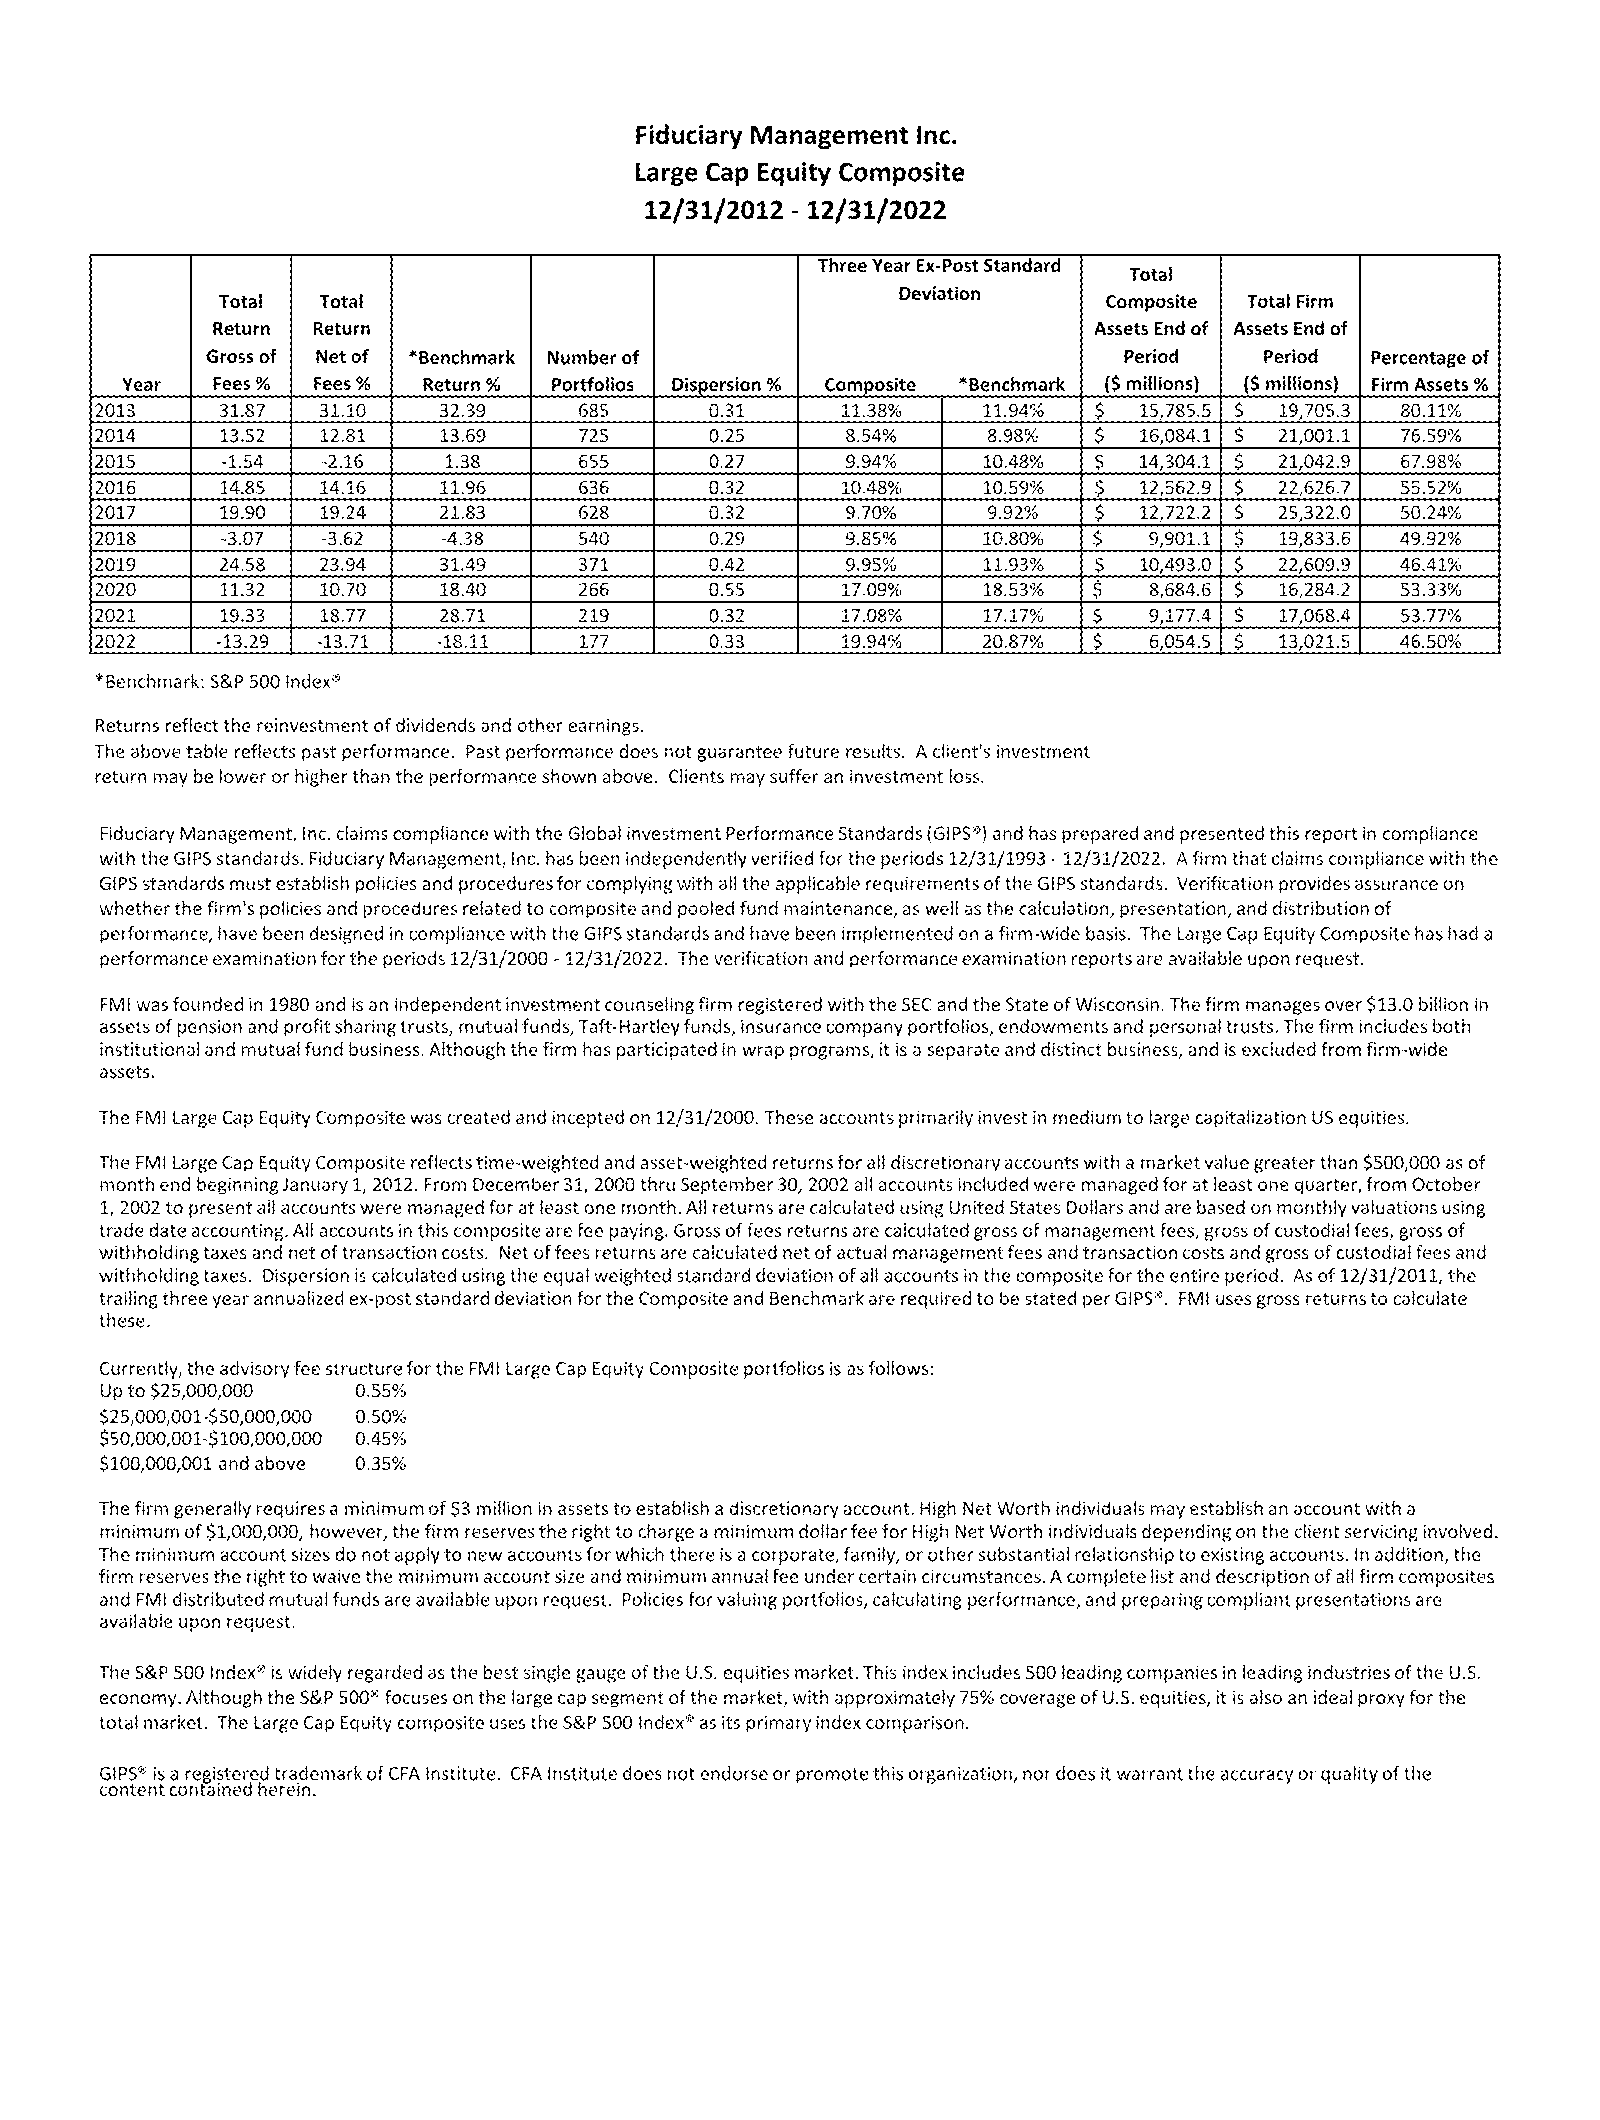
FMI Large Cap Equity
The FMI Large Cap Strategy gained approximately 4.2% (gross) / 4.0% ((net)) in the March quarter, compared to a 7.50% increase in the S&P 500 Index and a 0.93% gain in the iShares Russell 1000 Value ETF1. There was significant performance concentration in the S&P 500 this quarter, as five names contributed approximately 70% of the return. Relative to the S&P 500 Index, sectors that contributed to performance included Health Technology, Consumer Services, and Consumer Non-Durables, while Retail Trade, our underweight in Electronic Technology, and overweight in Finance (despite limited banking exposure) were key detractors in the period. Booking Holdings Inc. ( BKNG ), Sony Group Corp. ( SONY ), and Alphabet Inc.Cl A ( GOOG , GOOGL ) performed strongly, while Charles Schwab Corp. ( SCHW ), Dollar General Corp. ( DG ), and Schlumberger Ltd. ( SLB ) each lagged.
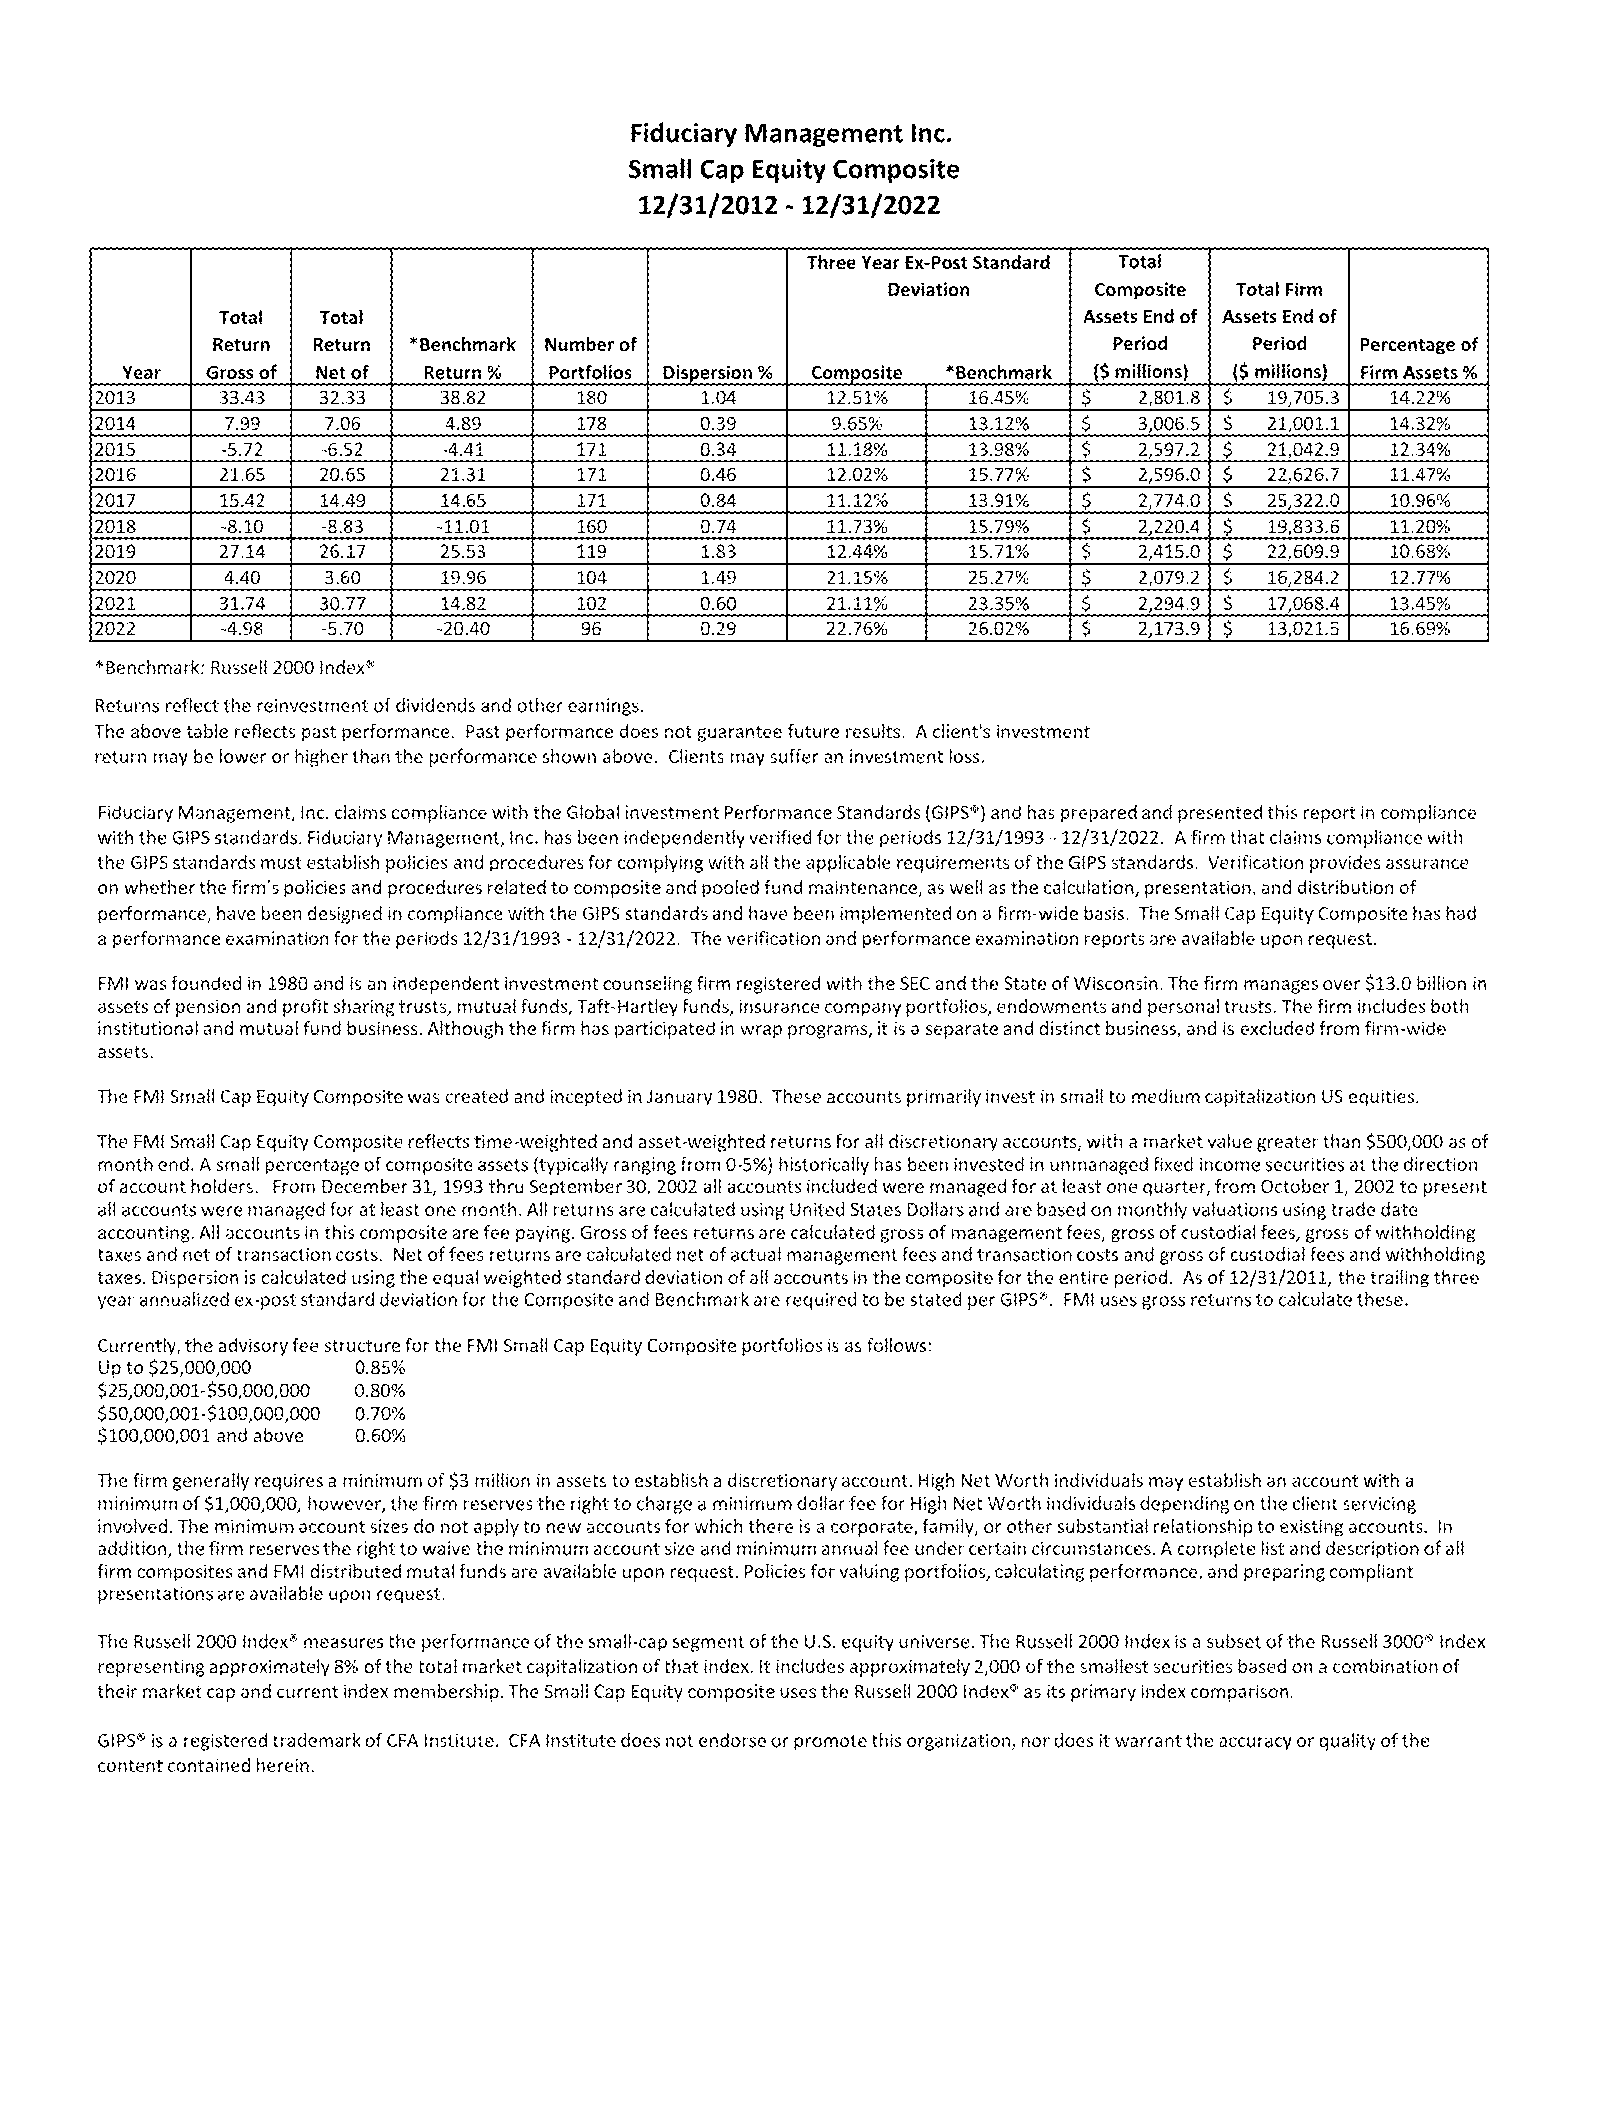
FMI Small Cap Equity
The FMI Small Cap Strategy gained approximately 7.8% (gross) / 7.6% ((net)) in the March quarter, compared to a 2.74% gain in the Russell 2000 Index and a 0.66% decline in the Russell 2000 Value Index. Relative to the Russell 2000, sectors that contributed to performance included Finance, Technology Services, and Distribution Services, while Electronic Technology, a lack of exposure to Transportation, and Consumer Services detracted. Strong stock performance from Insight Enterprises Inc. ( NSIT ), BJ's Wholesale Club Holdings Inc. ( BJ ), and Primerica Inc. ( PRI ) were additive, while Zions Bancorp. N.A. ( ZION ), Plexus Corp. ( PLXS ), and Carlisle Cos. Inc. ( CSL ) weighed. A significant underweight in banking helped the relative comparison. The high-quality nature of the portfolio has really shined through in terms of performance in recent years.
FMI All Cap Equity
The FMI All Cap Strategy gained approximately 5.2% (gross) / 5.1% ((net)) in the March quarter, compared to a 7.07% increase in the iShares Russell 3000 ETF1. There was significant performance concentration in the iShares Russell 3000 this quarter, as five names contributed approximately 60% of the return. Relative to the iShares Russell 3000 ETF, sectors that contributed to performance included Health Technology, Consumer Services, and Consumer Non-Durables, while our underweight in Electronic Technology, and Technology Services coupled with our overweight in Finance (despite limited banking exposure) were key detractors in the period. Booking Holdings Inc., Skechers U.S.A. Cl A ( SKX ), and Sony Group Corp. performed well, while Charles Schwab Corp., Dollar General Corp., and UnitedHealth Group Inc. ( UNH ) each fell short.
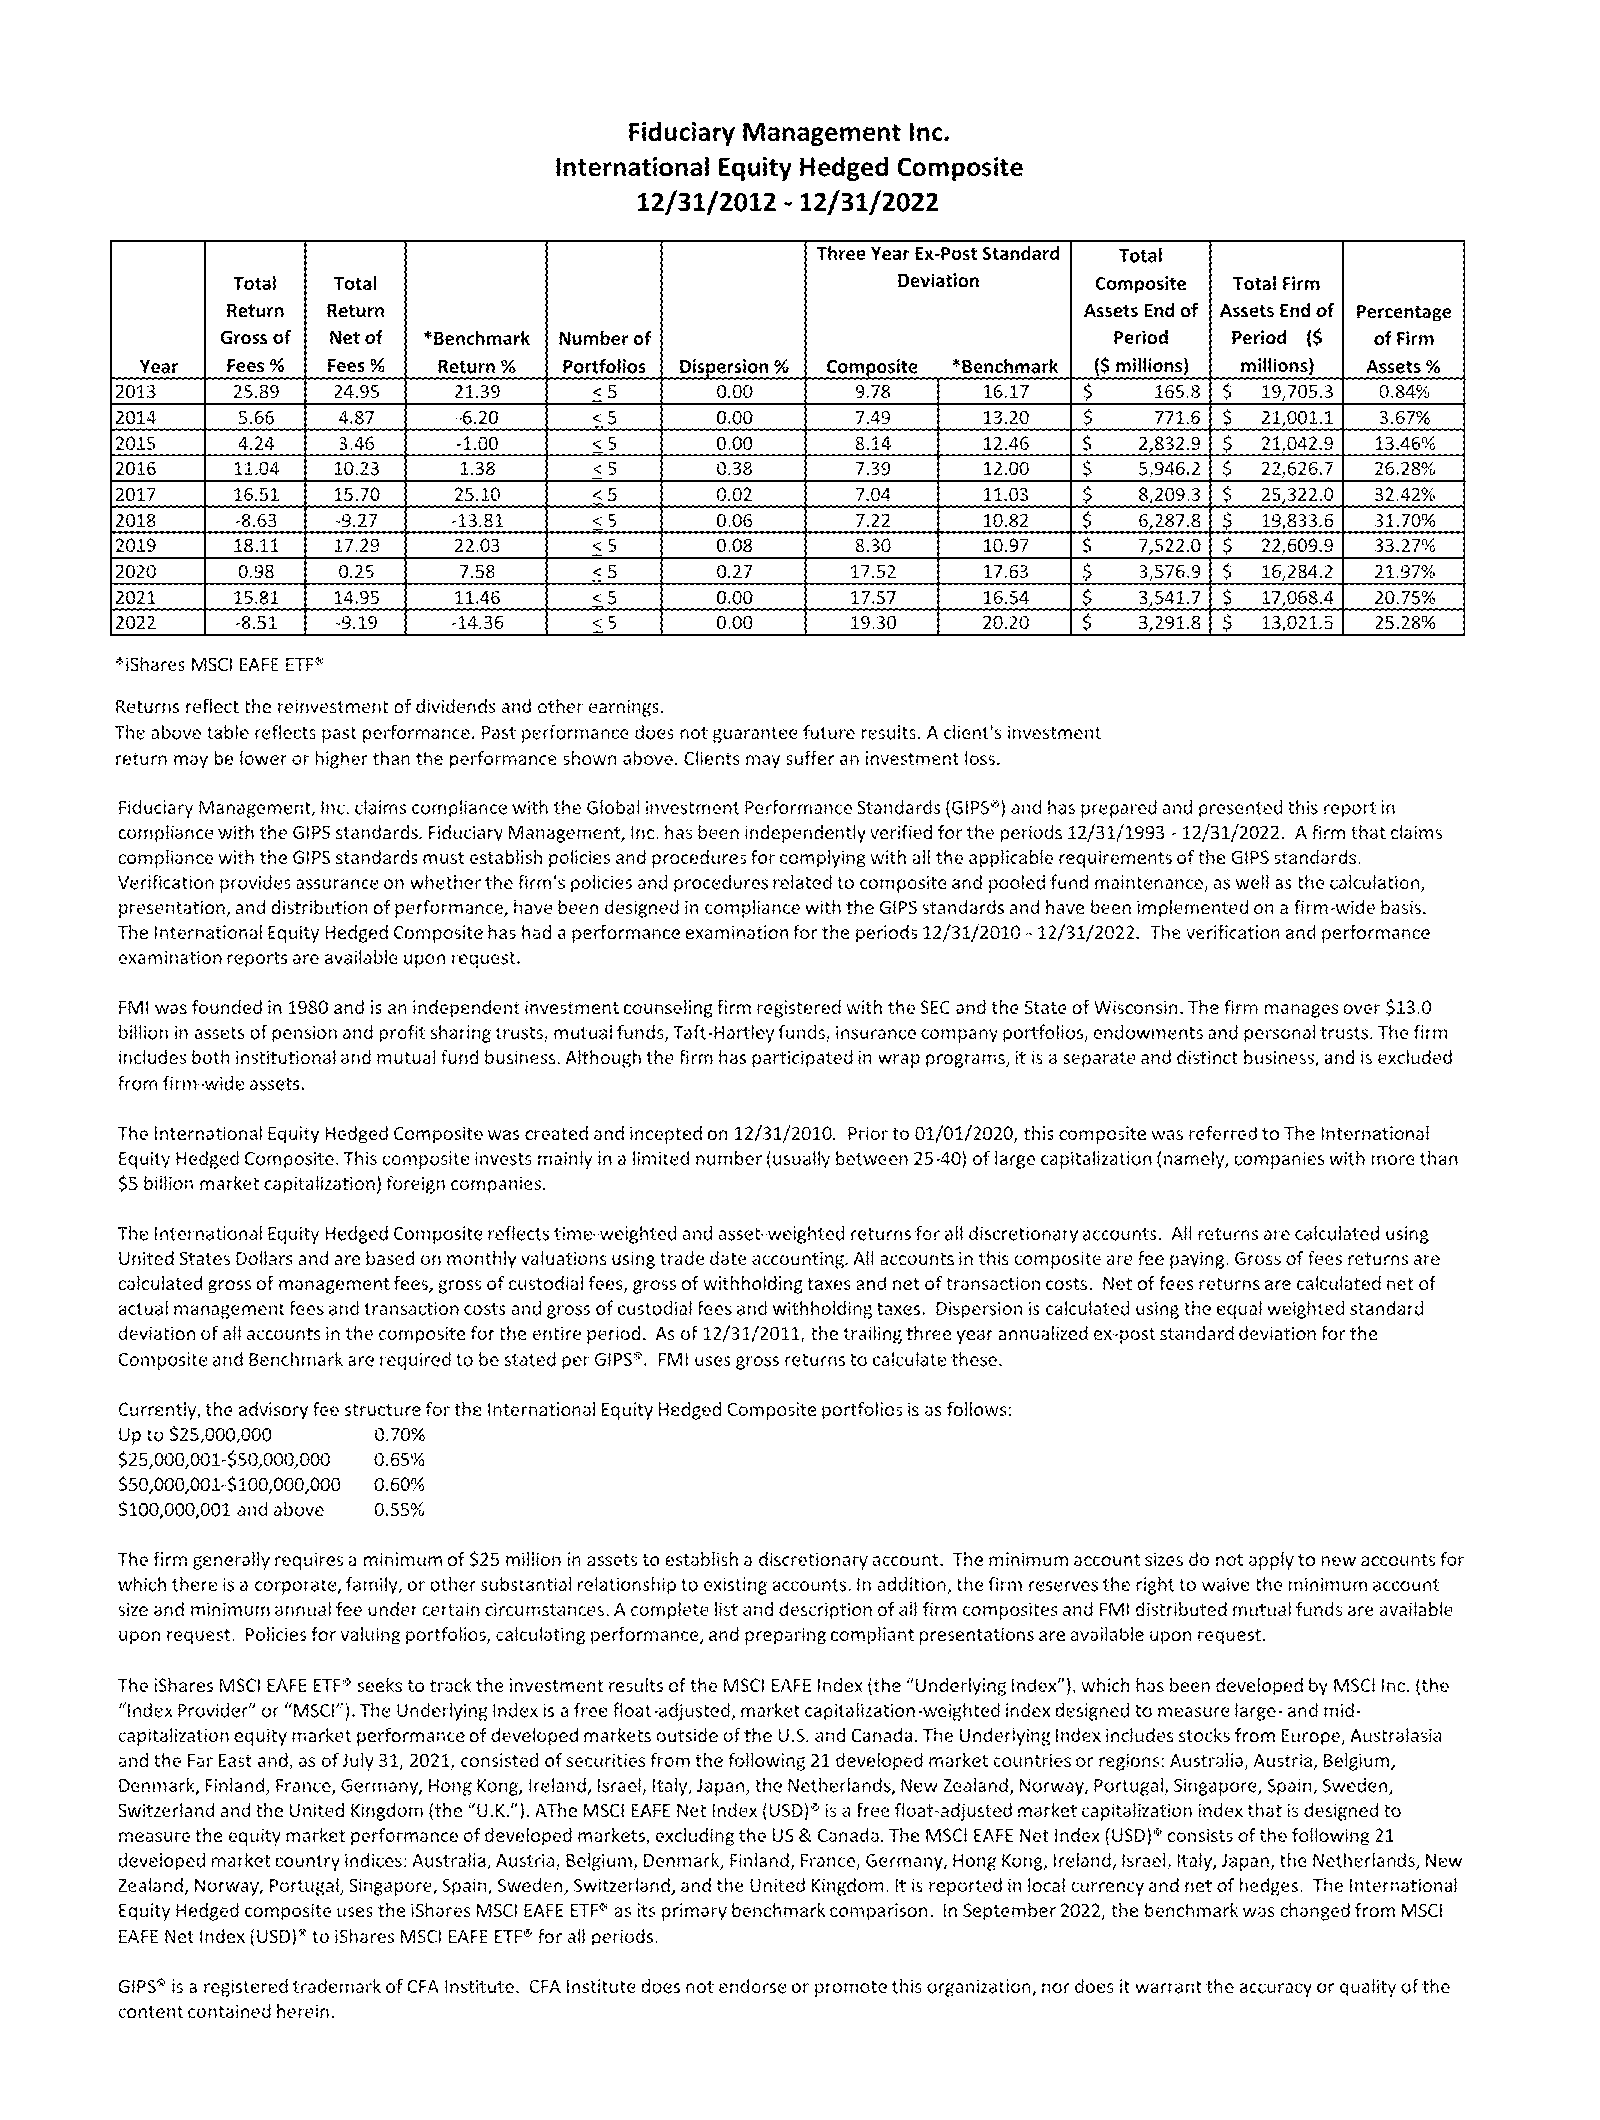
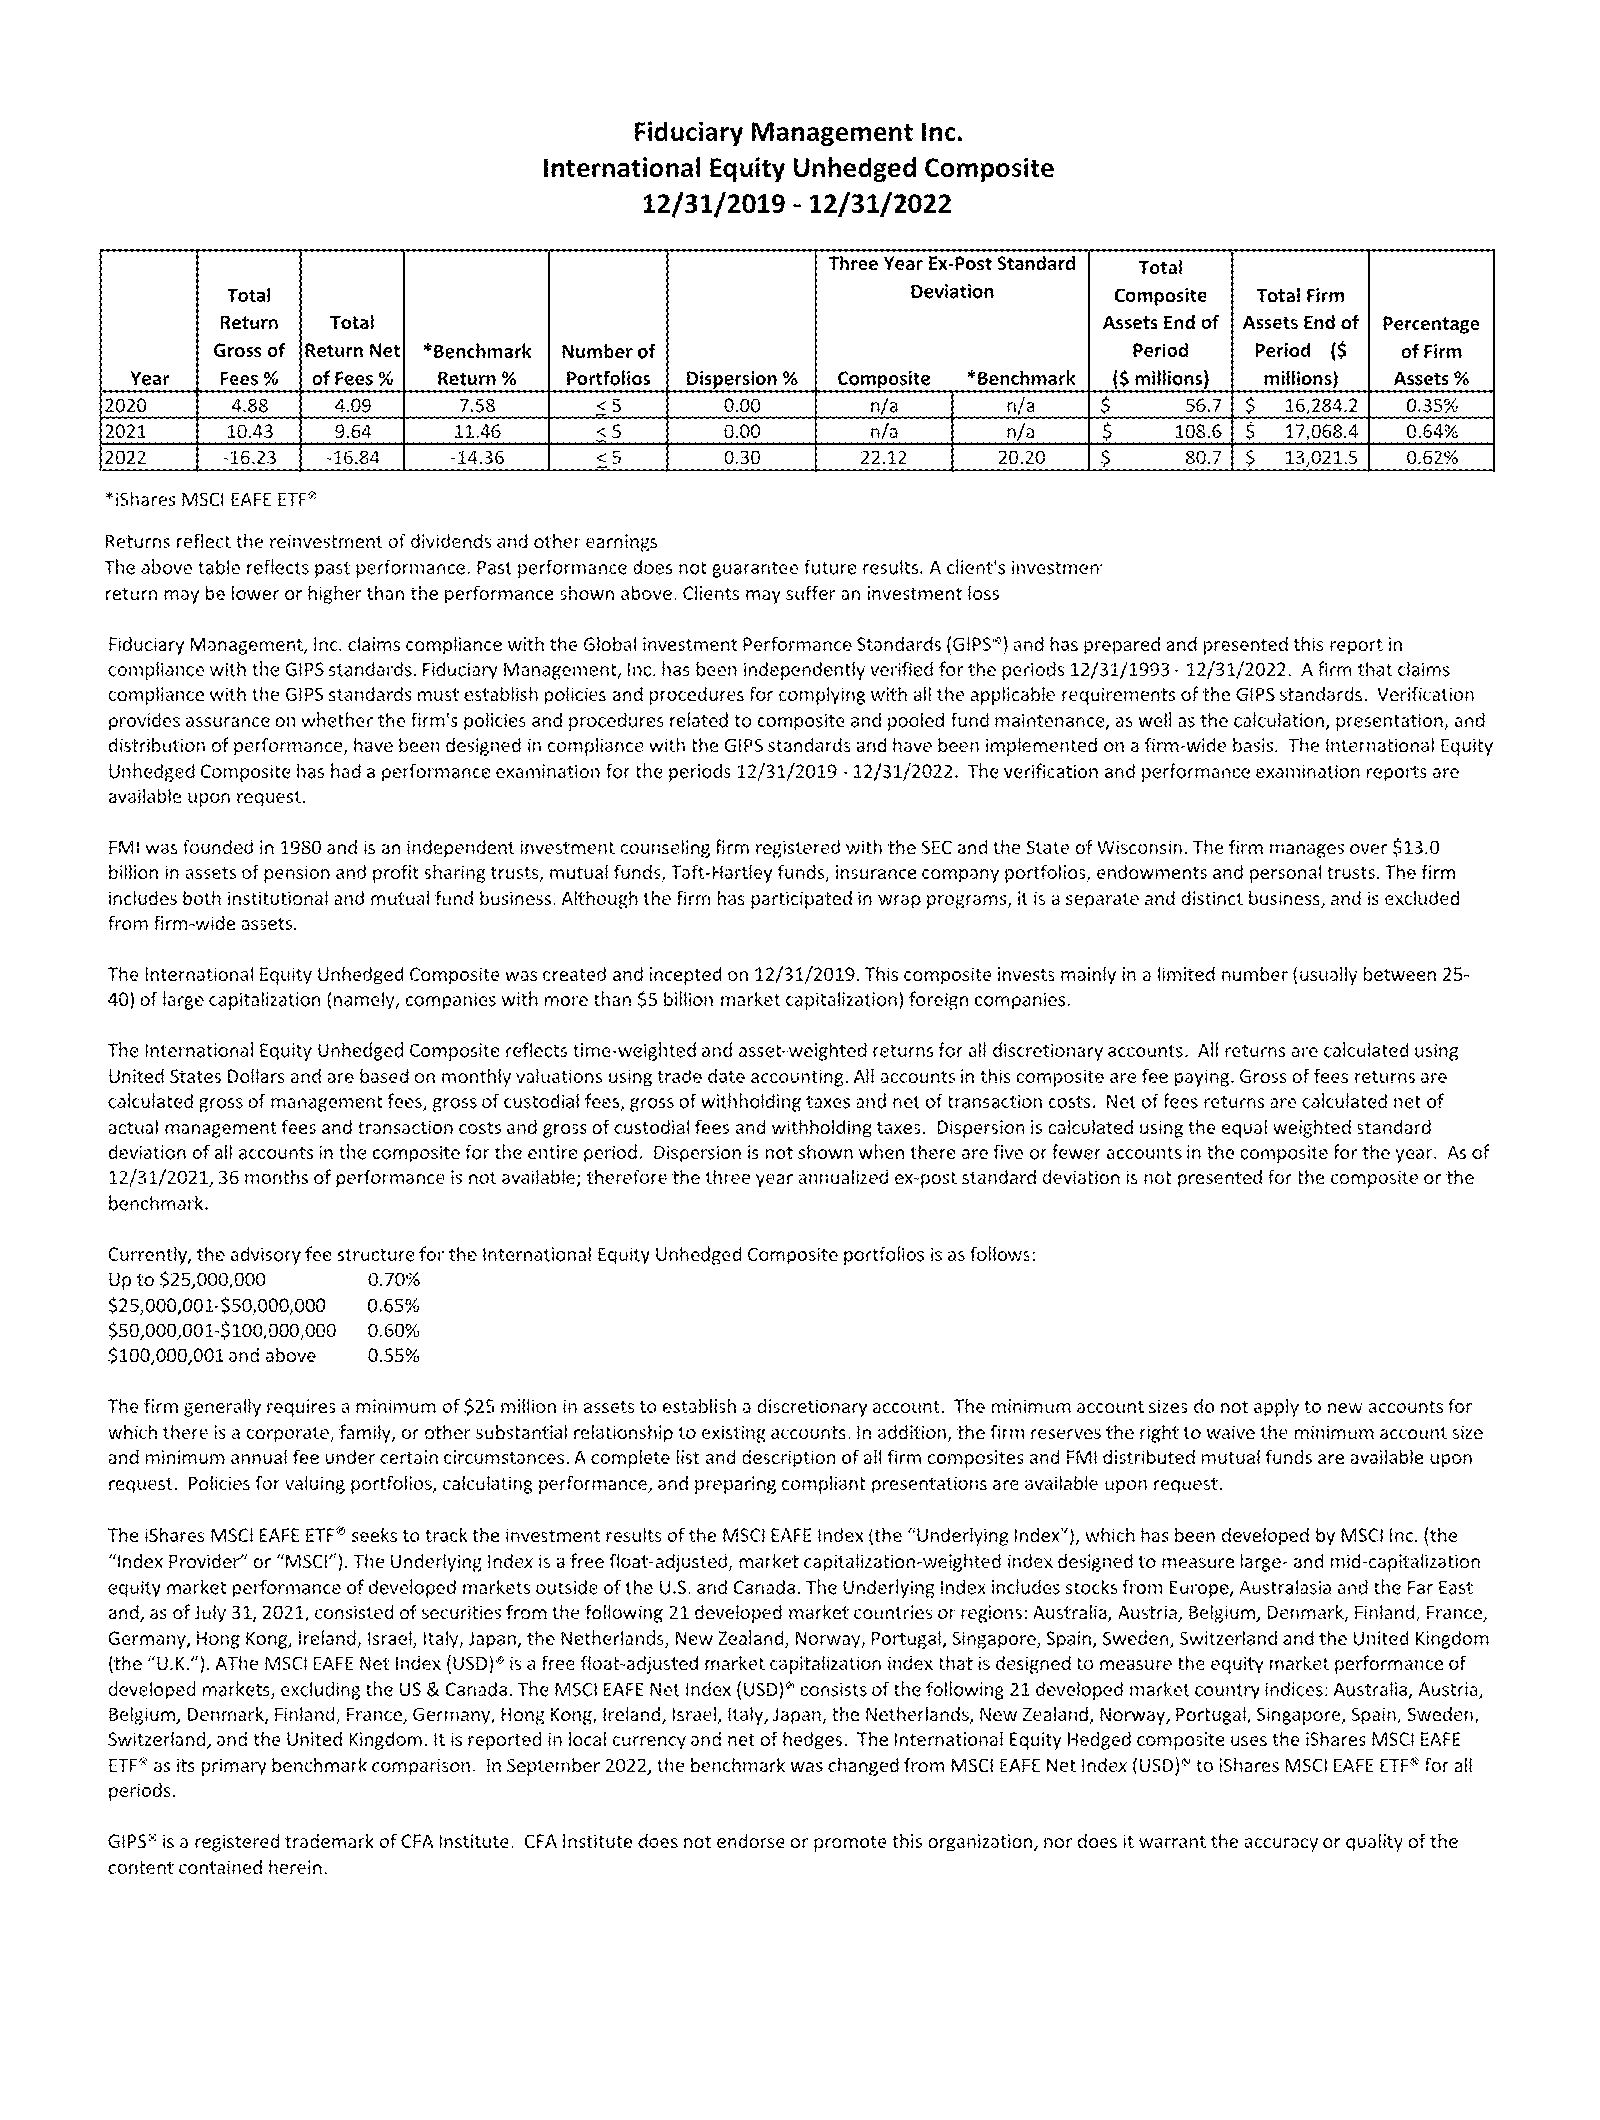
FMI International Equity
The FMI International Strategies gained approximately 10.0% (gross) / 9.8% ((net)) on a currency hedged basis and 10.8% (gross) / 10.6% ((net)) currency unhedged in the March quarter, compared with the iShares Currency Hedged MSCI EAFE ETF increase of 9.14% and 8.96% for the iShares MSCI EAFE ETF. The iShares MSCI EAFE Value ETF gained 5.78%1 over the same period. FMI's top performing sectors included Finance, Retail Trade, and Consumer Services sectors, while Producer Manufacturing, Industrial Services, and Consumer Non-Durables did not keep pace. B&M European Value Retail S.A. ( BMRPF ), Howden Joinery Group PLC ( HWDJF ), and Rexel S.A. ( RXLSF ) were strong individual performers, as Sodexo S.A. ( SDXOF ), Unilever PLC ( UL ), and Roche Holding AG ( RHHBY ) underperformed. Performance was aided by our significant underweight in financials and a bounce back in our UK consumer stocks, which were hit hard in 2022. A slight decline in the USD was a headwind for FMI's currency hedged strategy.
Global Banking Crisis
The first quarter of 2023 housed the worst banking meltdown since the Global Financial Crisis (GFC). Banking is a levered business model built on trust. Just the whisper of trouble at an otherwise sound bank can be enough to set off a run. Historically, we have been under-weight the banking industry for these reasons. Where we do invest, we pick our spots carefully. Unfortunately, we have recently gotten another reminder of just how fragile these businesses can be with the failure of three banks, including Silicon Valley Bank ( SVB ), the 16th largest bank in the U.S. and key engine for the tech ecosystem. This failure resulted from both well-documented environmental factors (ultra-low interest rates, tech/venture capital boom, COVID benefits, and lack of risk management) and more arcane company specific factors (misunderstood deposit duration, asset/liability mismatches, and subpar management).
During COVID, tech companies were flush with cash as their businesses did well and they raised large sums from venture capitalists. SVB received a lot of this cash, with deposits swelling from $62 billion at the end of Q4 2019 to $198 billion at the end of Q1 2022, up more than three times! Loan demand didn't keep up with deposit growth, creating tremendous pressure to deploy that cash (earn something on it, they said). SVB did just that by buying longer duration securities. Their timing couldn't have been worse, as the Fed rapidly raised rates throughout 2022, leaving their large bond portfolio underwater. As long as these securities can be held to maturity, this isn't an issue. But just as quickly as the cash came in the door, it went back out, as cash-burning tech companies struggled, and venture capital funding dried up. SVB clearly misunderstood the correlation of their customers' behavior, particularly given only 6% of their deposits were FDIC-insured. Said another way, they overestimated the duration of their liabilities (deposits) and then gravely mismatched them with the duration of their assets. The final nail in SVB's coffin was their longtime CEO Greg Becker's violation of the first rule of bank runs: don't tell your clients not to panic! The clients, of course, did the exact opposite of what he asked, and SVB was taken over by the FDIC in less than 48 hours.
Post-GFC regulation focused on capital adequacy and credit risk, largely ignoring liquidity risk. This is yet another case of the folly in fighting the last war, and how regulations meant to ensure safety can often shift risk to different areas. Risk is akin to energy, it cannot be created or destroyed, only transferred. This is why at FMI we prefer, all else equal, less regulation and to let capitalism do its job. Alas, we must live in the world as it is, not as we want it to be, and are prepared for a more onerous regulatory environment which will likely mean lower profitability, return on equity, and multiples for the banking sector.
Our two most impacted holdings during this recent crisis were Zions Bancorp. and discount broker Charles Schwab. We believe both have sticky deposit bases, best-in-class management teams, conservative balance sheets, and attractive valuations. In both cases, outside of absolute contagion/panic resulting in a run on their deposits (a very low probability tail risk), we view the impact on the businesses as more of an "earnings" event, not a "balance sheet" event. Zions and Schwab got caught up in the contagious fear around SVB's collapse due to some optical similarities between their balance sheets (namely bonds carried at mark-to-market losses), and Zions being a West Coast regional bank. We believe the similarities largely end there. Zions has a much more diverse deposit base than SVB. We estimate that half of Zions' deposit base are small and medium-sized business operating deposits, which have historically been quite stable and a competitive advantage. Nearly half of Zions' deposits are FDIC-insured, and the bank has ample liquidity to meet outflows without selling its securities portfolio. Similarly, Schwab's retail deposit base is very sticky. Over 80% of their customers' cash is FDIC-insured, and the cash is spread across approximately 34 million brokerage accounts (average ~$10,000 in bank cash per account). Schwab has more balance sheet liquidity than deposits. In both cases, there appears to be a low risk of correlation among their respective client bases. Although there will likely be some profit headwinds that stem from this crisis, we viewed the large declines in these shares as overly punitive, and thus believe the risk/reward for each is increasingly attractive. We have added to both positions.
The banking crisis has also spread overseas with the Credit Suisse "takeunder" by UBS. The circumstances that led to this outcome share some parallels with the bank failures in the U.S., specifically the lack of risk control, management missteps, and concerns around liquidity, all highlighting some of the challenges of investing in the banking industry. Credit Suisse never fit our eye in terms of quality and governance standards, and was too opaque to analyze with much precision. In Europe in particular, it has been especially difficult to find investments in the banking industry that meet our stringent criteria.
We own two banks in the International portfolios - Lloyds Banking Group ( LYG ) and DBS Group ( DBSDF ). They share some important characteristics that set them apart from most international banks. To start, both operate in countries with a favorable market structure. Lloyds is the market leader in the UK, and DBS is the market leader in Singapore. The UK and Singapore have relatively consolidated banking markets with strong rule of law. Lloyds and DBS both have superior deposit franchises and digital capabilities. Their deposit market share is over 20%. To put this in perspective, J.P. Morgan (the largest bank in the U.S.) has a deposit market share of around 11%. They have healthy capital ratios and ample liquidity. As opposed to the failed U.S. banks, the balance sheet values of their securities portfolios approximate fair value. Finally, both have management teams that think and act like shareholders. The combination of these attributes makes these banks compelling investment opportunities in what is an otherwise difficult industry.
Speculative Fever
With global bond yields and discount rates falling sharply in recent weeks amidst the banking crisis, the growth/momentum trade (which dominated most of the last decade) is back on, after a welcome but short-lived reprieve in 2022. Year-to-date, the Nasdaq composite is up 17.05%, while the poster child for technology speculation, the Ark Innovation ETF ( ARKK ), is up a whopping 29.13%. According to Goldman Sachs, some of the top performing themes in the U.S. include Artificial Intelligence, Megacap Tech, Secular Growth, Retail Favorites, Non-Profitable Tech, and Expensive Software. The extreme divergence between Growth and Value is depicted below:
Ironically, the collapse of SVB - which catered to money-losing tech companies - helped trigger tech's dramatic stock resurgence! At FMI, we find it troubling that some tech companies are among the most aggressive users and abusers of "adjusted earnings." Investors are asked to ignore a host of costs, such as stock-based compensation (SBC), restructuring charges, integration costs, and the amortization of acquired intangibles (some of which can be warranted). SBC is the most egregious adjustment, in our view, as there is a real economic cost, which includes dilution that ultimately transfers ownership from investors to employees.
Barron's recently penned an article noting that high levels of equity-based compensation is a "structural problem for the tech industry." We agree. They write that, "The trend has particularly taken off in the last decade. The average stock-based compensation for the industry rose from just 4.2% of revenue in 2012 to 10.5% in 2020, accelerating to 22.5% in 2021, according to SVB MoffettNathanson. The full numbers for 2022 aren't yet available." That's quite a ramp! While many Wall Street analysts simply ignore SBC (to management's delight), at FMI we rigorously account for it. Disregarding an expense that equates to over 20% of sales is neither prudent nor in a business owner's best interest. Needless to say, valuations in the tech space are higher than the sanitized "adjusted earnings" multiples would suggest on the surface.
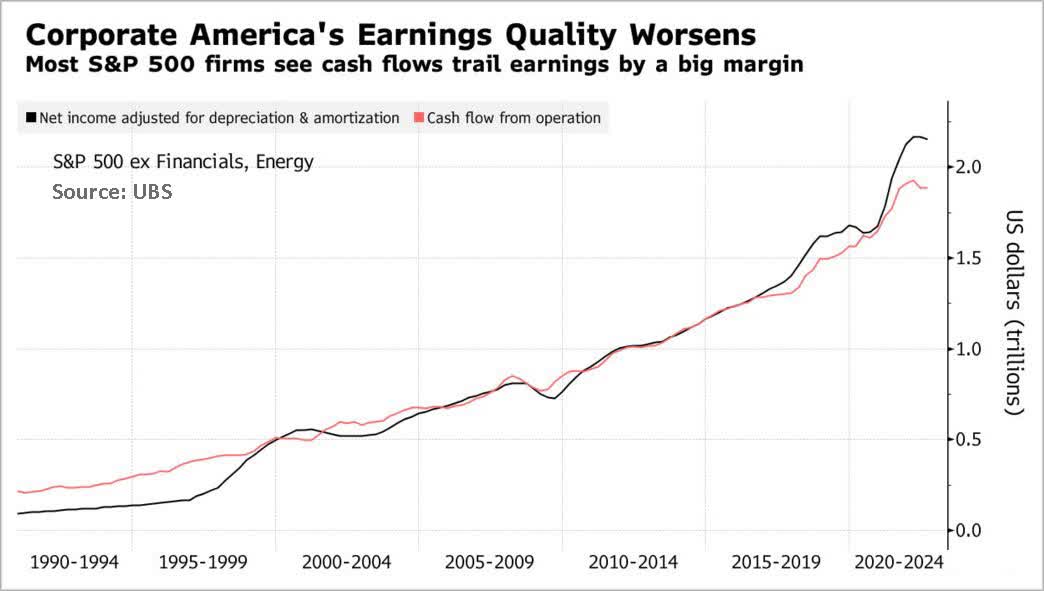
Furthermore, a recent article by Bloomberg states that "Corporate America's earnings quality is the worst in three decades," according to a recent study by UBS. "Earnings across US industries have started to expand noticeably faster than cash is coming in the door. Income at S&P 500 companies, adjusted for amortization and depreciation, topped cash flows from operations by 14% in the year through September," per the report. Here again, the perception of corporate earnings does not appear to match reality, as management teams play fast and loose with the numbers. The article cites Sanjeev Bhorraj, alumni professor in asset management at Cornell University: "Managers are under so much pressure to deliver earnings that they're using a lot more accounting than they have in the past to make their earnings look good."
This is a dangerous game, and one we have called attention to on several occasions. In recent years, while money was free and stock markets soared (irrespective of valuation), quality of earnings was largely an afterthought. Perhaps as markets settle into a more normal cost of capital, investor attention on true earnings and cash flow will come back in vogue. As fundamental investors, we can only hope.
Contrarian Special: Housing Exposure
As we highlighted last quarter, stocks with economic sensitivity were under significant selling pressure in 2022, with housing related companies among the most out of favor. Rising interest rates and inflation have weighed on sentiment causing consumer confidence, affordability, and home prices to wane. Though we acknowledge the near-term pressures, our long-term investment horizon (three to five years) and focus on full-cycle business value give us confidence to go against the grain.
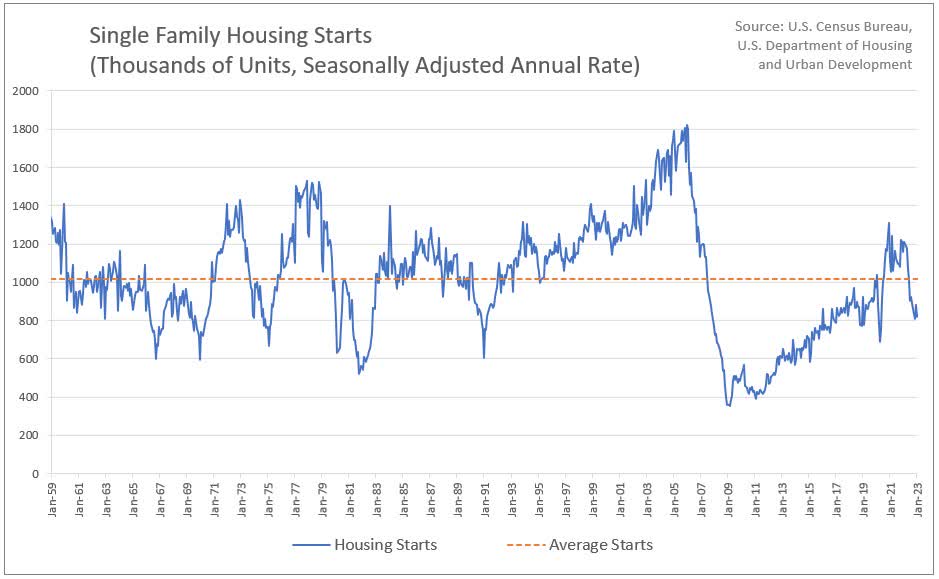
If we take a step back, there is a lot to like in terms of the long-run secular outlook for housing. In the U.S., total housing inventory remains near multi-decade lows, as the housing market has been underbuilt since the GFC (see housing start chart below). The median age of an occupied home continues to climb, reaching ~40 years (up around 30% since 2005). An aging housing stock should lead to rising demand for new construction and repair and remodel (R&R) work over the long-term. Secular changes including work-from-home, urban flight, and aging in place have boosted demand. Millennials continue to come of age in terms of first-time home buying (average age ~36 years), and household formation has accelerated since the pandemic, driven by younger aged cohorts. Homeownership rates are near long-term averages and have meaningfully trended up the past five years, which is encouraging.
We are particularly attracted to the R&R market. Homeowners have strong balance sheets and have built up significant equity as home prices have appreciated in recent years. Low-ticket R&R has historically been resilient during periods of economic weakness, and there is believed to be significant underinvestment in R&R over the last 20 years, creating pent-up demand. Locked in mortgages at ultra-low rates, and limited home supply have discouraged moving and will likely lead homeowners to invest more in their current homes.
The dynamics in the UK are similar; the housing stock is very old (70-year average), new supply of housing is constrained (and not getting better), people are staying in their homes longer, unemployment remains low, work-from home and aging in place are prevalent, and consumers have significant savings built up from COVID. These are tailwinds for R&R activity, which should bode well for future growth prospects.
In each portfolio, we've taken advantage of the market's extreme pessimism around housing. We've added to several positions where we see a temporary mark-to-market creating a significant discount to intrinsic value. In our September letters, we featured three such holdings: Simpson Manufacturing ( SSD ), Ferguson ( FEG ), and Howden Joinery Group. Below, we highlight Fortune Brands Innovations, a fourth quarter purchase with a very strong position in the R&R market. Two additional holdings in managed care and travel are also featured:
UnitedHealth Group Inc.
UnitedHealth Group ( UNH ) is the largest, best-managed, and most-diversified managed care organization in the U.S. and is among the largest providers of health services and technology through its fast-growing Optum businesses. In managed care (health insurance), UNH is the number one national provider in the rapidly expanding Medicare Advantage market, in addition to the number one and number two positions in most other subsegments. Today, scale is more important than ever in delivering top benefits at competitive prices. Scaled buying power (and network building) ensures the most visibility into medical costs at a given site-of-care and scaled investment gives UNH the most enhanced capabilities (tools and technology, typically from Optum) that nudge participants towards lower cost sites-of-care. We view the forward valuation (17 times 2024E EPS) and long-term growth algorithm as attractive.
Fortune Brands Innovations Inc.
Fortune Brands ( FBIN ) has one of the highest quality portfolios of branded building products in the world. Recognizable brands include Moen, Therma-Tru, Larson, Master Lock, and Sentry Safe. The stock traded down on housing-related macro concerns, along with an overhang from the company's now-completed spinoff of its lower-quality cabinetry business. Brand, innovation, and distribution strength are key differentiators, as the company has a leading market position in the attractive and consolidated global plumbing market. R&R accounts for over two thirds of the revenue mix, which should perform more defensively given the lower ticket nature of the products. The company has a strong track record of organic growth, margin expansion, and a strong (mid teens) return on invested capital (ROIC). Organic sales growth averaged 7% annually over the last decade, approximately 2-3% above estimated end-market growth. The company is embracing simplification and capital returns, which should be accretive to shareholder value. On 2024 estimates, the stock trades at only 14 times earnings per share (EPS).
Booking Holdings Inc.
Booking Holdings ( BKNG ) is the world's largest online travel agency. It has a network effect business model, where Booking acts as an aggregator of supply (independent hotels) on one side and demand (leisure travelers) on the other. This aggregation of fragmented supply and demand allows them to charge a healthy 15% commission when a user books a room. It also allows them to outspend all other players on customer acquisition while still earning good returns on ad spend. Given Booking has to invest very little tangible capital, ROIC is over 80%. Booking has tremendous scale as the global number one. Booking is a capital light business in a secularly growing industry, has a net cash balance sheet, and a solid management team. Travel continues to recover, with particular improvement in Europe (over 70% of sales), and Booking is taking market share from competitors. We find ~17 times normalized earnings (2024E) to be a punitive valuation. We believe Booking has a long runway for growth when the dust fully settles after COVID and the Ukraine war.
In over 40 years in business, we have managed through several stock market crises. We want to remind our readers that volatility creates opportunities, and that the portfolios continue to hold strong businesses with robust balance sheets. While stock prices can come under near-term pressure amidst fear and emotion, in the fullness of time, a company's intrinsic value will be recognized by the market. As risk-averse investors with a focus on downside protection, we remain optimistic about our ability to outperform through a cycle.
Thank you for your continued support of Fiduciary Management, Inc.
Footnotes1 Source: Bloomberg - returns do not reflect management fees, transaction costs or expenses. Performance is based on market price returns. Beginning 8/10/20, market price returns are calculated using closing price. Prior to 8/10/20, market price returns were calculated using midpoint bid/ask spread at 4:00 PM ET. |
Editor's Note: The summary bullets for this article were chosen by Seeking Alpha editors.
For further details see:
Fiduciary Management Q1 2023 Investment Letter