PFF - FPE: Good-Looking Relative To Peers But Unattractive
2023-10-24 12:20:50 ET
Summary
- First Trust Preferred Securities and Income ETF is a high yield fund with a 12-month distribution rate of 6.44%.
- The fund is invested in preferred stocks and has a heavy concentration in the financial sector, particularly in banks.
- FPE has outperformed other preferred stock ETFs in the last 10 years, but it has experienced significant losses in value and income stream.
This article series aims at evaluating ETFs (exchange-traded funds) regarding past performance and portfolio metrics. Reviews with updated data are posted when necessary.
Strategy and portfolio
First Trust Preferred Securities and Income ETF (FPE) is a high-yield fund paying monthly distributions. It has 264 holdings, a 12-month distribution rate of 6.44% and a total expense ratio of 0.85%. It was launched on 2/11/2013 with the objective " to seek total return and to provide current income ". It is an actively managed fund. Actively managed funds are very flexible and allow discretionary decisions. On the downside, they are much less transparent in their strategies than funds tracking an index.
The fund is invested in preferred stocks, which are hybrid securities with a behavior between stocks and bonds. In fact, preferred stocks are much closer to convertible bonds than to common stocks. They often have high yields attracting income-seeking investors.
As described in the prospectus by FirstTrust , the fund has
three significant areas of analysis: credit fundamentals; relative value; and technical aspects of the securities, which may include, but are not limited to, interest rate sensitivity, call features, covenants, maturities, trading volumes, liquidity and pricing inefficiencies.
Securities issued by U.S. companies represent 52.2% of asset value. For clarity, the next chart plots the fund's top countries without the U.S.
Country allocation except the U.S. (chart: author; data: First Trust)
About 73% of asset value is in the financial sector. The next chart shows the top 10 industries, representing 94.5% of assets. Banks come first (41.2%), followed by insurance (19.9%). Other industries are below 9%.
Industry breakdown (chart: author; data: First Trust)
From a credit risk point of view, about 65% of assets have an investment grade rating (BBB- of better).
Ratings in % of assets (Chart: Author; data: First Trust)
Several securities issued by the same company may be included in the portfolio as distinct holdings. To assess company exposure, I have calculated and listed the weights of the top 10 issuers in the next table. They represent 29.9% of asset value and the top name is at about 4%. Therefore, risks related to individual companies are moderate. However, keep in mind that exposure to financials is massive.
| Name |
| U.S. common stock t icker |
| weight |
| BARCLAYS PLC |
| 3.92% |
| WELLS FARGO & COMPANY |
| 3.89% |
| ENBRIDGE INC |
| 3.72% |
| BANK OF AMERICA CORP |
| 3.31% |
| ENERGY TRANSFER LP |
| 3.01% |
| LLOYDS BANKING GROUP PLC |
| 2.85% |
| BNP PARIBAS |
| 2.78% |
| CITIGROUP INC |
| 2.22% |
| HIGHLAND HOLDINGS |
| 2.10% |
| AERCAP HOLDINGS NV |
| 2.09% |
Competitors
The table below lists 16 preferred stocks ETFs. The list may not be exhaustive.
| Ticker |
| Name |
| Inception |
| iShares Preferred and Income Securities ETF |
| 03/26/2007 |
| Invesco Preferred Portfolio ETF |
| 01/31/2008 |
| Global X U.S. Preferred ETF |
| 09/11/2017 |
| Invesco Variable Rate Preferred ETF |
| 05/01/2014 |
| Invesco Financial Preferred ETF |
| 12/01/2006 |
| VanEck Vectors Preferred Securities ex Financials ETF |
| 07/16/2012 |
| SPDR Wells Fargo Preferred Stock ETF |
| 09/16/2009 |
| Virtus InfraCap U.S. Preferred Stock ETF |
| 05/15/2018 |
| Principal Spectrum Preferred Securities Active ETF |
| 07/10/2017 |
| Global X Variable Rate Preferred ETF |
| 06/24/2020 |
| AAM Low Duration Preferred and Income Securities ETF |
| 11/27/2019 |
| Global X SuperIncome Preferred ETF |
| 07/16/2012 |
| Innovator S&P Investment Grade Preferred ETF |
| 05/23/2016 |
| InfraCap REIT Preferred ETF |
| 02/07/2017 |
| American Century Quality Preferred ETF |
| 02/18/2021 |
| John Hancock Preferred Income ETF |
| 12/15/2021 |
Performance
The next table compares return and risk metrics of FPE, the corporate bond benchmark iShares iBoxx $ Investment Grade Corporate Bond ETF ( LQD ) and the stock benchmark SPY since March 2013.
| since 3/1/2013 |
| Total Return |
| Annual Return |
| Drawdown |
| Sharpe ratio |
| FPE |
| 38.46% |
| 3.10% |
| -33.35% |
| 0.28 |
| SPY |
| 237.10% |
| 12.09% |
| -33.72% |
| 0.77 |
| LQD |
| 15.98% |
| 1.40% |
| -24.95% |
| 0.12 |
FPE is almost on par with stocks in maximum drawdown and closer to bonds in performance (measured in annualized return or Sharpe ratio).
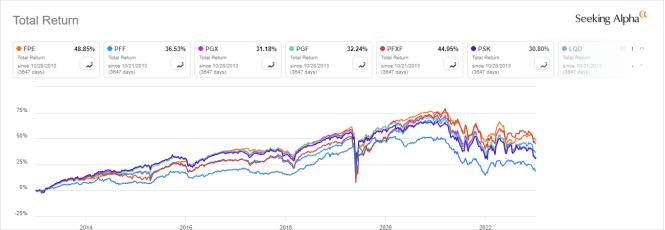
The next chart compares the 10-year total returns of FPE and its five largest competitors with at least 10 years of price history: PFF, PGX, PGF, PFXF, PSK. It also includes the corporate bond benchmark LQD.
FPE is the best performer, shortly ahead of PFXF.
FPE vs competitors, 10-year total return (Seeking Alpha)
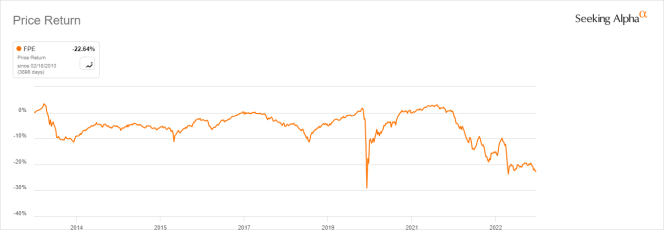
The annualized return is inferior to the distribution rate, which points to capital decay. The next chart confirms it: FPE share price has lost about 22% since inception. To make it worse, the cumulative inflation at the same time has been 32%, based on CPI.
FPE price return (Seeking Alpha)
Moreover, the annual sum of distributions went down from $1.13 in 2014 to $0.95 in 2022. It means a loss of 16% in the income stream in 8 years, to be combined with a cumulative inflation of 31%.
FPE Distribution history (Seeking Alpha)
Takeaw ay
First Trust Preferred Securities and Income ETF holds preferred stocks from the U.S. and other developed markets. About two-thirds of asset value has an investment-grade credit rating. The portfolio is quite diversified across a number of issuers, but it is heavily concentrated in financials, especially in banks. FPE has outperformed the largest preferred stock ETFs in the last 10 years, yet performance is underwhelming. The fund shows significant losses in value and income stream since 2013, while cumulative inflation has been over 30%. This decay is inherent to the asset category and not due to a bad strategy. Anyway, I doubt FPE could suddenly become a winner in a more challenging environment.
For further details see:
FPE: Good-Looking Relative To Peers, But Unattractive