FTLS - FTLS: Better Returns Than Expensive Hedge Funds
2023-08-29 06:00:27 ET
Summary
- First Trust Long/Short Equity ETF uses earnings quality to pick stocks to go long and short.
- FTLS has delivered a solid historical performance that is commensurate with its mandate of reduced volatility and drawdowns.
- Compared to expense long/short equity hedge funds, the FTLS appears to be a good option as it has better performance and lower fees.
The First Trust Long/Short Equity ETF ( FTLS ) is an active long/short ETF that attempts to use earnings quality to pick stocks to go long and short. It aims to reduce portfolio volatility and deliver superior risk adjusted returns.
Looking at the fund's performance, I believe First Trust has delivered on its promise as the FTLS ETF has delivered ~60% of the market's returns with roughly half of the market's volatility and drawdown.
The FTLS ETF has actually outperformed the Eurekahedge Long/Short Equity Index, an index of long/short equity hedge funds that typically charge much higher fees. For investors looking for hedge fund performance while paying ETF-like fees, the FTLS ETF could be a good choice.
Fund Overview
The First Trust Long/Short Equity ETF ( FTLS ) seeks to provide investors with long-term total returns derived from a portfolio of long and short equity positions.
Strategy
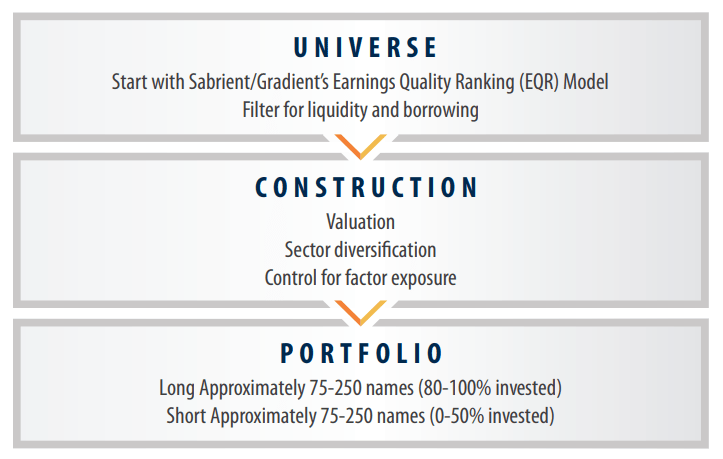
Over a full cycle, the FTLS ETF seeks to deliver equity-like returns with lower volatility and beta. FTLS's actively managed short-portfolio (0-50% short exposure) seeks to mitigate losses for the fund (Figure 1).
Figure 1: FTLS strategy overview (FTLS investor guide)
The manager of the FTLS ETF believes that companies with higher quality earnings will outperform lower quality earnings in the long-run and hence the FTLS ETF will systematically go long 'high quality' earnings stocks and short 'low quality' earnings stocks as a hedge.
For FTLS, earnings quality is an assessment of the aggressiveness of accounting practices behind a company's reported earnings. Research by Sabrient Systems and Gradient Analytics shows that aggressive accounting practices, or 'low quality earnings, are associated with lower future stock returns compared to those companies with more conservative accounting practices. The FTLS ETF uses Sabrient Systems' Earnings Quality Rank ("EQR") as a component in its stock selection process. The manager will also filter for liquidity, ease of borrow, as well as valuation and sector diversification to come up with a long portfolio of 75-250 names (80-100% exposure) and a short portfolio of approximately 75 - 250 names (0-50% exposure) (Figure 2).
Figure 3 - FTLS portfolio construction (FTLS investor guide)
The FTLS ETF has been fairly successful, garnering $714 million in net assets while charging a 1.41% expense ratio (Figure 3).
Figure 3 - FTLS fund overview (ftportfolios.com)
Portfolio Holdings
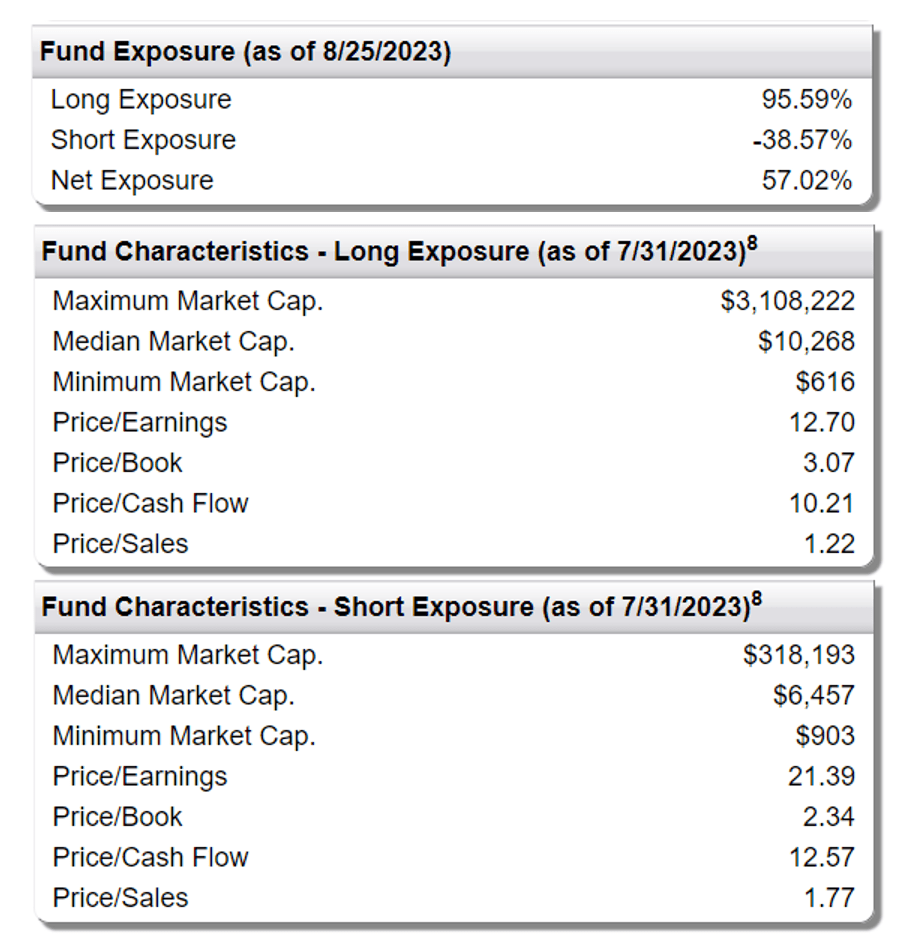
Figure 4 shows the overall portfolio characteristics of the FTLS ETF. The fund is currently long 95.6% exposure and short 38.6% exposure as of August 25, 2023 for net long exposure of 57.0%.
Figure 4 - FTLS long/short exposures (ftportfolios.com)
FTLS's long exposure is invested in companies with a median market cap of $10.3 billion and average P/E of 12.7x whereas the short exposure has a median market cap of $6.5 billion and average P/E of 21.4. In general, it appears the FTLS ETF has a value-tilt, as its longs trade at lower P/E, P/CF, and P/S multiples compared to its shorts.
Figure 5 shows FTLS's sector exposure in its long and short portfolios. The ETF is primarily long stocks in the Information Technology (22.6%), Consumer Discretionary (11.7%), Health Care (11.0%) sectors while it is short Industrials (-6.1%), Information Technology (-4.1%), and Materials (-3.9%).
Figure 5 - FTLS long and short sector exposures (ftportfolios.com)
Returns
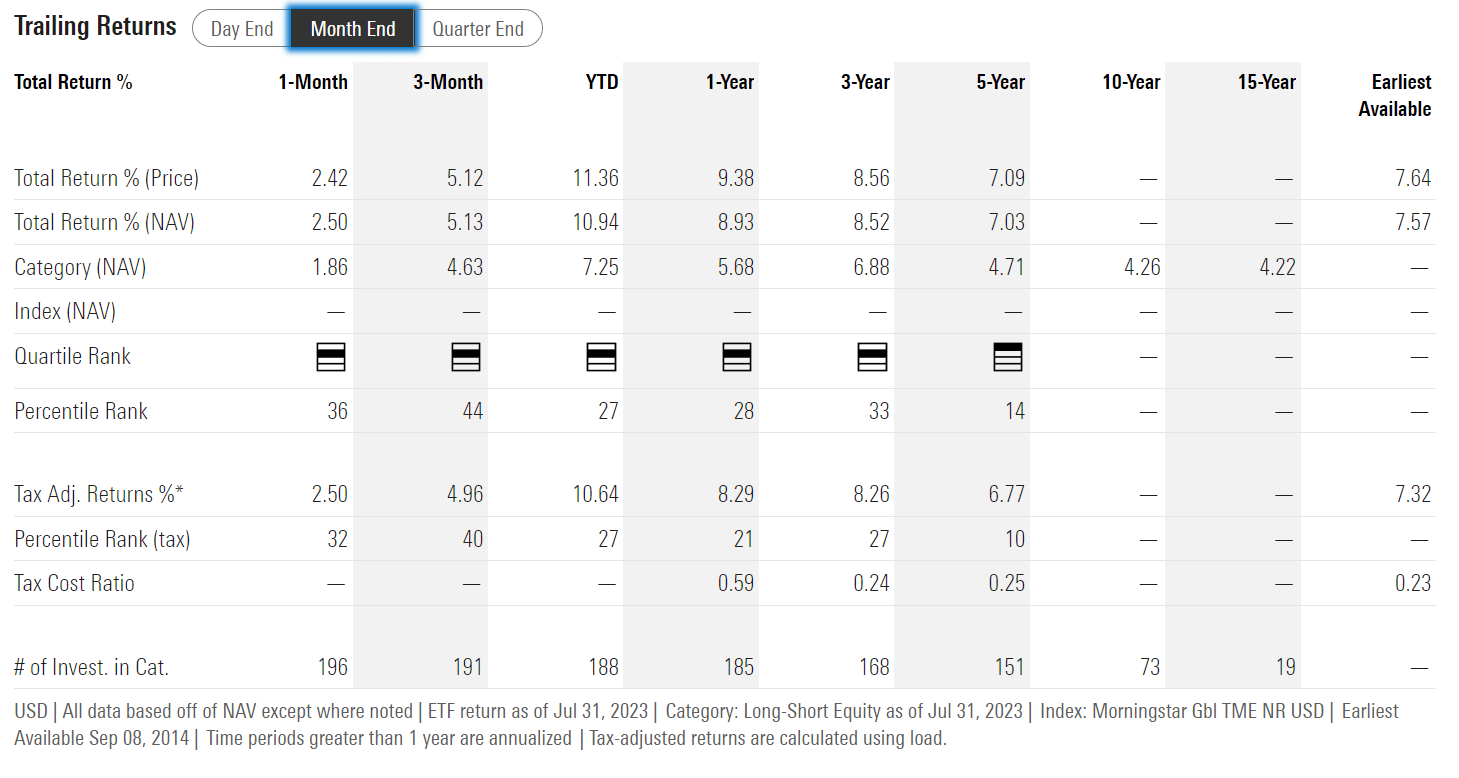
The FTLS ETF has delivered solid long-term historical returns with 3 and 5Yr average annual returns of 8.5% and 7.0% respectively to July 31, 2023 (Figure 6).
Figure 6 - FTLS historical returns (morningstar.com)
Although the FTLS ETF has underperformed the markets as represented by the SPDR S&P 500 ETF Trust ( SPY ) in Figure 7, simply comparing FTLS's historical returns against SPY's 3 and 5Yr returns of 13.6% and 12.1% may be comparing apples to oranges as FTLS's mandate is to reduce volatility and drawdowns.
Figure 7 - SPY historical returns (morningstar.com)
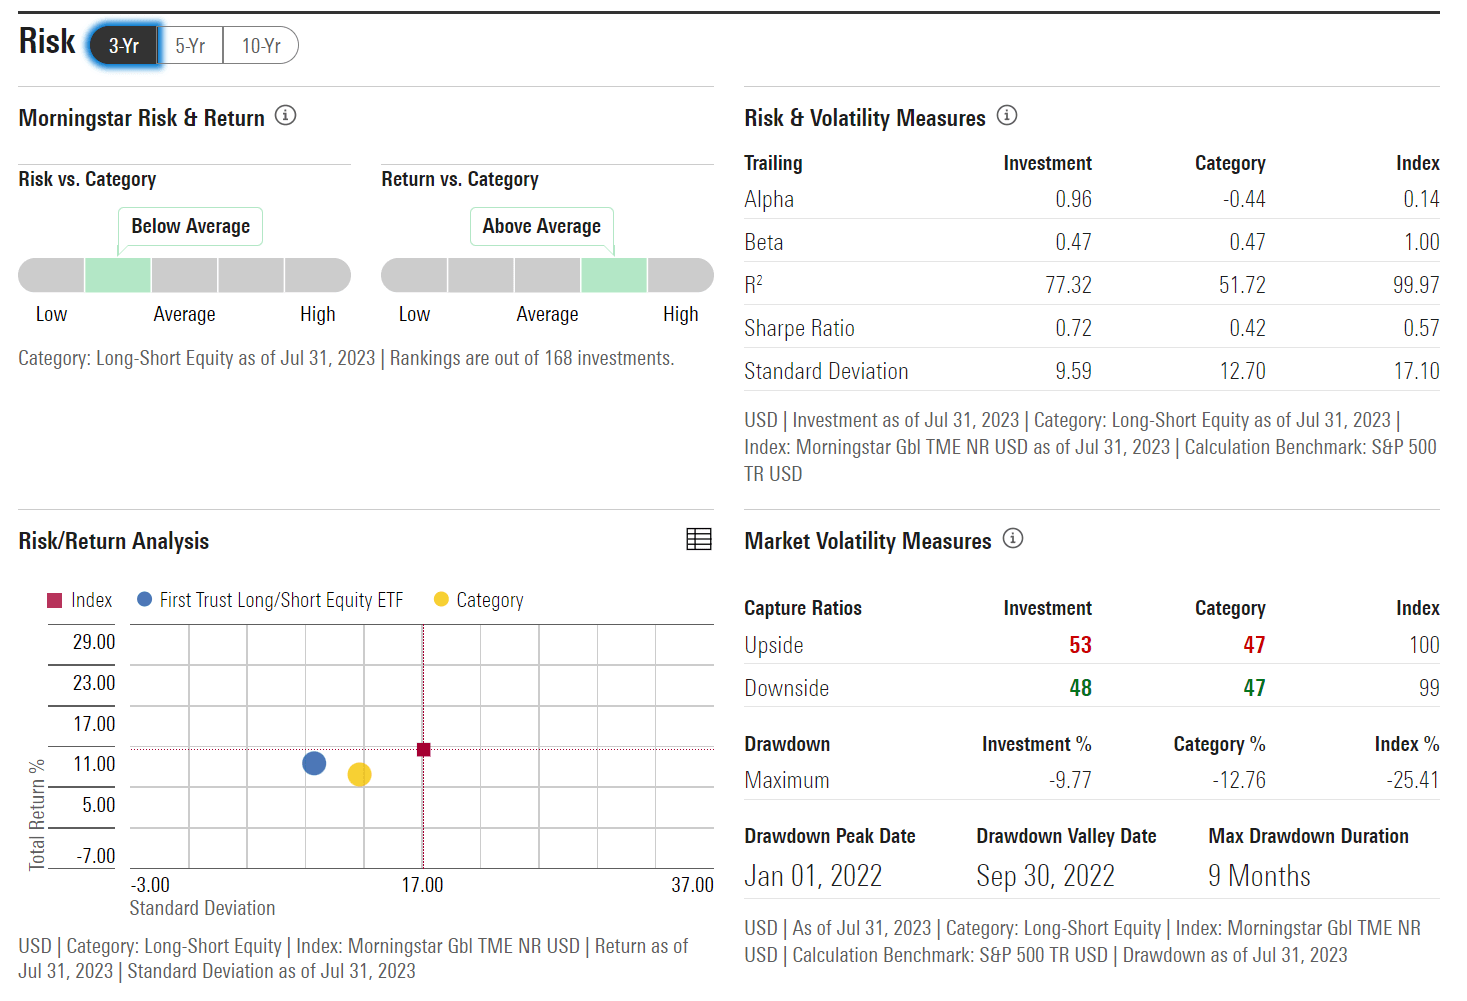
For example, on a trailing 3 year basis, the FTLS ETF has a 9.6% standard deviation of returns, which translates to a 0.72 Sharpe Ratio (Figure 8).
Figure 8 - FTLS risk measures (morningstar.com)
On the same timeframe, the SPY ETF has a 18.0% standard deviation of returns and a 0.71 Sharpe Ratio (Figure 9). So on a risk-adjusted basis, FTLS's returns have been slightly superior (0.72 vs. 0.71 Sharpe Ratio).
Figure 9 - SPY risk measures (morningstar.com)
Similarly, the FTLS ETF has a maximum drawdown of 9.8% in the past 3 years while the SPY ETF has a maximum drawdown of 23.9%, which shows once again that FTLS is performing as expected.
Distribution & Yield
The FTLS ETF pays a nominal trailing 12 month distribution of 1.4%, which is slightly lower than the distribution yield on the SPY ETF of 1.5% (Figure 10).
Figure 10 - FTLS distribution (Seeking Alpha)
How Does FTLS Compare Against L/S Hedge Funds?
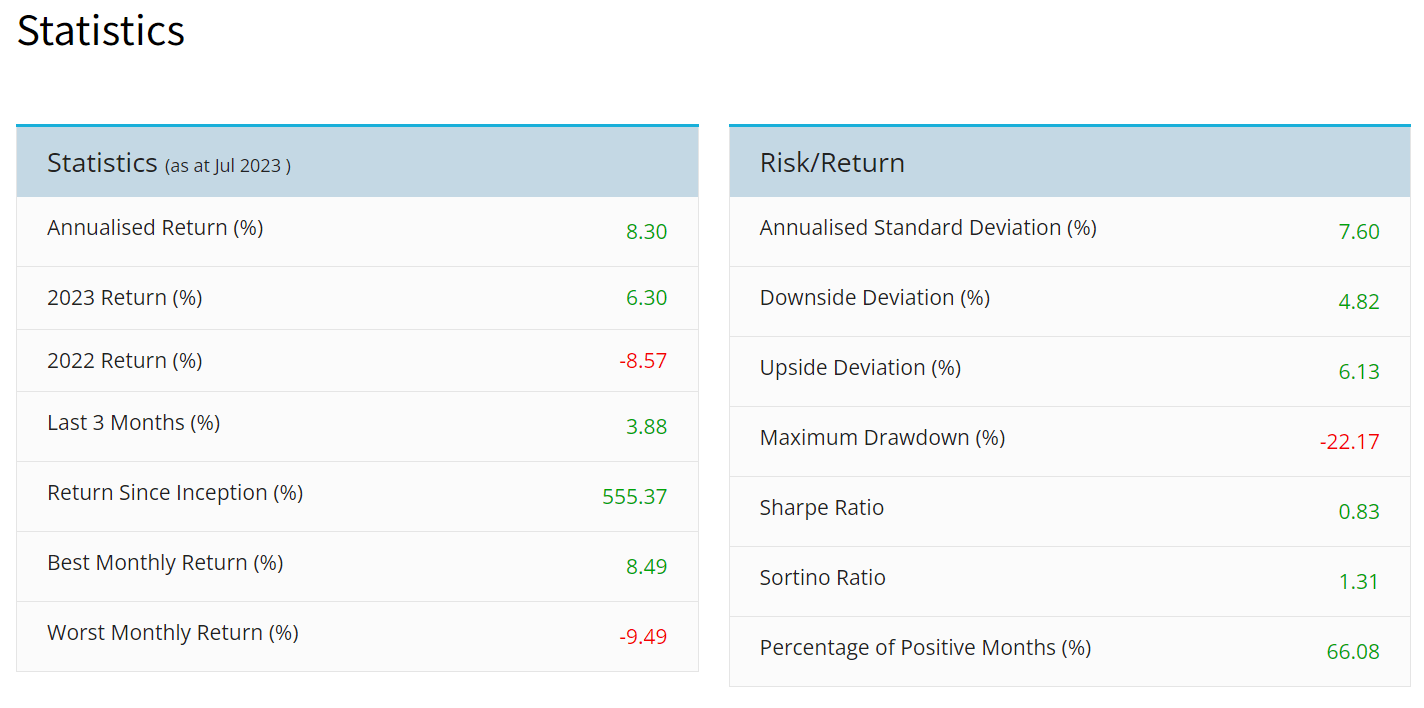
One interesting comparison we can make with the FTLS ETF is against the Eurekahedge Long/Short Equity Index , an index of long/short equity hedge funds that typically charge 2% management fees and 20% performance fees. The Eurekahedge Long/Short Equity Index has delivered 8.3% annualized returns since inception in January 2000 with annualized standard deviation of 7.6% (Figure 12).
Figure 12 - Eurekahedge Long/Short Equity Index statistics (eurekahedge.com)
Comparing FTLS's returns directly against the Eurekahedge index, we can see that the FTLS ETF has outperformed the index in all years except 2020, when FTLS returned 2.4% while the index returned 16.7%. Overall, the FTLS ETF has delivered cumulative returns of 82.9% from 2015 to YTD 2023 compared to 64.5% for the Eurekahedge index (Figure 13).
Figure 13 - FTLS vs. Eurekahedge Long/Short Equity Index (Author created with data from Morningstar and Eurekahedge)
FTLS Vs. HFND
Another product we can compare FTLS against is the Unlimited HFND Multi Strategy Return Tracker ETF ( HFND ). HFND is a multi-strategy hedge fund ETF product launched by fintwit personality Bob Elliott that has garnered some following. From my recent article on HFND:
The HFND ETF aims to replicate the gross returns of the hedge fund industry through a proprietary machine learning ("ML") algorithm that attempts to map the most recent month's returns (return, volatility, correlation with other assets) of various hedge fund styles like long/short equity, global macro, and event-driven, onto an investment universe of ETFs and futures contracts.
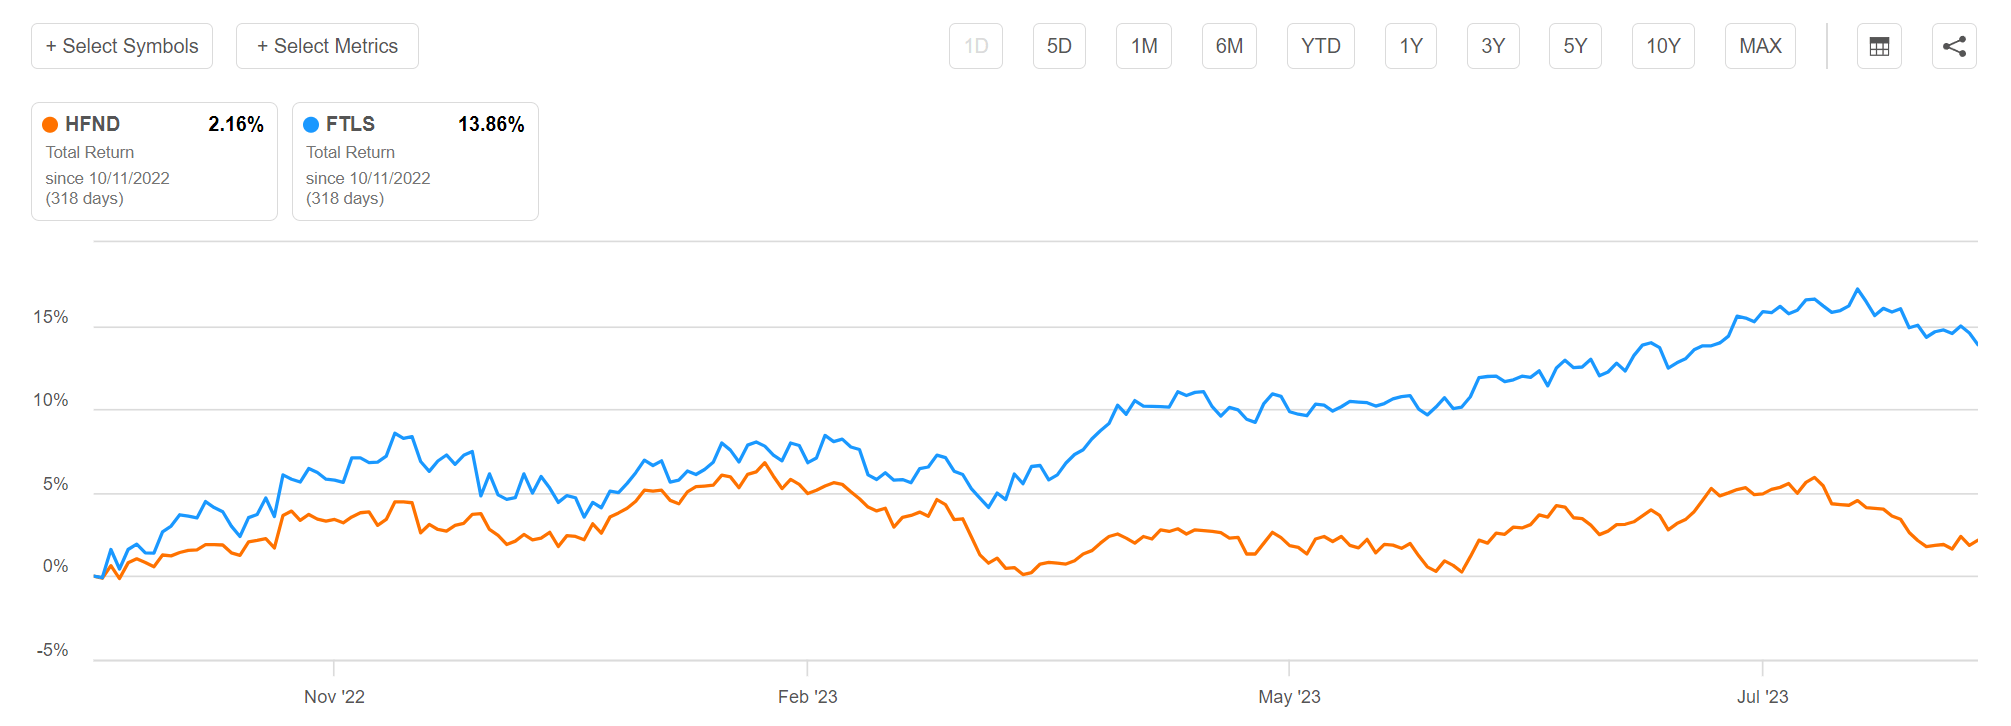
Since HFND is a relatively new ETF, I thought it best we compare the daily total returns of the two ETFs since HFND's inception (Figure 14).
Figure 14 - FTLS vs. HFND (Seeking Alpha)
Since HFND's inception, the HFND ETF has delivered an anemic total return of 2.2% while FTLS has returned 13.9%. Although HFND's expense ratio of 1.03% is lower than FTLS's 1.41%, I currently see no reason why investors should prefer the underperforming HFND ETF over the long-term solid performance history of FTLS.
Conclusion
The First Trust Long/Short Equity ETF is a solid hedge fund-like product that uses earnings quality to select stocks to go long and short. For investors concerned about volatility and reduced downside capture, I believe the FTLS ETF could be a good choice as the fund has delivered long-term performance that has outperformed the Eurekahedge Long/Short Equity Index at a fraction of the typical 2 and 20 expense structure charged by hedge funds. I rate the FTLS ETF a buy .
For further details see:
FTLS: Better Returns Than Expensive Hedge Funds