PACWP - Gator Capital Management Q2 2023 Investor Letter
2023-08-12 09:30:00 ET
Summary
- Gator Capital Management is an investment manager specializing in managing non-diversified, concentrated portfolios stocks. Our goal is to create wealth for our clients by outperforming the market benchmarks.
- Gator Financial Partners outperformed the broader market and the Financials sector benchmark in Q2 2023.
- Regional banks had a tough quarter in Q2, but Gator Financial Partners still sees opportunities in the sector.
- The Fund provides examples of long and short positions in regional banks, highlighting the differences in interest rate positioning.
Dear Gator Financial Partners:
We are pleased to provide you with Gator Financial Partners, LLC’s (the “Fund” or “GFP”) 2023 2 nd Quarter investor letter. This letter reviews the Fund’s 2023 Q2 investment performance, updates our thoughts about the opportunities we see in regional banks, and shows examples of opportunities on both the long and short side by profiling our investment theses on Old Second Bancorp ( OSBC , long) and Hingham Institution for Savings ( HIFS , short).
Review of 2023 Q2 Performance
During the 2 nd quarter of 2023, the Fund outperformed both the broader market and the Financials sector benchmark. Our long positions in First Citizens Bancshares ( FCNCA ), Arlington Investment ( AAIC ), Sallie Mae, Anywhere Real Estate ( HOUS ), and Northeast Bank ( NBN ) were top contributors to the Fund’s performance. The largest detractors were long positions in Jackson National and PacWest Bancorp ( PACW ) and short positions in Opendoor Technologies ( OPEN ), Vornado Realty ( VNO ), and Empire State Realty ( ESRT ).
| 2023 Q2 |
| 2023 YTD |
| Total Return Since Inception 1 |
| Annualized Return Since Inception 1 |
| Gator Financial Partners, LLC 2 |
| 13.00% |
| 14.94% |
| 1,318.06% |
| 19.34% |
| S&P 500 Total Return Index 3 |
| 8.74% |
| 16.89% |
| 370.58% |
| 10.88% |
| S&P 1500 Financials Index 3 |
| 4.78% |
| -1.43% |
| 188.20% |
| 7.31% |
| Source: Gator Capital Management & Bloomberg |
| 1 The Fund’s inception date was July 1, 2008. 2 Performance presented assumes reinvestment of dividends, is net of fees, brokerage and other commissions, and other expenses an investor in the Fund would have paid. Past performance is not indicative of future results. Please see General Disclaimer on page 7. 3 Performance presented assumes reinvestment of dividends. No fees or other expenses have been deducted. |
Update on Regional Banks
While non-bank financials recovered from their March losses, regional banks had another tough quarter in Q2. The S&P Composite 1500 Regional Banks Index was down another 7.12% compared to the broader S&P Supercomposite Financials Index which was up 4.78%. For the 1st half of 2023, the regional bank index was down 30.80% versus the Financials sector index only down 1.43%. I still believe there is opportunity in regional banks, but not every bank has the same potential.
We are at the stage of the crisis where stock market investors have not greatly differentiated between regional banks based on their prospects. It seems like every regional bank is down 20% to 30% on the year, trades at 6x earnings, and around tangible book value. While there is some marginal differentiation, we believe there should be more based on the differences in interest rate positioning and credit risk among different regional banks.
We believe there are two reasons for this lack of differentiation between regional banks. First, exchange traded funds (“ETFs”) are a more efficient way for investors with broad positive or negative views of the regional bank sector to gain exposure. Second, ETFs are more liquid and have lower transaction costs than buying a basket of regional banks. When investors buy or sell an ETF, they are buying or selling a piece of every bank in the ETF and are not differentiating among them.
A second reason there has not been much differentiation among banks is turmoil among professional investors who invest in regional banks. Several types of professional investors are contributing to this turmoil:
- a) generalist investors are reducing exposure to banks across the board due to uncertainty,
- b) financial sector specialist funds are suffering outflows due to poor recent performance, and
- c) financial sector-focused managers at multi-strategy funds (“pod shops”) have reduced exposures and/or have liquidated for risk management purposes.
These investors are selling down positions in banks even if banks are well positioned from an interest rate and credit perspective. In a sense, they have each become forced sellers. Also, these three types of investors are the market participants who would normally do the detailed analysis to make investment decisions based on the differentiation between different regional banks. But, as forced sellers, they are selling across their bank holdings without regard for underlying fundamentals.
This is a unique time where the opportunity set of news and change within regional banks stocks is higher than ever, but the participants have less capital to take advantage of the opportunities.
Long OSBC vs. Short HIFS
Above, we made the case that we see opportunities on both the long and short side of banks based on the bank’s interest rate positioning. We present the case of a long position in Old Second Bancorp versus a short position in Hingham Institute for Savings. Both banks trade at similar valuations, but they are opposites as far as interest rate positioning.
Old Second Bancorp is a commercial bank in the far western suburbs of Chicago. Old Second is valued at 1.4x tangible book value. Old Second is well positioned for the current high short-term interest rate environment. In 2021, Old Second acquired West Suburban, which was focused on suburban markets between Old Second’s branches and downtown Chicago. West Suburban had great branch locations in DuPage County that the former CEO had purchased in the 1950s and 60s. These branches create a very strong core deposit franchise with long-term customers. Over the past six quarters, Old Second’s net interest yield spread has risen from 2.77% to 4.17% as earning yields on loans and securities have risen and the deposit franchise remains stable with funding at relatively low rates.
We can see the increase in net yield at Old Second in the graph below. The light green line at the bottom of the chart shows the cost of deposits low and rising gradually. Rising asset yields have outpaced rising deposit costs until the most recent quarter. The dark green line is the net yield which has risen. Admittedly, the net yield will not expand from current levels, but continued asset repricing should offset further increases in deposit costs.
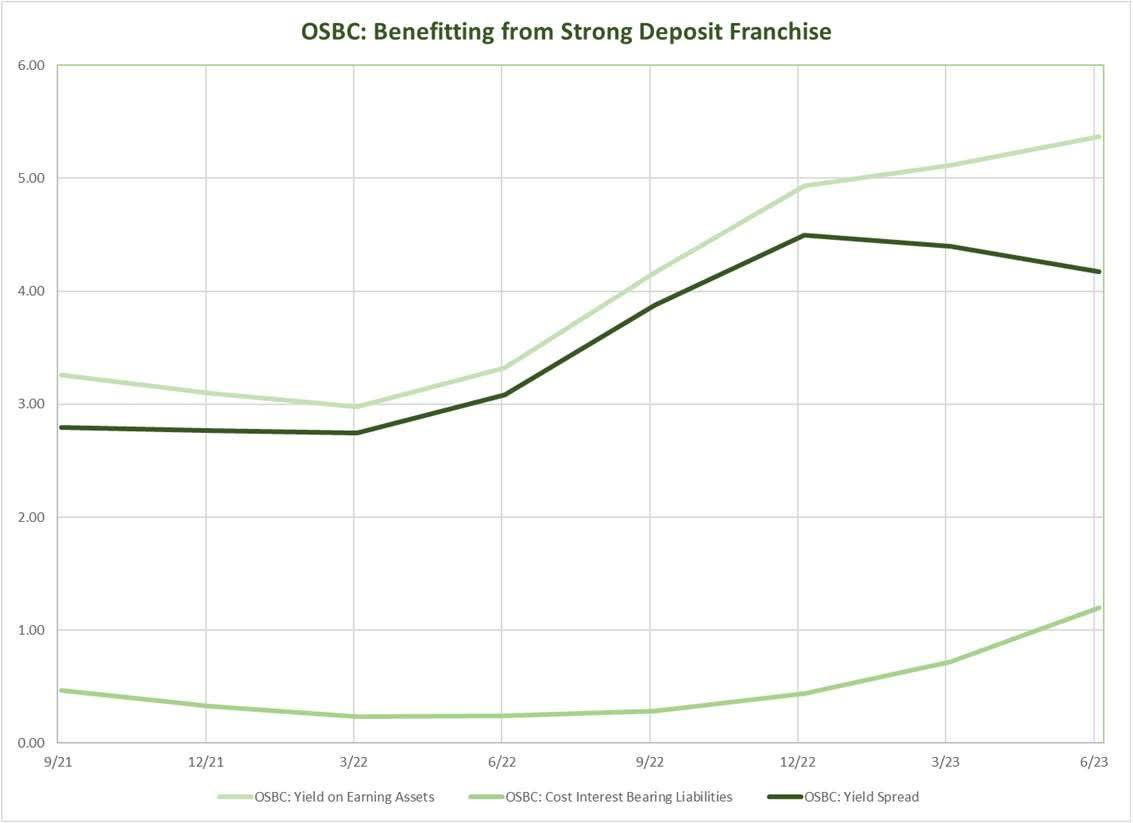
Hingham Institute for Savings is a former savings and loan based in the South Shore in Massachusetts. Hingham’s stock trades at 1.2x tangible book value. Most of Hingham’s loans are fixed-rate apartment building loans. Unfortunately, these apartment owners do not have much deposit business to bring to the bank, so Hingham’s deposit base is very interest rate sensitive. Over the past six quarters, Hingham’s net interest yield spread has declined from 3.39% to 0.66%. We expect further declines in Hingham’s margin over the next few quarters and believe the bank could possibly have negative net interest income late this year or early next year.
In the chart below, we see the dual problem. Higham’s earning asset yields are not rising quickly due to the largely fixed-rate nature of its loan portfolio. And, the deposit franchise has shown its weakness with a rapidly rising cost of funds.
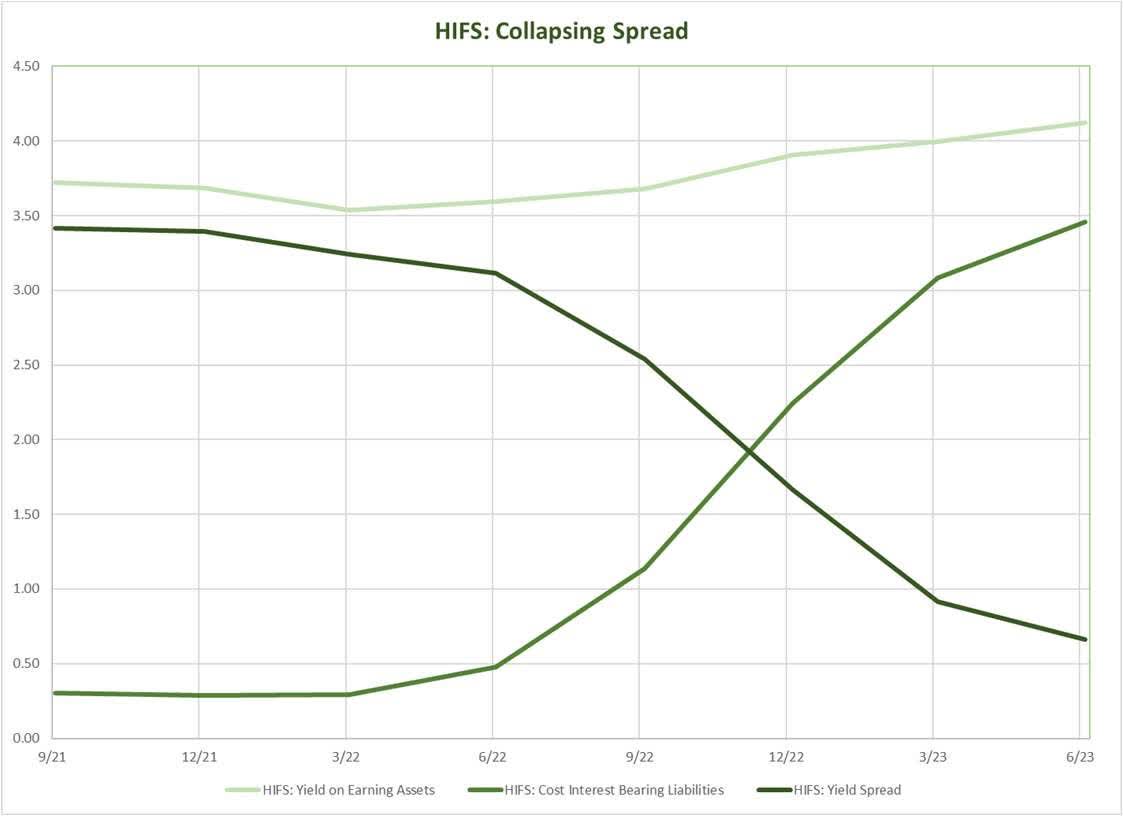
There are explanations for why these banks trade at similar valuations despite vastly different outlooks. Old Second had a minor hiccup with some of the loans they acquired in the West Suburban acquisition. We have gone through the loans with management and believe these are ring-fenced and reflect the more conservative credit culture at Old Second vs. West Suburban. A second possible reason for the lack of differentiation between the banks is that Hingham does not have sell-side coverage from the brokerage community.
The lack of coverage makes sense because the high-dollar stock price limits trading commissions and Hingham is not an acquirer of other banks, so they generate minimal investment banking fees. A third possible reason is the difference in the track records of the two banks. Old Second had a tougher time getting through the Great Financial Crisis than did Hingham. Old Second had to work through credit issues in its commercial real estate portfolio, and Hingham sailed through that period without serious issues in its apartment loan portfolio.
We believe these possible explanations for the lack of differentiation are overwhelmed by the outlook for these banks’ net interest margin in the coming quarters. We can see upside for Old Second to at least 2x tangible book with high book value growth in the next few years. We believe Hingham should trade at 0.5x tangible book. In a “Higher for Longer” scenario, we see the possibility that Higham’s book value may decline due to negative net income over the next couple of years.
We believe these two banks represent good examples of the opportunity in regional banks on both the long and short side of the Fund’s portfolio.
Portfolio Analysis
Largest Positions
Below are the Fund’s five largest common equity long positions. All data is as of June 30, 2023.
Long
First Citizens Bancshares ( FCNCA )
Genworth Financial ( GNW )
First Bancorp Puerto Rico
OFG Bancorp ( OFG )
Jackson Financial Inc. ( JXN )
Sub-sector Weightings
Below is a table showing the Fund’s positioning within the Financials sector [1] as of June 30, 2023.
| Long |
| Short |
| Net |
| Alt Asset Managers |
| 5.26% |
| 0.00% |
| 5.26% |
| Capital Markets |
| 10.25% |
| -3.14% |
| 7.11% |
| Banks (large) |
| 47.08% |
| -10.12% |
| 36.95% |
| Banks (small) |
| 27.58% |
| -14.42% |
| 13.16% |
| P&C Insurance |
| 1.91% |
| 0.00% |
| 1.91% |
| Life Insurance |
| 14.52% |
| 0.00% |
| 14.52% |
| Non-bank Lenders |
| 8.91% |
| -0.59% |
| 8.32% |
| Processors |
| 0.00% |
| 0.00% |
| 0.00% |
| Real Estate |
| 12.54% |
| -17.77% |
| -5.23% |
| Exchanges |
| 0.00% |
| 0.00% |
| 0.00% |
| Index Hedges |
| 0.00% |
| 0.00% |
| 0.00% |
| Non-Financials |
| 0.00% |
| 0.00% |
| 0.00% |
| Total |
| 128.05% |
| -46.04% |
| 82.00% |
The Fund’s gross exposure is 197.0%, and its net exposure is 82.0%. From this table, we exclude fixed income instruments such as preferred stock. Preferred stock positions account for an additional 20.8% of the portfolio.
Conclusion
Thank you for entrusting us with a portion of your wealth. We are grateful for you, our investors, who believe and trust in our strategy. On a personal level, Derek Pilecki, the Fund's Portfolio Manager, continues to have more than 80% of his liquid net worth invested in the Fund.
On June 30 th , we celebrated the 15th anniversary of Gator Financial Partners. We are thankful for our partners. We know the expected lifespan of a small hedge fund is not long, so we’re proud to have made this far. We’re looking to forward to making everyone money over the next 15 years.
Derek has begun splitting his time between New York and Tampa. We have rented an apartment near Grand Central Terminal and are looking for a small office. If you know of any other funds looking to sublease office space, please let us know.
As always, we welcome the opportunity to speak with you and discuss the Fund.
Sincerely,
Gator Capital Management, LLC
Footnotes[1] “Financials sector” is defined as companies included in the Global Industry Classification System (“GICS”) sectors 40 and 60, which contains financial and real estate companies. Gator Capital Management, LLC prepared this letter. Ultimus LeverPoint Fund Solutions, LLC, our administrator, is responsible for the distribution of this information and not its content. General DisclaimerBy accepting this investment letter, you agree that you will not divulge any information contained herein to any other party. This letter and its contents are confidential and proprietary information of the Fund, and any reproduction of this information, in whole or in part, without the prior written consent of the Fund is prohibited. The information contained in this letter reflects the opinions and projections of Gator Capital Management, LLC (the "General Partner") and its affiliates as of the date of publication, which are subject to change without notice at any time subsequent to the date of issue. All information provided is for informational purposes only and should not be deemed as investment advice or a recommendation to purchase or sell any specific security. All performance results are based on the net asset value of the Fund. Net performance results are presented net of management fees, brokerage commissions, administrative expenses, and accrued performance allocation, as indicated, and include the reinvestment of all dividends, interest, and capital gains. The performance results represent Fund-level returns and are not an estimate of any specific investor's actual performance, which may be materially different from such performance depending on numerous factors. The market indices appearing in this letter have been selected for purposes of comparing the performance of an investment in the Fund with certain well-known equity benchmarks. The statistical data regarding the indices has been obtained from Bloomberg and the returns are calculated assuming all dividends are reinvested. The indices are not subject to any of the fees or expenses to which the funds are subject and may involve significantly less risk than the Fund. The Fund is not restricted to investing in those securities which comprise these indices, its performance may or may not correlate to these indices, and it should not be considered a proxy for these indices. The S&P 500 Total Return Index is a market cap weighted index of 500 widely held stocks often used as a proxy for the overall U.S. equity market. The S&P 1500 Financials Index is a market cap weighted index of financial stocks within the S&P 1500 Super Composite Index we used as a proxy for the Financials sector of the U.S. equity market. An investment cannot be made directly in either index. The Fund consists of securities which vary significantly from those in the benchmark indices listed above. Accordingly, comparing results shown to those of such indices may be of limited use. Statements herein that reflect projections or expectations of future financial or economic performance of the Fund are forward-looking statements. Such "forward-looking" statements are based on various assumptions, which assumptions may not prove to be correct. Accordingly, there can be no assurance that such assumptions and statements will accurately predict future events or the Fund's actual performance. No representation or warranty can be given that the estimates, opinions, or assumptions made herein will prove to be accurate. Any projections and forward-looking statements included herein should be considered speculative and are qualified in their entirety by the information and risks disclosed in the Fund's Private Placement Memorandum. Actual results for any period may or may not approximate such forward-looking statements. You are advised to consult with your own independent tax and business advisors concerning the validity and reasonableness of any factual, accounting and tax assumptions. No representations or warranties whatsoever are made by the Fund, the General Partner, or any other person or entity as to the future profitability of the Fund or the results of making an investment in the Fund. Past performance is not a guarantee of future results. The funds described herein are unregistered private investment funds commonly called "hedge funds" (each, a "Private Fund"). Private Funds, depending upon their investment objectives and strategies, may invest and trade in a variety of different markets, strategies and instruments (including securities, nonsecurities and derivatives) and are NOT subject to the same regulatory requirements as mutual funds, including requirements to provide certain periodic and standardized pricing and valuation information to investors. There are substantial risks in investing in a Private Fund (which also are applicable to the underlying Private Funds, if any, in which a Private Fund may invest). Prospective investors should note that:
The above summary is not a complete list of the risks, tax considerations and other important disclosures involved in investing in a Private Fund and is subject to the more complete disclosures in such Private Fund's offering documents, which must be reviewed carefully prior to making an investment. Oakpoint Solutions, LLC, member FINRA, SIPC |
Editor's Note: The summary bullets for this article were chosen by Seeking Alpha editors.
For further details see:
Gator Capital Management Q2 2023 Investor Letter