AGI:CC - GDXJ: The Day Has Come To Own Junior Gold Miners
2023-03-22 11:58:15 ET
Summary
- GDXJ's 6-month performance has been outstanding, and could be the start of a big run higher in 2023.
- My personal outlook for gold and silver bullion is quite bullish this year. Now may be a great time to add leverage.
- Junior miners have considerably more leverage to gold and silver prices than the majors, with higher production costs and dirt-cheap valuations usually part of the equation.
- Black swan geopolitical events, a recession requiring new central bank money printing, and a lingering bear market for most Wall Street securities are reasons to like gold/silver.
Regular readers know I am quite bullish on gold and silver assets, including bullion and mining investments. You can read my December article on gold here , explaining all the positives supporting the monetary metals this year. After several years of down for the riskier minor miners, holding smaller deposits/resources, producing at higher than industry-average costs, the junior producing names may be setting up for a decent run in 2023.
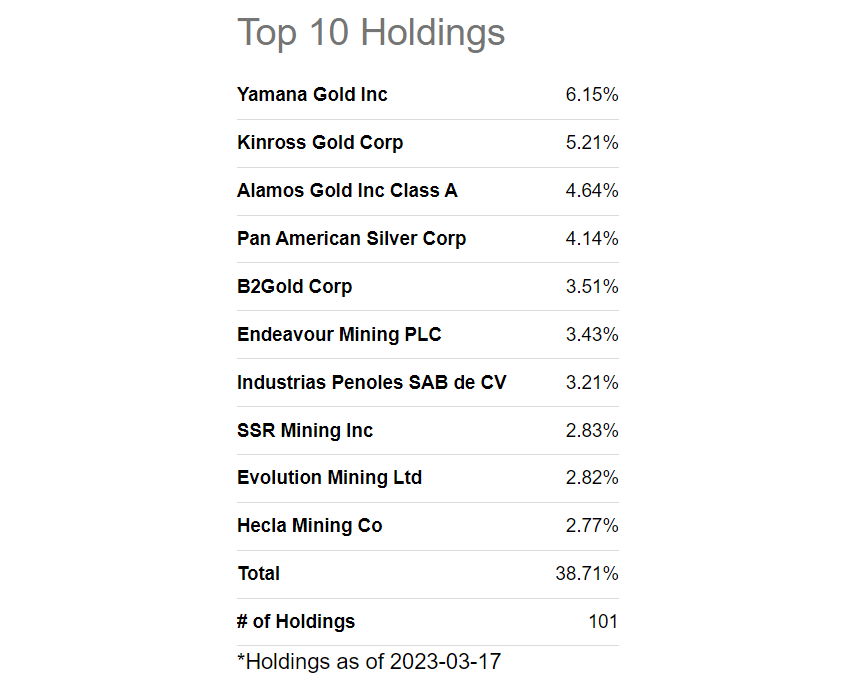
The easiest way to play this sector is through the VanEck Vectors Junior Gold Miners ETF ( GDXJ ). The asset is very liquid for traders/investors with nearly $4 billion in market cap currently. It has a fair management expense of 0.52% annually, pays a 0.5% cash dividend yield, and is quite diversified with 101 positions as of March 17th.
The top 10 holdings by size include Yamana Gold ( AUY ), Kinross Gold ( KGC ), Alamos Gold ( AGI ), Pan American Silver ( PAAS ), B2Gold ( BTG ), Endeavour Mining plc ( OTCQX:EDVMF ), Industrias Penoles, S.A.B. de C.V. ( OTCPK:IPOAF ), SSR Mining ( SSRM ), Evolution Mining ( OTCPK:CAHPF ), and Hecla Mining ( HL ).
Seeking Alpha Table - GDXJ, Top 10 Holdings on March 17th, 2023
The biggest negative owning smaller miners is they tend to lag gold/silver bullion prices and the overall equity market over longer periods of time, when sharp precious metals gains are absent. So, timing is everything. My view is improving technical performance, alongside gold hitting a new 52-week high above US$2000 an ounce this week, could be signaling a new bull run is dead ahead.
Bullish Trading Periods
The VanEck Vectors Junior Gold Miners product has only been around since late 2009. It’s trading history is limited to less than 14 years. I thought I would highlight some of the extra-bullish spans for readers to review and consider for possible future gains.
2010
Not long after its creation, 2010 proved a strong year for gold as it rose around +26% in price, using the SPDR Gold Shares ETF ( GLD ), on money printing after the Great Recession and lingering fears over record federal deficit spending under President Obama . It was a gangbuster year for silver, up better than +60%, looking at the iShares Silver Trust ETF ( SLV ). Fortunately, many smaller “gold” juniors also mine a decent amount of silver. So, GDJX was able to widely outperform its bigger brother VanEck Gold Miners ETF ( GDX ) by roughly 35%! The regular GDX play is focused on major global gold miners, and is the largest, diversified precious metals mining fund product in the world, with assets under management at $13 billion. Lastly, GDXJ bested the popular SPDR S&P 500 ETF ( SPY ) and overall U.S. equity market by 50% in 2010!
YCharts - GDXJ, GDX, GLD, SLV, SPY - Price Change, Nov 2009 to Dec 2010
2016
Perhaps the best year to own GDXJ was 2016. After years of underperformance and significant losses, nobody believed gold assets would ever rise again. Of course, contrarian thinkers and risk weighters who understood the precious metals price cycle were rewarded handsomely. Measured from October 2015 to August 2016, GDXJ rose a whopping +161%, beating the main GDX fund by almost 40%, while outperforming gold and silver bullion by 130%! In comparison, the S&P 500 rose a modest +14% in price over this span.
YCharts - GDXJ, GDX, GLD, SLV, SPY - Price Change, Oct 2015 to Aug 2016
2020
The wildest year for swings in price was the pandemic year of 2020. As the economy shut down, and before emergency money printing (Unlimited QE) by the Federal Reserve was released, gold/silver were liquidated like every other easy to sell asset at the time. Losses of greater than -30% for gold and -50% for silver on the calendar year emerged into March. However, the rebound in monetary metals happened swiftly once government deficit spending, free business loans/handouts, and a record increase in base money aggregates developed in April-May.
Measured from early February to August 2020, GDXJ and GDX both achieved gains beyond +40%, almost as strong as silver bullion’s +55% jump. Gold lagged a bit at +24%, while U.S. stocks overall rose about +10% over the same span.
YCharts - GDXJ, GDX, GLD, SLV, SPY - Price Change, February to August 2020
Technical Chart Pattern
The good news for junior gold miner shareholders is the last six months have witnessed real outperformance of the S&P 500 again, after a steady decline for the industry from September 2020. The average investor and Wall Street analyst alike do not have much interest in precious metals. One way to verify this fact is by looking at the absence of readers and stories recommending precious metals today vs. the middle of 2020 on Seeking Alpha.
The +24% gain in GDXJ over six months is drawn below. Current Top 10 holding and SPY, S&P 500 performance are listed for comparison. Only one of the Top 10, SSR Mining, has underperformed the broader U.S. equity market.
YCharts - GDXJ, Top 10 Holdings vs. S&P 500 Price Change, 6 Months
On the daily chart sorts I run and research, the 20-day Money Flow Index momentum indicator reached its lowest oversold reading in February (circled in green) since November 2018, which proved to be a terrific time to buy GDXJ. The ultra-low MFI nailed the price bottom within days back then, and a +65% GDXJ rise from that point into August 2019 was next.
Other positives include price trying to turn both its 50-day and 200-day moving averages higher in late March. Plus, the Accumulation/Distribution Line and 20-day Chaikin Money Flow indicator are acting the best in unison over many years. My basic read of the underlying technicals is quite constructive presently. All that may be needed for a strong GDXJ share price rise is a breakout in gold above US$2000 in coming weeks, to drum up some interest by new investors.
StockCharts.com - GDXJ, 2 Years of Daily Price & Volume Changes, Author Reference Point
Final Thoughts
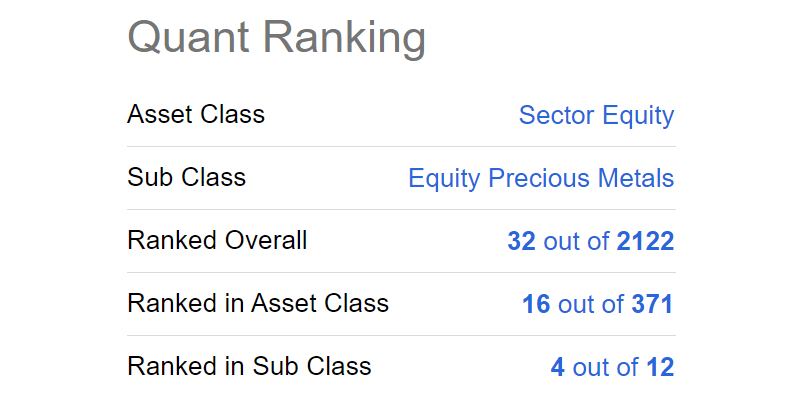
The price strength for GDXJ has not gone completely unnoticed. Seeking Alpha’s computer-rated Quant Ranking vs. a universe of 2122 ETFs is in a Top 2% position today. The latest six months of positive performance could be an initial indication of better days to come.
Seeking Alpha Table - GDXJ, Quant Ranking on March 21st, 2023
What are the risks? The clear excuse for lower GDJX prices would be a material drop in gold/silver quotes over the rest of the year. While not impossible, the odds of such a scenario may not be that great, in my view (trading precious metals successfully since 1986).
I discussed early in March here , the high number of geopolitical “black swans” that could appear in 2023, shaking up the markets and confidence in the economic outlook. Gold/silver have been the traditional flight-to-safety asset over time. We just experienced the sharply higher reaction in monetary metals this month to bank runs at a few institutions, potentially spreading elsewhere in the tightly-woven, western world’s financial system.
Many market pundits are also worried gold/silver cannot rise when interest rates are high and moving higher. While this is generally true, my view is the Federal Reserve’s tightening cycle is pretty much over with the bank-run fiasco of last week. Commodity inflation has cooled dramatically, meaning the Fed now has the green light to stop interest rate increases, with a view toward when to “ease” the new debate on Wall Street. If more evidence of an economic contraction, far weaker-than-expected corporate profits, and eventually a spike in unemployment appears, another massive money printing and rate slashing regime could take over soon.
Assuming an unexpectedly weak economy by the summer causes debt default fears in the wider economy for businesses, consumers, and even Uncle Sam (remember the debt ceiling fight between Democrats and Republicans is right around the corner) might even require trillions in new QE effort by the Fed. Wall Street analysts could quickly reverse their concerns about rising inflation in favor of real worries about the economy, demanding the Fed turn on the printing presses. If this is our future, gold and silver could have a spectacular 2023 and possibly 2024, on dollar devaluations from a rapid Fed “pivot” in central banking policy. Don’t say it cannot or will not happen. Financial crises typically sneak up on the market, and then explode on the scene like a good horror movie.
Anyway, I have a long-term valuation model for gold today approaching US$3000 an ounce, which I have discussed in detail in other articles. Relative to the M1 or M2 money stock, total Treasury debt obligations, total U.S. stock market value, and movements in other commodities, gold should be priced/valued closer to my target (using 60 years of trading history), not the sub-$2000 number in March 2023. Then, contemplate half of the time gold has traded ABOVE my median “fair value” calculation historically.
For outlier optimism, if gold is going to $4000 or $5000 an ounce in a severe economic recession over a couple of years, owning the smallest precious metals miners with dramatically higher leverage to bullion changes may not be the worst place for your capital. The "rerating" of these less-followed miners currently breaking even to losing money on an operating basis in early 2023 could be a truly bullish event over the next 12-24 months. Believe it not, the top 10 holdings in GDXJ may be able to report an exponential rise in earnings with $3000 gold and $50 silver, as a possible reality soon. I am figuring forward P/Es under 5x for most of the junior miners included in the ETF, when purchasing these names now and waiting for better days in the sector. All told, projecting a double or triple for price potential in GDXJ on a spike in gold/silver is not rocket science.
Thanks for reading. Please consider this article a first step in your due diligence process. Consulting with a registered and experienced investment advisor is recommended before making any trade.
For further details see:
GDXJ: The Day Has Come To Own Junior Gold Miners