SPVM - Global ETF Market Facts: 3 Things To Know From Q1 2024
2024-04-25 09:55:00 ET
Summary
- Assets in U.S.-listed exchange traded funds have grown over the last five years, but ETFs still represent a small fraction of overall U.S. financial markets.
- ETFs represented 9.3% of equity assets in Europe and 1.8% of fixed income assets in Europe in Q1 2024.
- ETFs represented 5% of equity assets in Asia-Pacific and 0.5% of fixed income assets in Q1 2024.
By Samara Cohen
Three things to know from U.S. ETF markets in Q1 2024
- Assets in U.S.-listed exchange traded funds (ETFs) have grown over the last five years, but ETFs still represent a small fraction of overall U.S. financial markets, particularly in fixed income, where ETFs represent less than 2.8% of outstanding debt. 1
- U.S.-listed ETF volumes increased from the prior quarter and 2023, led by an increase in equity ETF trading, while ETFs as a percentage of total equity volumes slightly dipped to 28.1% due to elevated single stock equity trading. 2
- Individual investors in the U.S. continued to participate in the ETF market, with individual investors’ trading volumes in ETFs and ETF options remaining in line with Q4 2023, while individual investor ETFs assets reached nearly $1.4 trillion and 19% of all U.S.-listed ETF assets, the most on record. 3
U.S.-Listed ETF Market Size
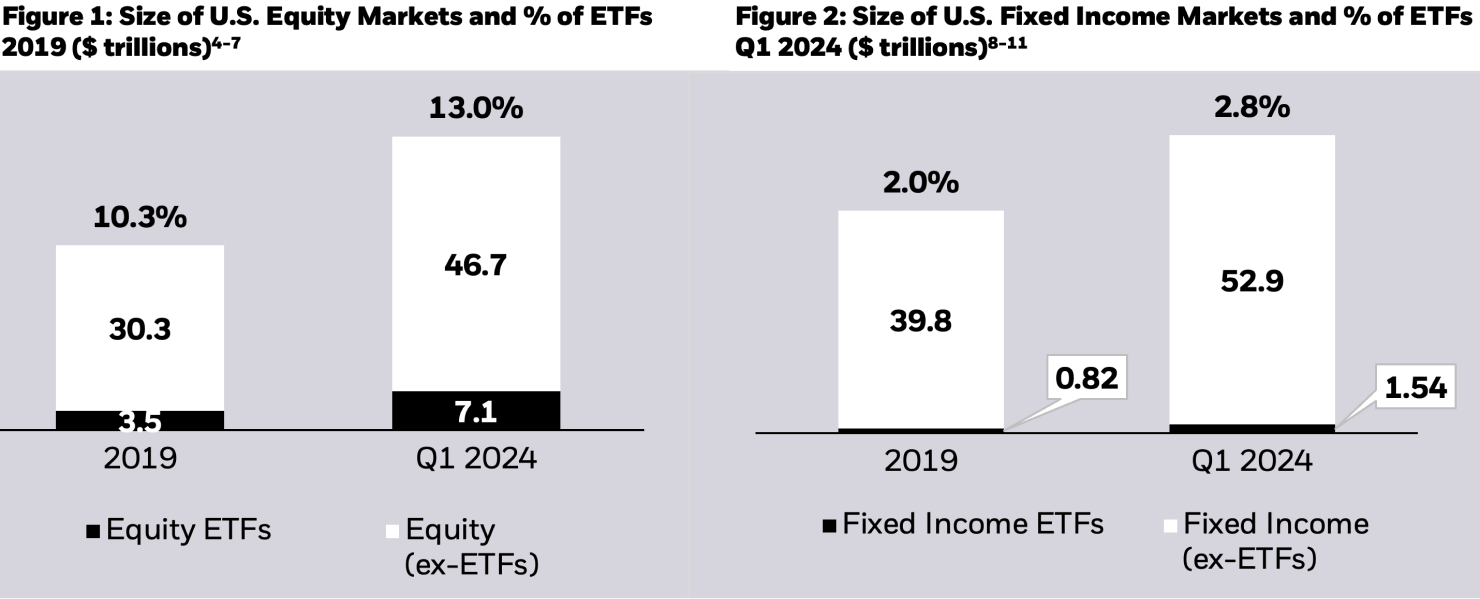
As of Q1 2024, ETFs represent 13% of equity and 2.8% of fixed income assets in the U.S. (compared to 10.3% of equities and 2% of fixed income in 2019). Despite U.S. ETF assets nearly doubling from 2019 to the end of Q1 2024, ETFs are still just a fraction of financial markets ( Figures 1 and 2 ).
Chart description: Stacked column charts showing the size of equity and fixed income ETF assets under management in comparison to the total equity market capitalization and total debt outstanding in the U.S. This chart shows that while ETFs represent a large dollar amount of assets, that amount is still small in comparison to both the equity and fixed income markets.
U.S.-Lited ETF Trading Volumes
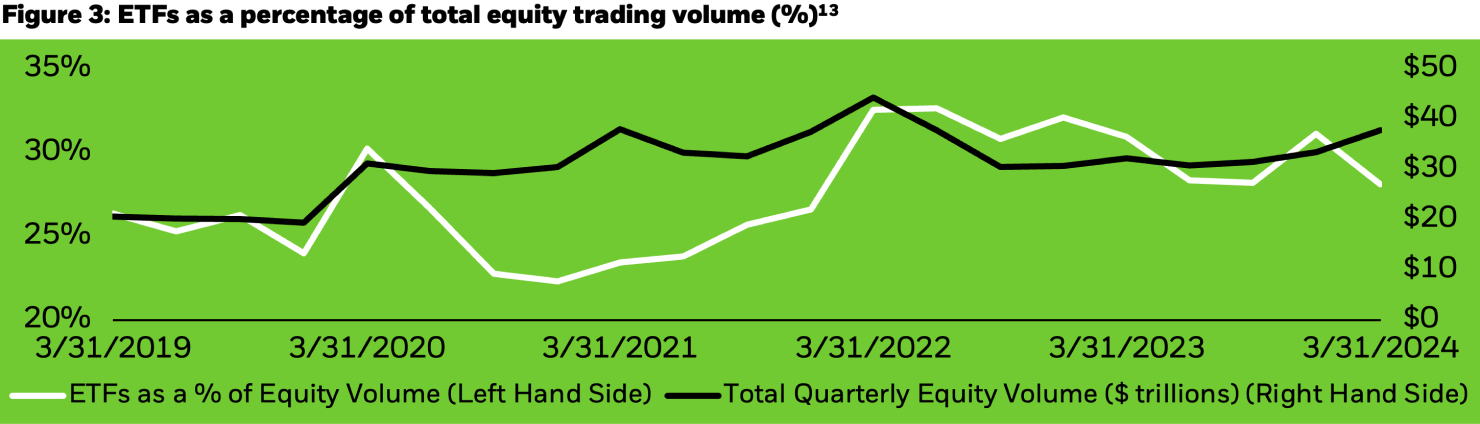
In the first quarter of 2024, trading volumes for the U.S. equity market (including single stocks, ETFs, and depository receipts) and U.S. ETFs were $37.9 trillion and $10.6 trillion, respectively. This means that U.S. ETFs accounted for 28.1% of the total U.S. composite volume in the secondary market over the quarter. This was slightly lower than in Q4 2023 due to higher single stock equity volumes, likely driven by more micro-driven trading, as certain equity and bond correlations fell during the first quarter ( Figure 3 ). 12
Chart description: Line chart showing total quarterly equity volumes and ETF trading as a percentage of overall equity market trading volumes in the U.S. Equity volumes includes stock and ETF volumes. This chart shows that ETF trading volume as a percentage of the total equity trading volume has remained elevated and over 25% since the beginning of 2022.
Most U.S.-listed ETF Trading Activity Occurs In The Secondary Market
Most ETF trading activity occurs in the secondary market, where ETF shares change hands between buyers and sellers. When demand cannot be met in the secondary market, large institutions (known as “authorized participants”) can transact with ETF issuers to create or redeem ETF shares in a separate, “primary” market....
Global ETF Market Facts: 3 Things To Know From Q1 2024