VYM - Global X SuperDividend ETF: Risky
2023-12-11 06:40:04 ET
Summary
- Interest rates in the U.S. may have already reached their peak and the expectation for a rate cut in 2024 has increased, giving the Global X SuperDividend ETF a temporary reprieve.
- Its double-digit dividend yields and diversity of country and sector exposure are certainly good attributes in uncertain times.
- It is important to consider both income generation and capital gains when evaluating a dividend ETF like SDIV.
- While yields have increased, these have been largely offset by the downside seen in the value of the ETF.
- Going forward, country exposure should be detrimental to its share price.
After interest rates peaked at 5.5% after aggressive monetary policy tightening undertaken by the Federal Reserve since March 2022 and with neutral instances adopted during the last two FOMC meetings, expectations for a rate cut in 2024 have gone up . In these circumstances, the Global X SuperDividend ETF ( SDIV ) with its relatively large exposure to U.S equities could benefit. In addition, given some uncertainty about a soft landing for the American economy in 2024, SDIV's diversification to the rest of the world appears tempting, especially since it trades at only $21.64 after the 12.7% one-year drop. Moreover, the recent price action shows an upside that could continue.
However, when looking for a dividend ETF, in addition to checking whether the distributions made to shareholders have increased, it is also important to consider capital gains. Consequently, the objective of this thesis is to assess whether SDIV which pays juicy yields of 12.42% on a trailing 12-month basis and charges fees of 0.58% is an appropriate investment.
Exploring SDIV's Dividend Yield
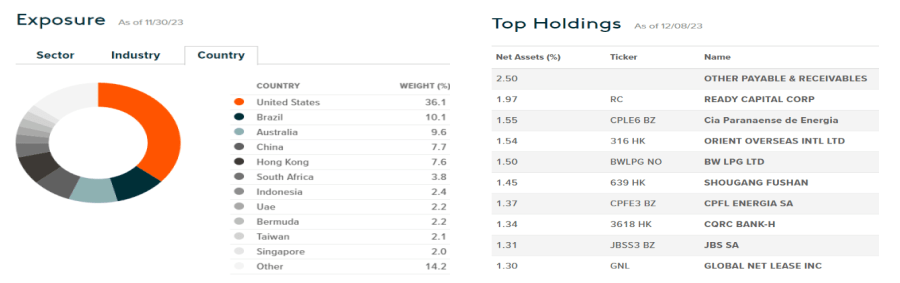
By tracking the Solactive Global SuperDividend Index, SDIV aims to provide exposure to equities from around the world for investors seeking both geographical and interest rate diversification. Thus, the U.S. comprised 36.1% of the assets as of November 30 followed by Brazil and Australia. Now, according to figures by the IMF released on October 10, these countries should continue to see their GDP grow despite slowing global growth in 2024 compared to 2023.
Furthermore, as seen by the ticker names of its top holdings below, many of the stocks comprising SDIV are not listed on American stock exchanges, which goes in the direction of providing exposure to non-correlated equities across the world. Along the same lines, none of its 100 holdings exceed 2.5% of the ETF's total weight which implies lower concentration risks.
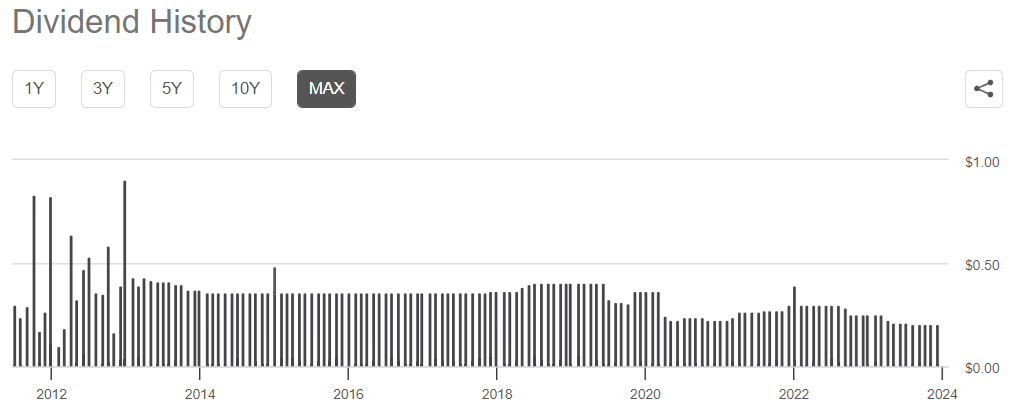
It is through these holdings which are the 100 highest dividend-paying equities around the world, according to Global X that the issuer attains its objective of paying monthly distributions. Now, as shown in the chart below, these have been paid for 12 years running, but the dollar amount has been declining. Thus, from $0.41 in the 2018-2019 period, the latest distributions have dropped to $0.21. This represents a 49% drop which is significant, especially in a period where the cost of living has escalated and for someone who has to rely on the monthly income generated to meet expenses.
Dividends History (seekingalpha.com)
Still, the 30-day SEC yield has gone up to 11.04% from 9% in October 2019, or an increase of 22%. To explain the discrepancy between lower monthly distributions on the one hand and higher yields on the other, a chart of SDIV's price performance from October 2019 to date (as shown below) reveals that it has suffered from a 57% loss in its value, which effectively offsets the increase in yield. In other words, the gain in yield comes at the expense of a sharp downside in the share price.
Examining the Downside and Dividends
Intrigued by such a downside, as the holdings are rebalanced annually plus an additional screening effected every quarter to get rid of companies likely to cut dividends, I performed a comparison with other dividend-paying ETFs as charted below. For this purpose, a typical high-yield ETF like the Vanguard High Dividend Yield ETF ( VYM ) was chosen together with an internationally oriented one in the form of the iShares International Select Dividend ETF ( IDV ).
www.seekingalpha.com
The verdict is that SDIV has not only underperformed share price-wise but also in terms of total returns which by the way includes dividend payments in case these are reinvested.
Now, some may argue that these ETFs neither hold the same stocks nor track the same indices, but the fact remains that most stock markets throughout the world have seen a post-Covid recovery in equities after the initial supply shock created by the pandemic. The recovery was also helped by central banks across the globe rapidly easing monetary policy to stimulate their respective economies. However, SDIV has not recovered, and, after posting a four-year loss of 57%, its current share price of $21.64 is even lower than its Covid-low of $24.30.
I find this degree of capital loss hard to explain given that with 36% of U.S. holdings, the ETF should have fared better since the S&P 500 delivered nearly 57% of gains since October 2019 helped by the resiliency of the economy. Moreover, SDIV's strategy to select the best companies seemed not to have worked as its objective is to remove corporations likely to reduce dividend payments also means selecting the best stocks whose balance sheets are strong enough to permit outflows to shareholders in the first place.
Discussion and Looking forward
More importantly for income seekers, historical performance shows that by narrowly focusing on double-digit yields, one can fail to factor in the broader total return criteria. This includes capital preservation in order not to lose money. In this respect, while VYM only pays trailing yields of 3.12%, it charges just 0.06% but has delivered the best total returns of 39.16% with its passive strategy.
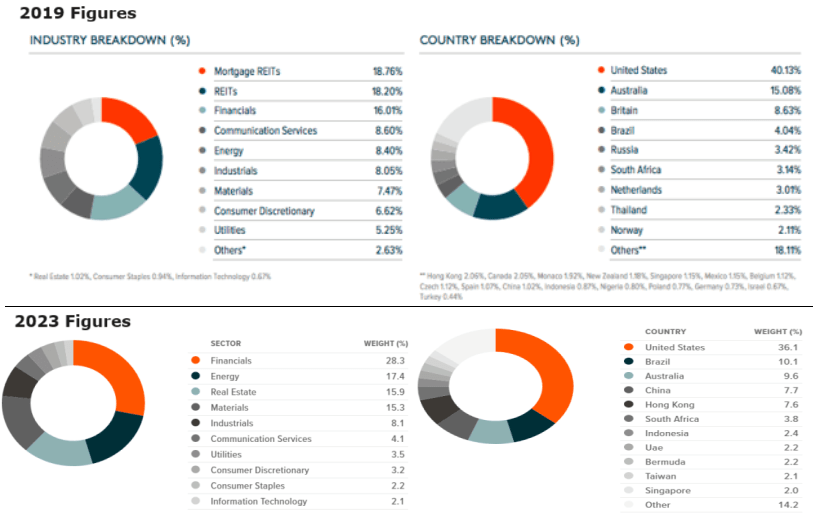
Pursuing further with the intent of assessing SDIV's future performance, I noted that significant changes had been made both in country and sector exposure from 2019 to 2023 as shown below.
First, there has been a decrease in the percentage of assets dedicated to the U.S., Britain, and Australia in favor of Brazil, Hong Kong, and China. Now this 7.7% China exposure may be detrimental as the IMF has downgraded its outlook for the country. At the same time, the 7.6% exposure to Hong Kong equities should weigh down on SDIV's value given the unprecedented slump in the city's $4.6 trillion stock market which has prompted some firms in the financial industry to close their brokerage units there.
Coming back to the recent upside shown in the introductory chart, this was due to the market pricing in rate cuts in 2024 after the Fed adopted a dovish tone. For this purpose, the chart below shows the performance of different S&P 500 sectors like financials, real estate, and energy. Apart from energy, these have delivered upsides since the end of October, coinciding with the FOMC meeting when the Fed opted for a second successive pause.
However, SDIV's pale blue chart has lagged behind others by at least 9%, partly due to its relatively lower U.S. holdings. Another reason is that real estate now constitutes less than 16% of the ETF's total weight compared to 37% in October 2019 (above comparison diagram).
Tellingly, it is precisely real estate that has benefited the most from a dovish Fed, even more than financials where memories of the banking turmoil are taking time to fade. Thus, the S&P 500 Real Estate has climbed by more than 15% in just one month as shown in the deep blue chart above. The reason is that as dividend-paying stocks, REITs compete with both corporate and government bonds for investors' money, and with bond yields on the decline (as a dovish Fed rhythm with lower interest rates), demand for real estate equities is seeing traction.
Therefore, with a relatively lower portion of its assets dedicated to real estate, there is a limited upside potential for SDIV, but, there is worse. With higher exposure to energy stocks at 17% of its total weight compared to 8.4% four years back, the Global X ETF faces downside risks in case the S&P 500 Energy's downward trend is sustained. In this case, the prospects of seeing lower rates have not benefited energy stocks because of unfavorable demand-supply dynamics pressuring the price of oil.
A Gloomy Outlook for SDIV
Well, this scenario could change given the high level of geopolitical risks in the world today which poses a threat to supply, but, it is difficult to predict when exactly this will happen. Also, with an RSI score of 53.3 , which is above 50, SDIV's shares have not yet been oversold meaning the downside could continue. This bearish forecast is also supported by the share price being below both the 100-day and 200-day Simple Moving Averages, and it could drop to the $20.14 support level last reached on October 25, or even below because of country exposure.
In this respect, I already talked about China, where there is rising deflation (the opposite of inflation) due to a deterioration in economic activity and the difficult stock market situation in Hong Kong. Noteworthily, in sharp contrast to Hong Kong, Indian equities have rapidly reached the $4 trillion market valuation, driven by the rapidly growing Indian economy, but, SDIV's country breakdown does not include India.
In conclusion, this thesis has shown that SDIV should derive limited benefits from an easing of monetary policy conditions which is normally beneficial to risk assets like equities, because of its sector exposure. Also, the combined weight of 15.3% dedicated to China and Hong Kong does not augur well for capital preservation. Therefore, after getting an initial jolt from a dovish Fed, the downtrend should continue. Finally, when it comes to income generation objectives, the Global X ETF certainly provides regular monthly income, but, these have seen a downtrend.
For further details see:
Global X SuperDividend ETF: Risky