MORT - High Yield Carnage Begins
2023-03-09 18:03:40 ET
Summary
- Jerome Powell swings a wrecking ball into the markets.
- Even assets that would normally benefit from higher rates are down because of economic risk.
- One of our favorite picks for being terrible did the thing again. Which thing? Dropping 14% in two days.
Get ready for charts, images, and tables because they are better than words. The ratings and outlooks we highlight here come after Scott Kennedy’s weekly updates in the REIT Forum. Your continued feedback is greatly appreciated, so please leave a comment with suggestions.
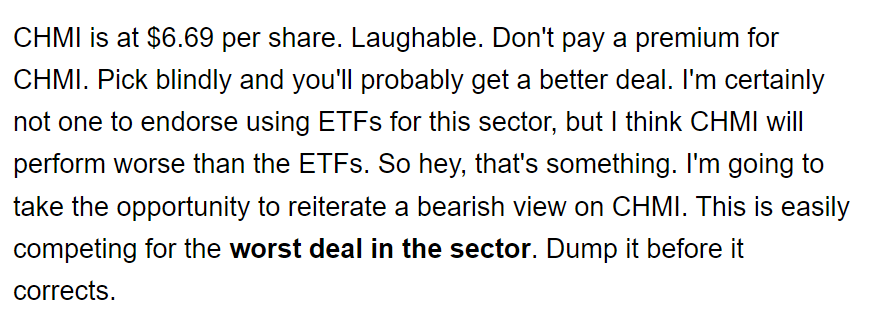
Let’s start with Cherry Hill Mortgage Investment ( CHMI ). It’s been our favorite stock to beat on lately. For instance, in our article from Feb. 22, 2023 we wrote:
Seeking Alpha
I didn’t even have to go back and add that bolding. That’s in the original article. As I type this, shares of CHMI are $5.68. That’s only down $.01, if you ignore the other $1.00.
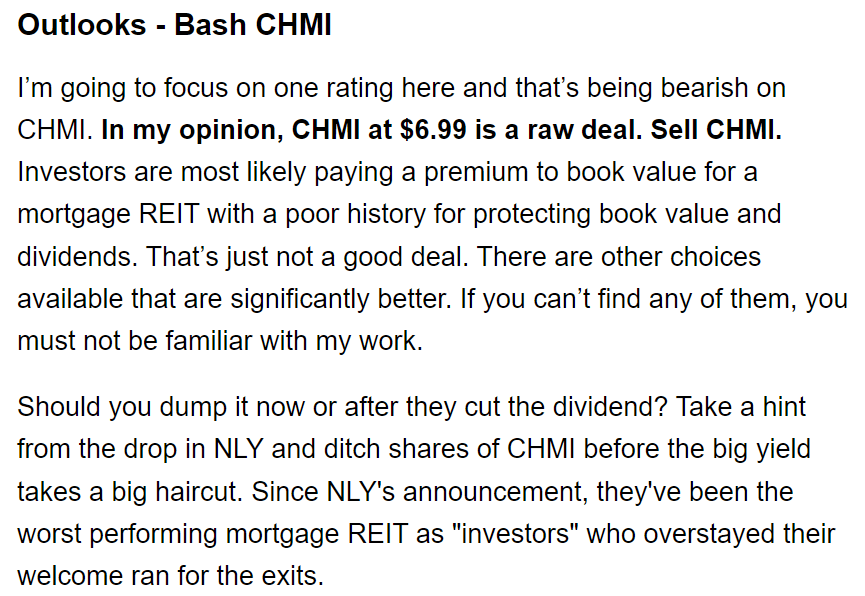
That’s a big drop, but it’s an even bigger drop if we go back to our article from Feb. 13, 2023 when we wrote:
Seeking Alpha
Could I have possibly been any more explicit? Bolding? Stick it in header text just to make it more obvious?
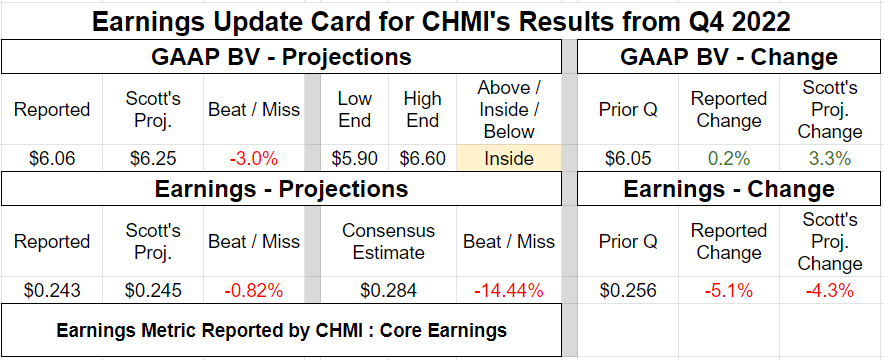
What happened? CHMI reported earnings.
It was a dreadful miss on consensus estimates. A near perfect match for The REIT Forum’s earnings estimates (provided by Scott Kennedy):
Seeking Alpha
Looking at book value, CHMI was a bit worse than we expected. Congratulations CHMI! We projected a poor quarter and you still did worse. The market finally seemed to get part of the memo and dumped some CHMI. Way to live up to your reputation.
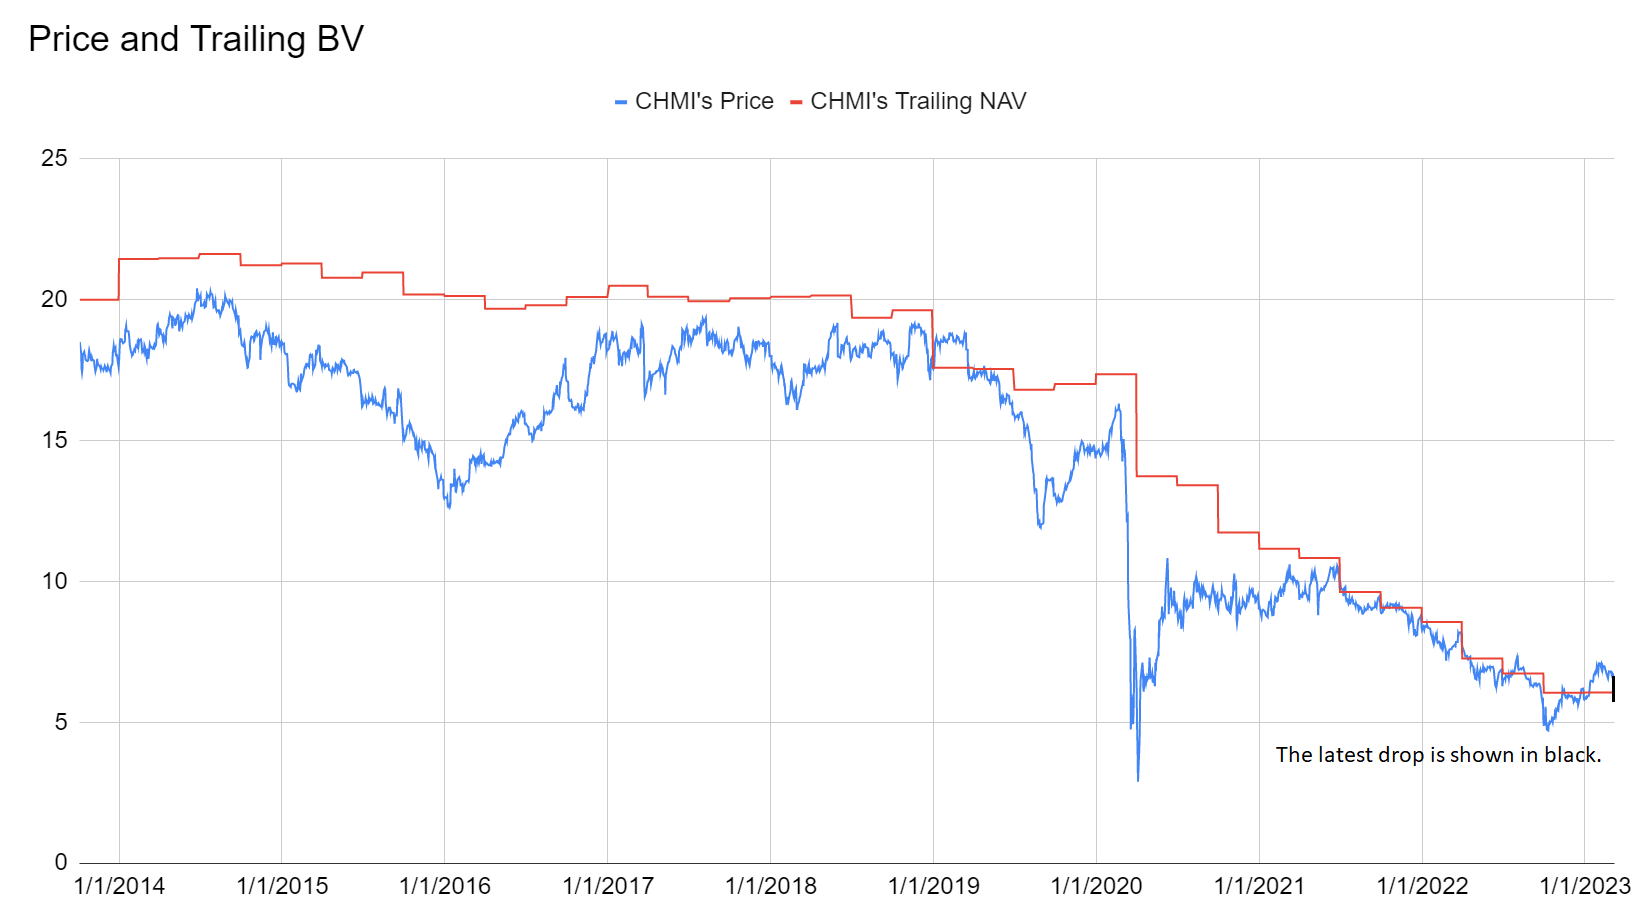
If CHMI gained too much book value, it might break this trend:
The REIT Forum
The latest price wasn’t importing well, so I had to add the drop to the chart. Well done.
Shares fell from $6.60 to $5.68 in only the last two days. It was a quick road down.
That’s enough for CHMI. Time for other topics.
Chairman Powell Taking Down Healthcare
You see the market getting whacked lately? Chairman Powell’s commentary has been interesting. One day he says the Federal Reserve doesn’t consider the interest expense of the federal government. That’s concerning because our massive debt is the biggest threat to our country. Some politicians have floated the idea of the United States creating a sovereign wealth fund . We already have one. The value is roughly negative $31.74 trillion. If we create one to buy equity, does it issue more debt to do it? Sounds dumb. Pay down the debt first. Same rule as running your own house. Pay down your debts first. There’s no 401k matching for the government buying equity. Debts get paid down first.
On the other hand, Chairman Powell called out the huge waste in our healthcare system. That was fun. He explicitly called out that healthcare is 17% to 18% of GDP while other countries can do it at 10%. That’s a trillion dollars per year. Where is this Powell in the other meetings? It’s great to see him fire shots at something other than wages or the stock market.
Fed Chair Powell: The delivery system for U.S. health care is very expensive
Some shareholders in biotech are going to be mad. How dare a man tasked with monetary policy reference areas where deficits could be slashed dramatically? How is it his job to reference that one of the major reasons for persistent inflation is the enormous deficits? What do you expect the man to do next, talk about inflation for 30 minutes?
Obviously, every person knows that it would be impossible to squeeze even a dollar of savings out of our healthcare system (sarcasm alert). The best possible system is requiring every individual to buy insurance without ever knowing exactly what it covers. Nothing helps the market be more efficient like mandatory buyers with severely incomplete information.
How great is our system? When I needed an MRI on my knee, the doctor told me the insurance would require an X-ray first that would be absolutely useless. He’s been doing this for decades. Off I went with the nurse to get the X-ray that he already knew would show nothing. It showed nothing. Then we scheduled the MRI. Not a great system. That’s a true story. How much would the MRI cost? No one knows. Would insurance cover it? No one knows. The employee for the insurance company might tell me, but their answer is not legally binding. Perfect system.
Epic Yield Curve Inversion
The inversion of the yield curve from 2-year Treasuries to 10-year Treasuries is at 96 basis points today. Outstanding.
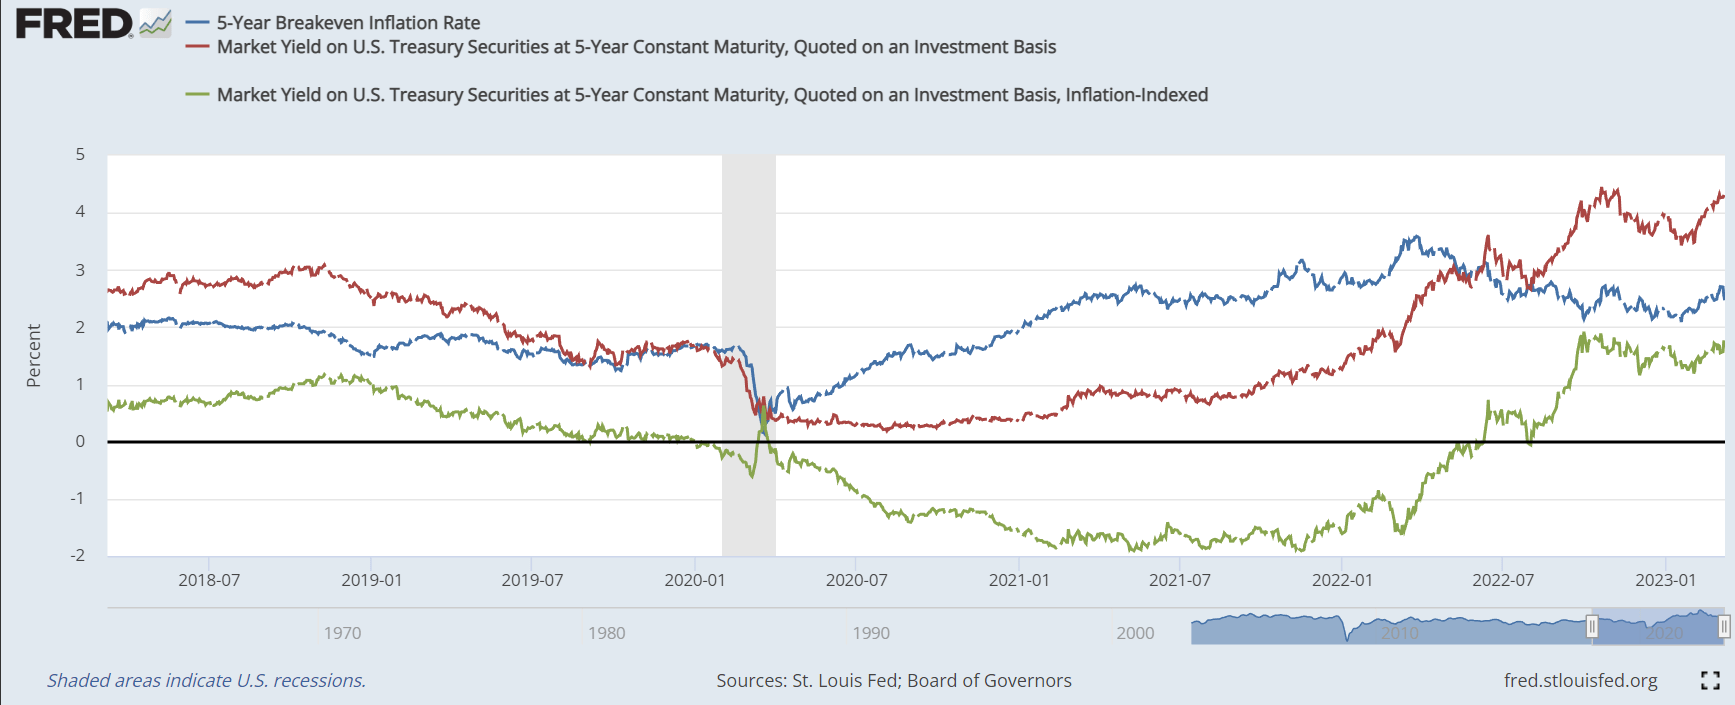
Why are yields going so high? Is it because investors simply “demand” a high real yield? No, that’s stupid. If investors could get something simply by “demanding” it, they wouldn’t have settled for a negative 1.9% yield on the 5-year TIPS back in May 2021:
Federal Reserve
True story: When someone demands something, that doesn’t mean they get it. Kids are supposed to learn that pretty young. Make sure yours know.
So, what happened here if it isn’t simply investors “demanding” a higher yield? It’s the Federal Reserve volunteering to pay out dramatically higher interest rates. The market didn’t “demand” higher rates. The Federal Reserve supplied them. You can see it clearly in the chart.
When the Federal Reserve was ignoring inflation and refusing to hike rates in early 2021, the 5-year breakeven rate was already running over 2.5%. Verify that in the image. That’s what happened. That’s reality.
Today, the 5-year breakeven rate is about 2.47%. That’s still reality. While the 5-year breakeven rate is roughly flat (bumped up to about 3.4% briefly), the 5-year Treasury climbed from under 1% to 4.3%. That enormous gap reflects the market believing Chairman Powell when he states that he intends to pay out an enormous amount of money in extra interest to get inflation under control.
Yeah, that’s the plan. Pay out more interest. Not to all the humans mind you. If your money is stuck in a checking or savings account, you can pound sand. But if you’re a bank, you get paid more money. I’m dealing with it by stashing cash in the iShares Short Treasury Bond ETF ( SHV ). I don’t love a 0.15% expense ratio, but it produces a reasonable monthly dividend so I can pretend to be a bank.
Needless to point out, the dramatic increase in rates is raising the probability of defaults. That's bad for lenders, even those collecting variable rates, because they want to be paid. They usually don't want the collateral.
Stock Table
We will close out the rest of the article with the tables and charts we provide for readers to help them track the sector for both common shares and preferred shares.
We’re including a quick table for the common shares that will be shown in our tables:
| Type of REIT or BDC |
| Residential Agency |
| Residential Hybrid |
| Residential Originator and Servicer |
| Commercial |
| BDC |
If you’re looking for a stock and I haven’t mentioned it yet, you’ll still find it in the charts below. The charts contain comparisons based on price-to-book value, dividend yields, and earnings yield. You won’t find these tables anywhere else.
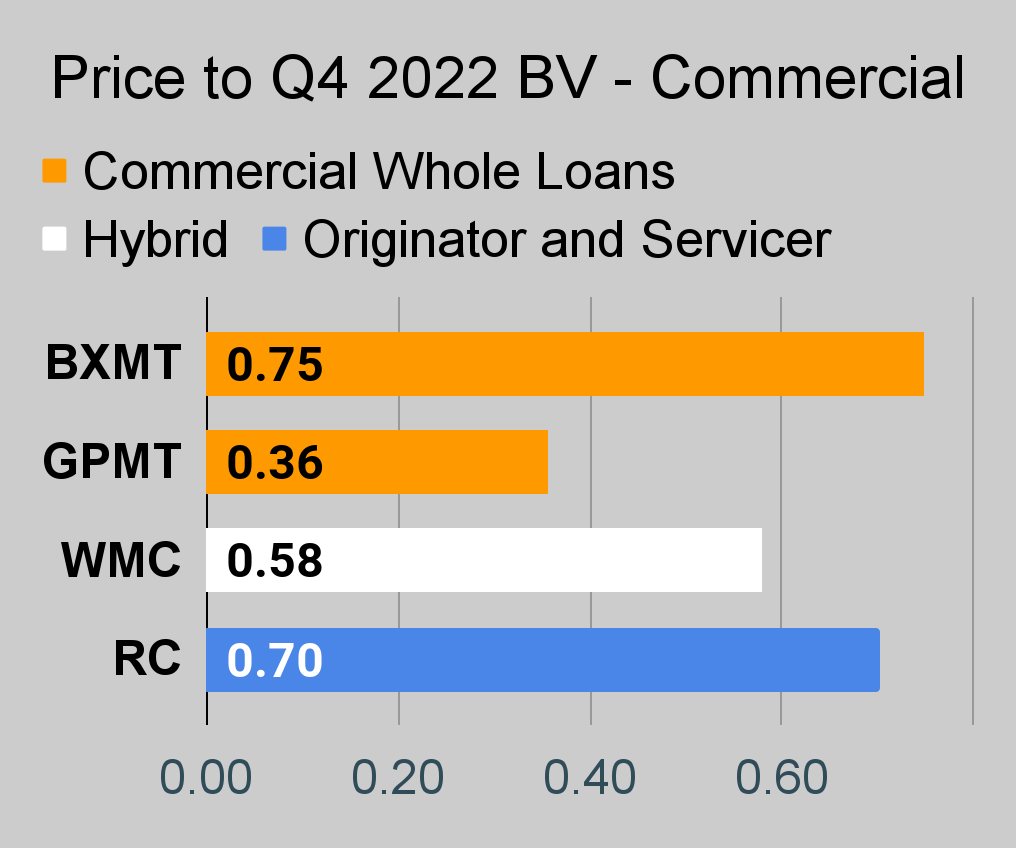
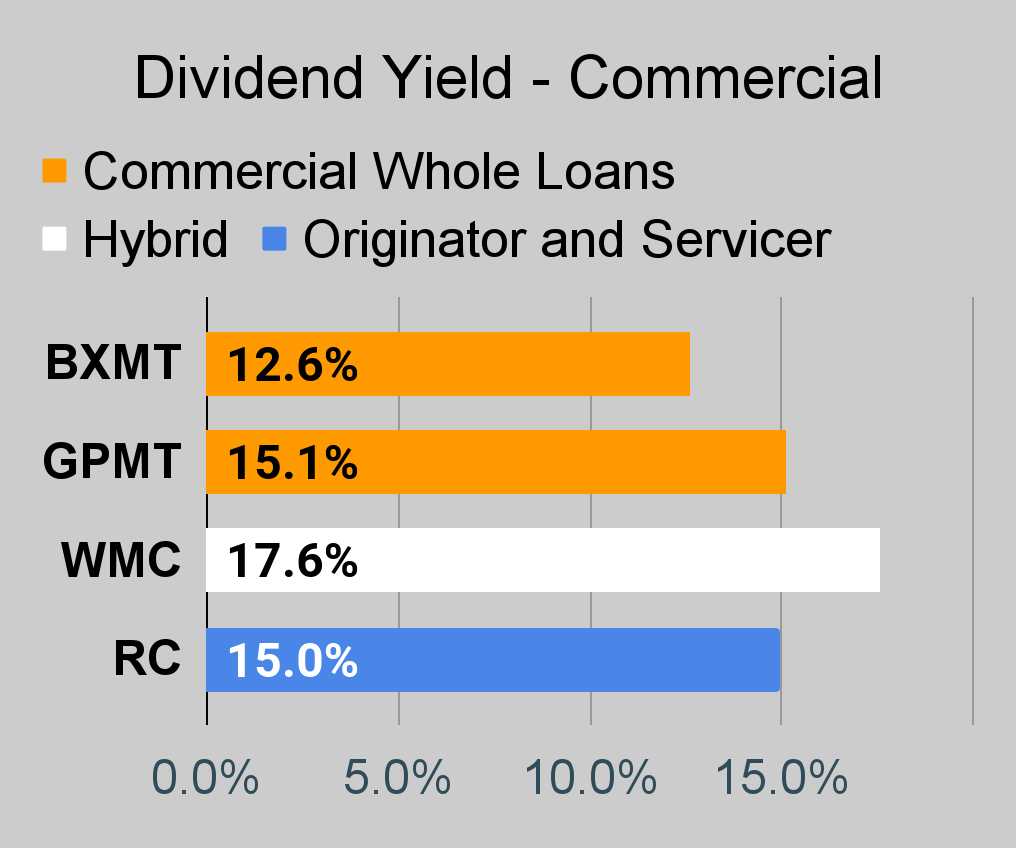
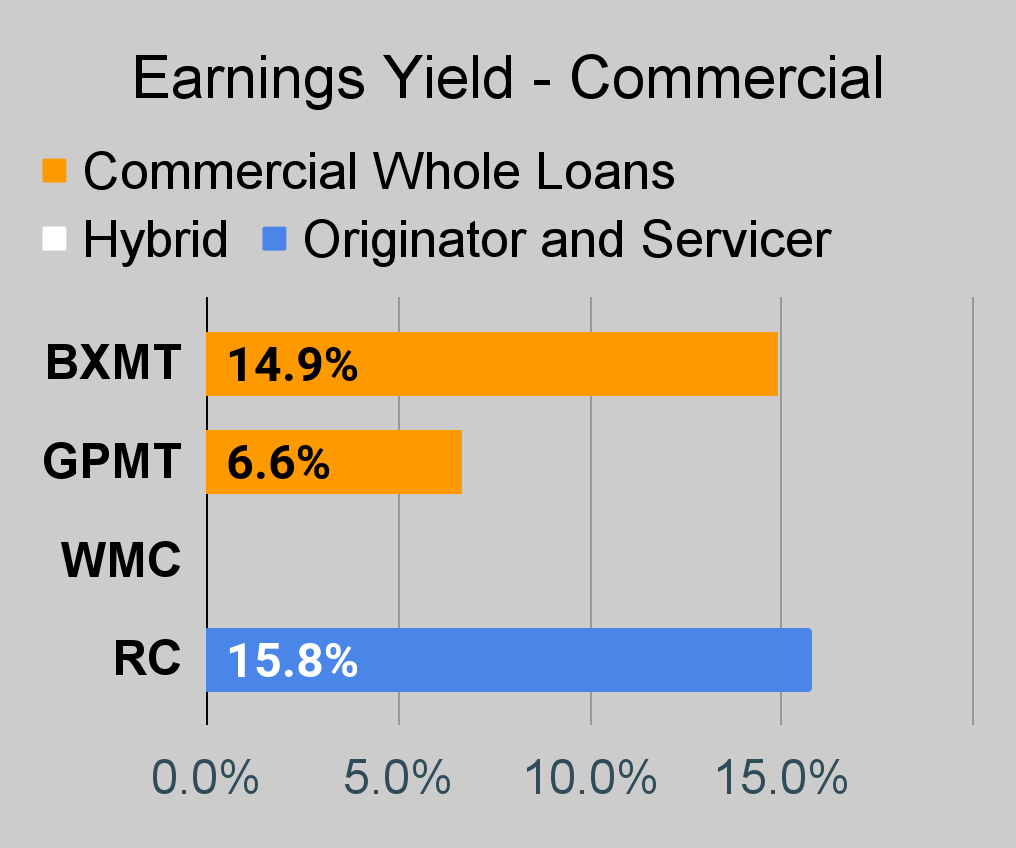
For mortgage REITs, please look at the charts for AGNC, NLY, DX, ORC, ARR, CHMI, TWO, IVR, EARN, CIM, EFC, NYMT, MFA, MITT, AAIC, PMT, RITM, BXMT, GPMT, WMC, and RC.
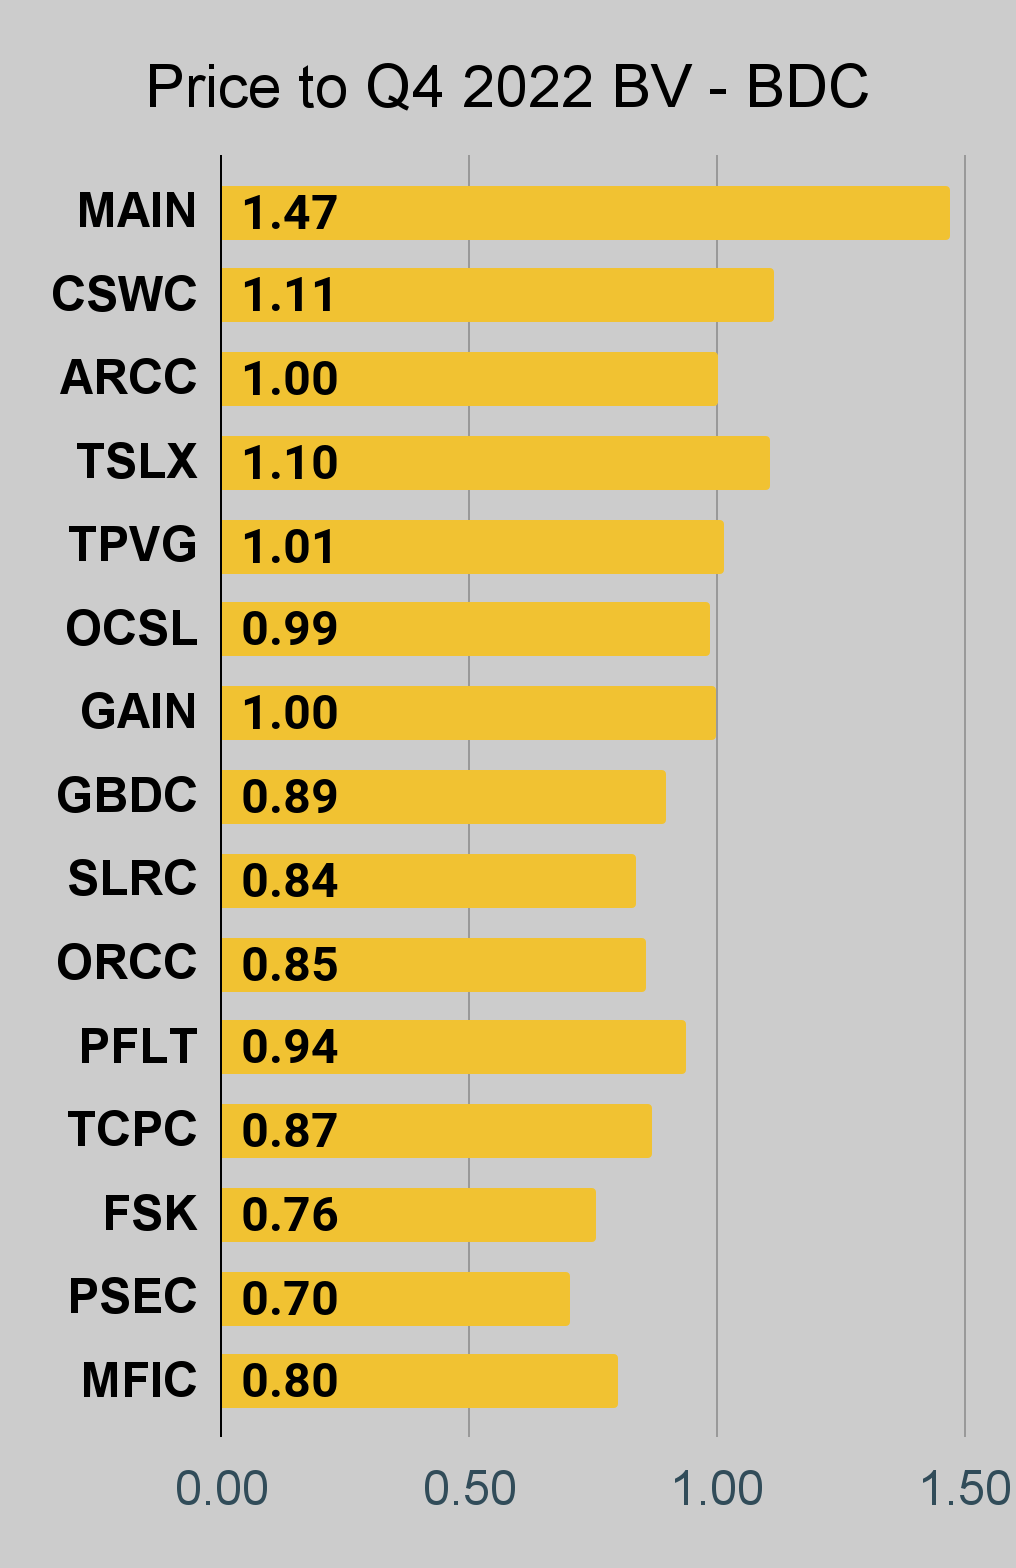
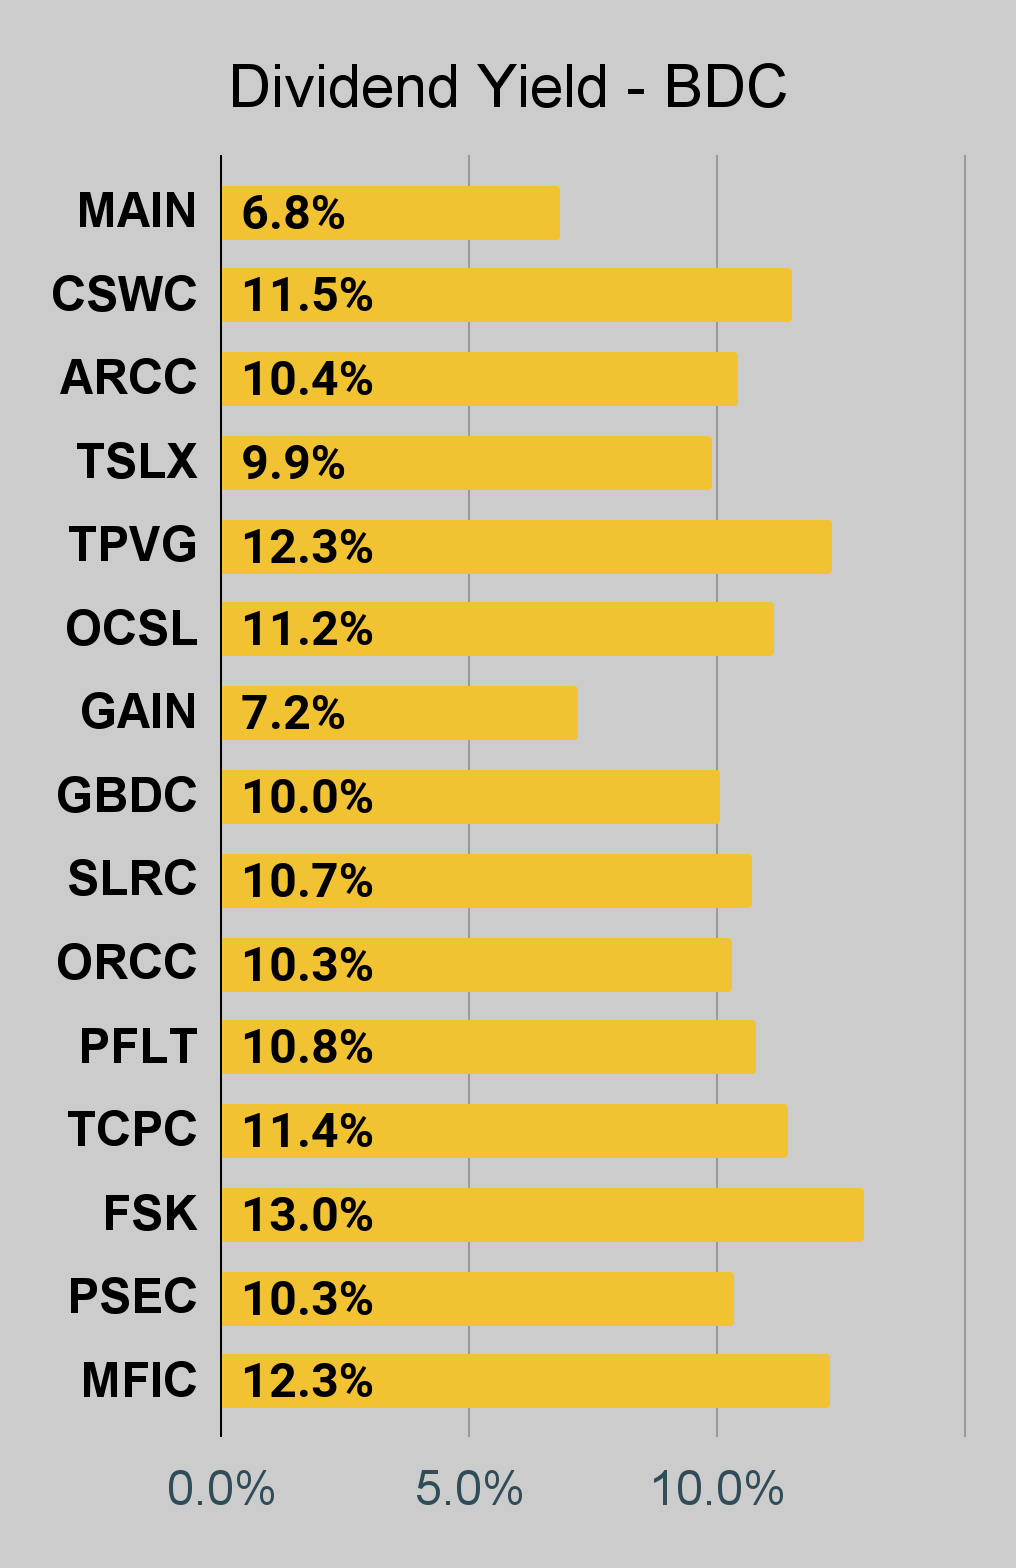
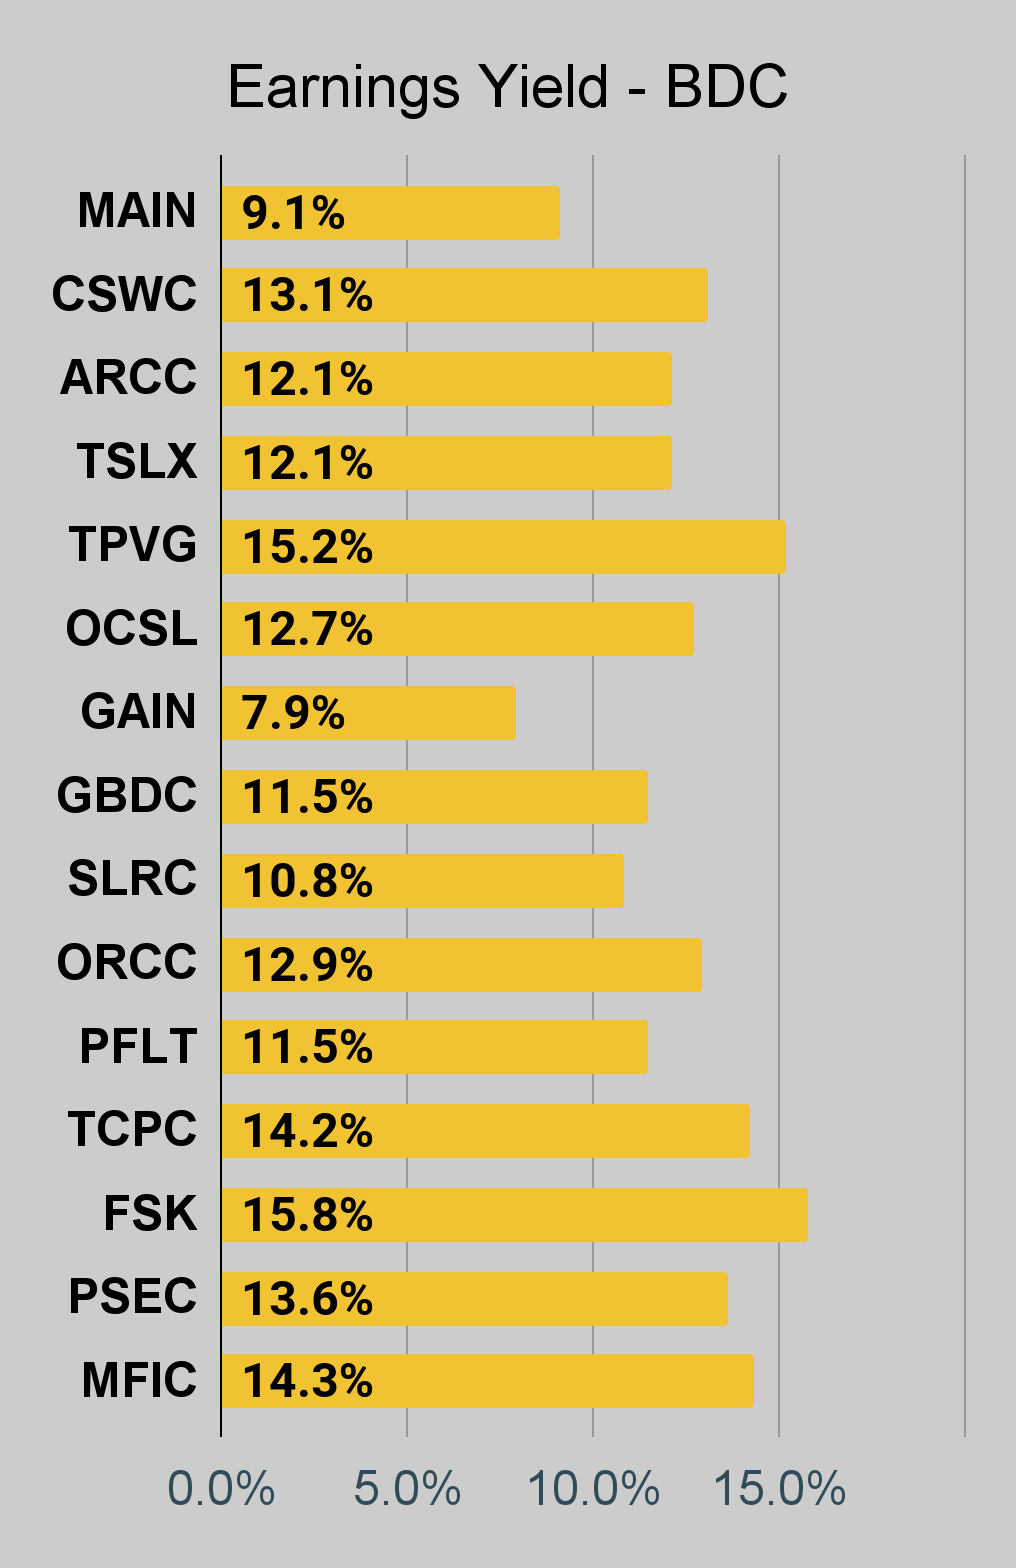
For BDCs, please look at the charts for MAIN, CSWC, ARCC, TSLX, TPVG, OCSL, GAIN, GBDC, SLRC, ORCC, PFLT, TCPC, FSK, PSEC, and MFIC.
This series is the easiest place to find charts providing up-to-date comparisons across the sector.
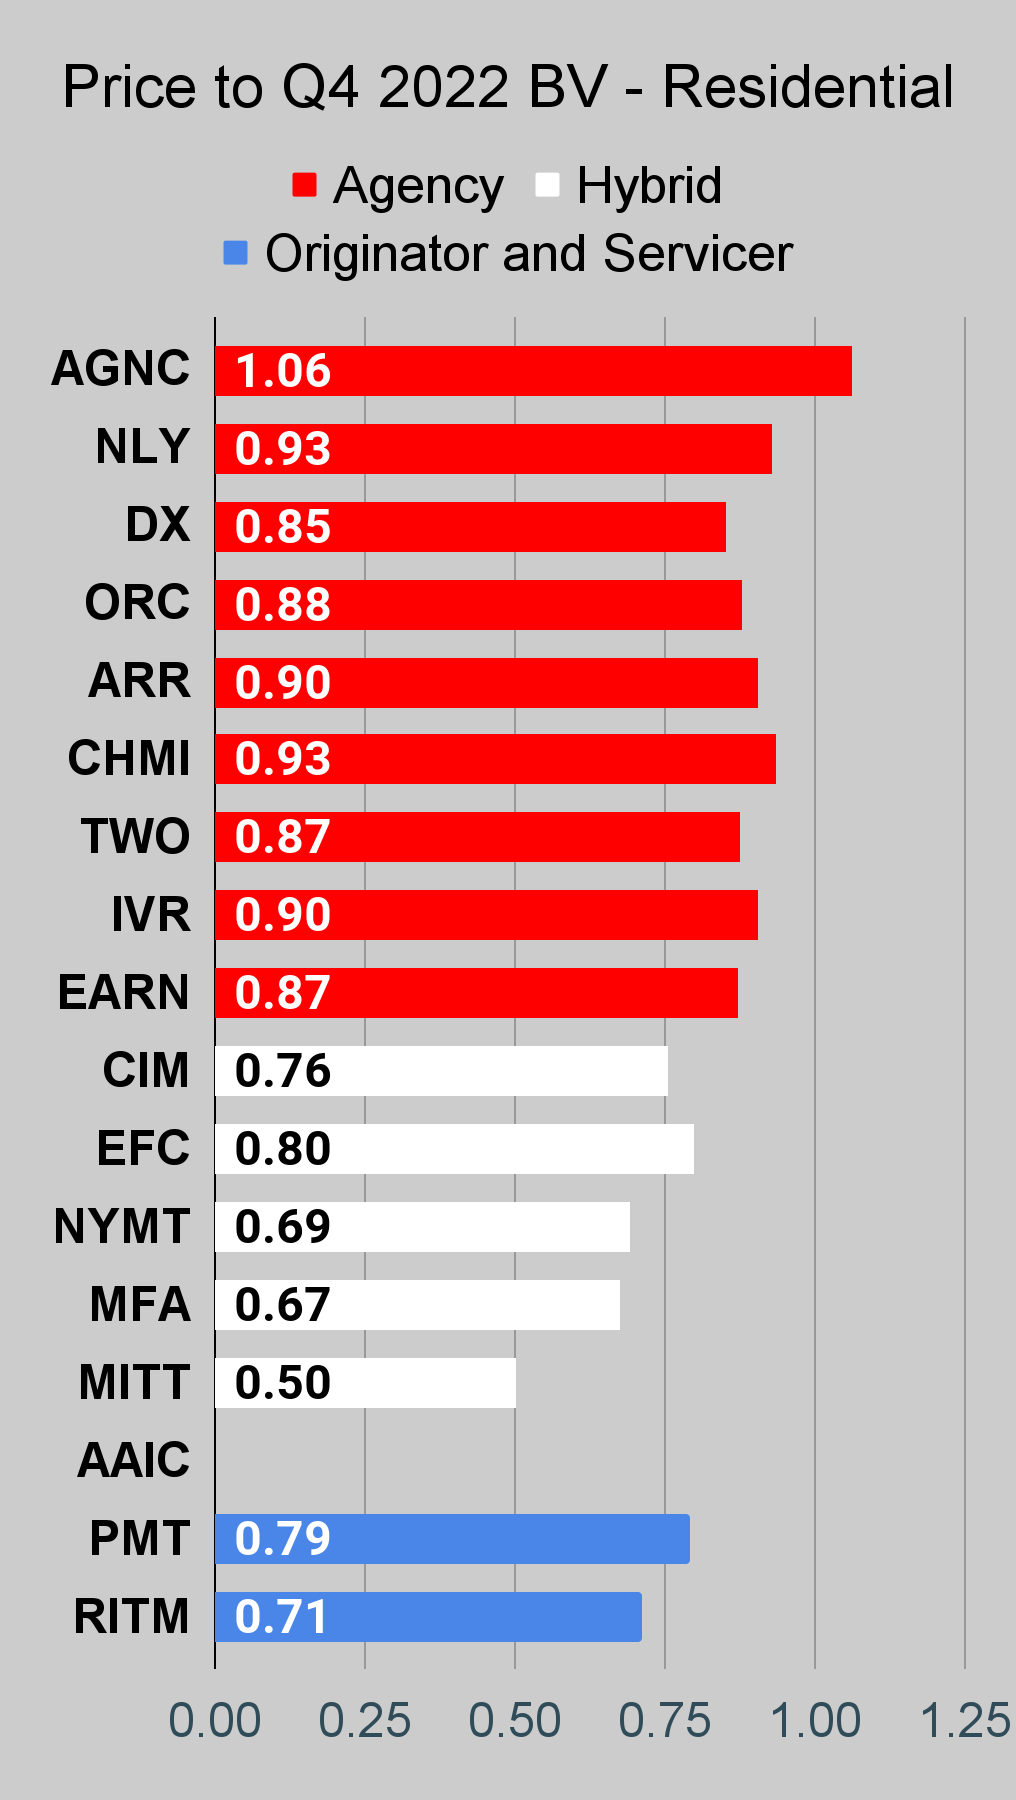
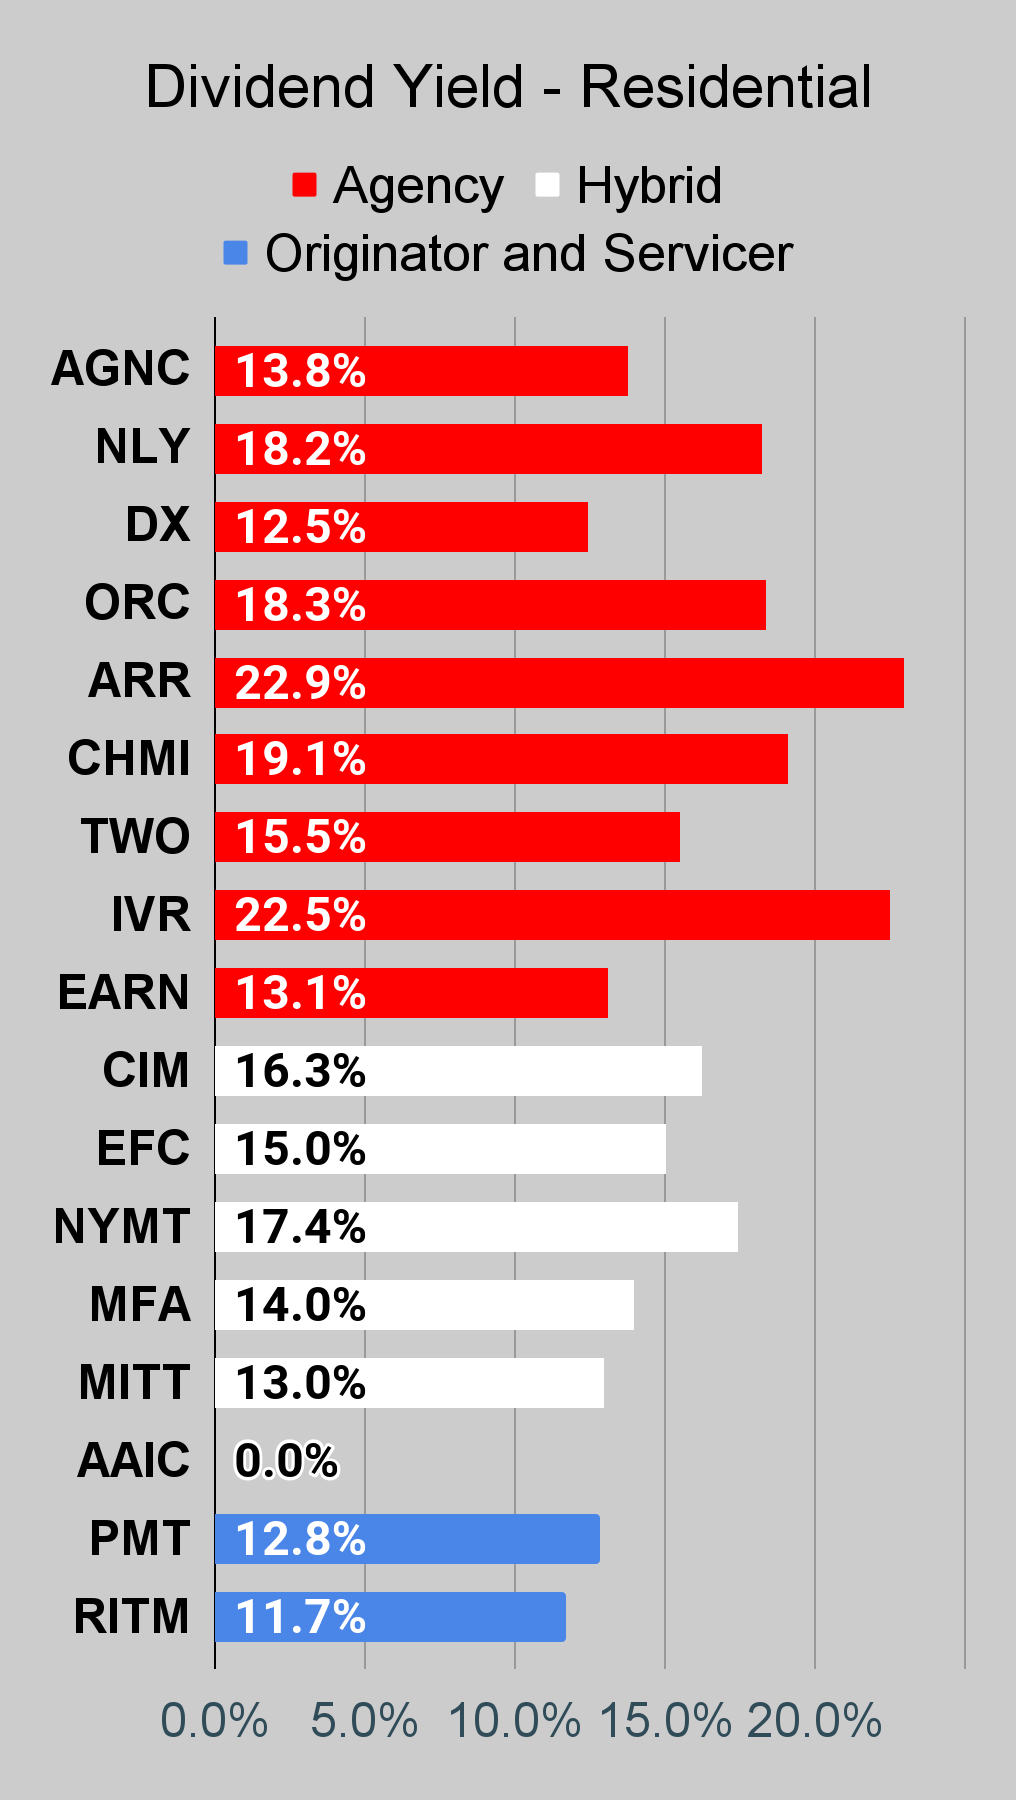
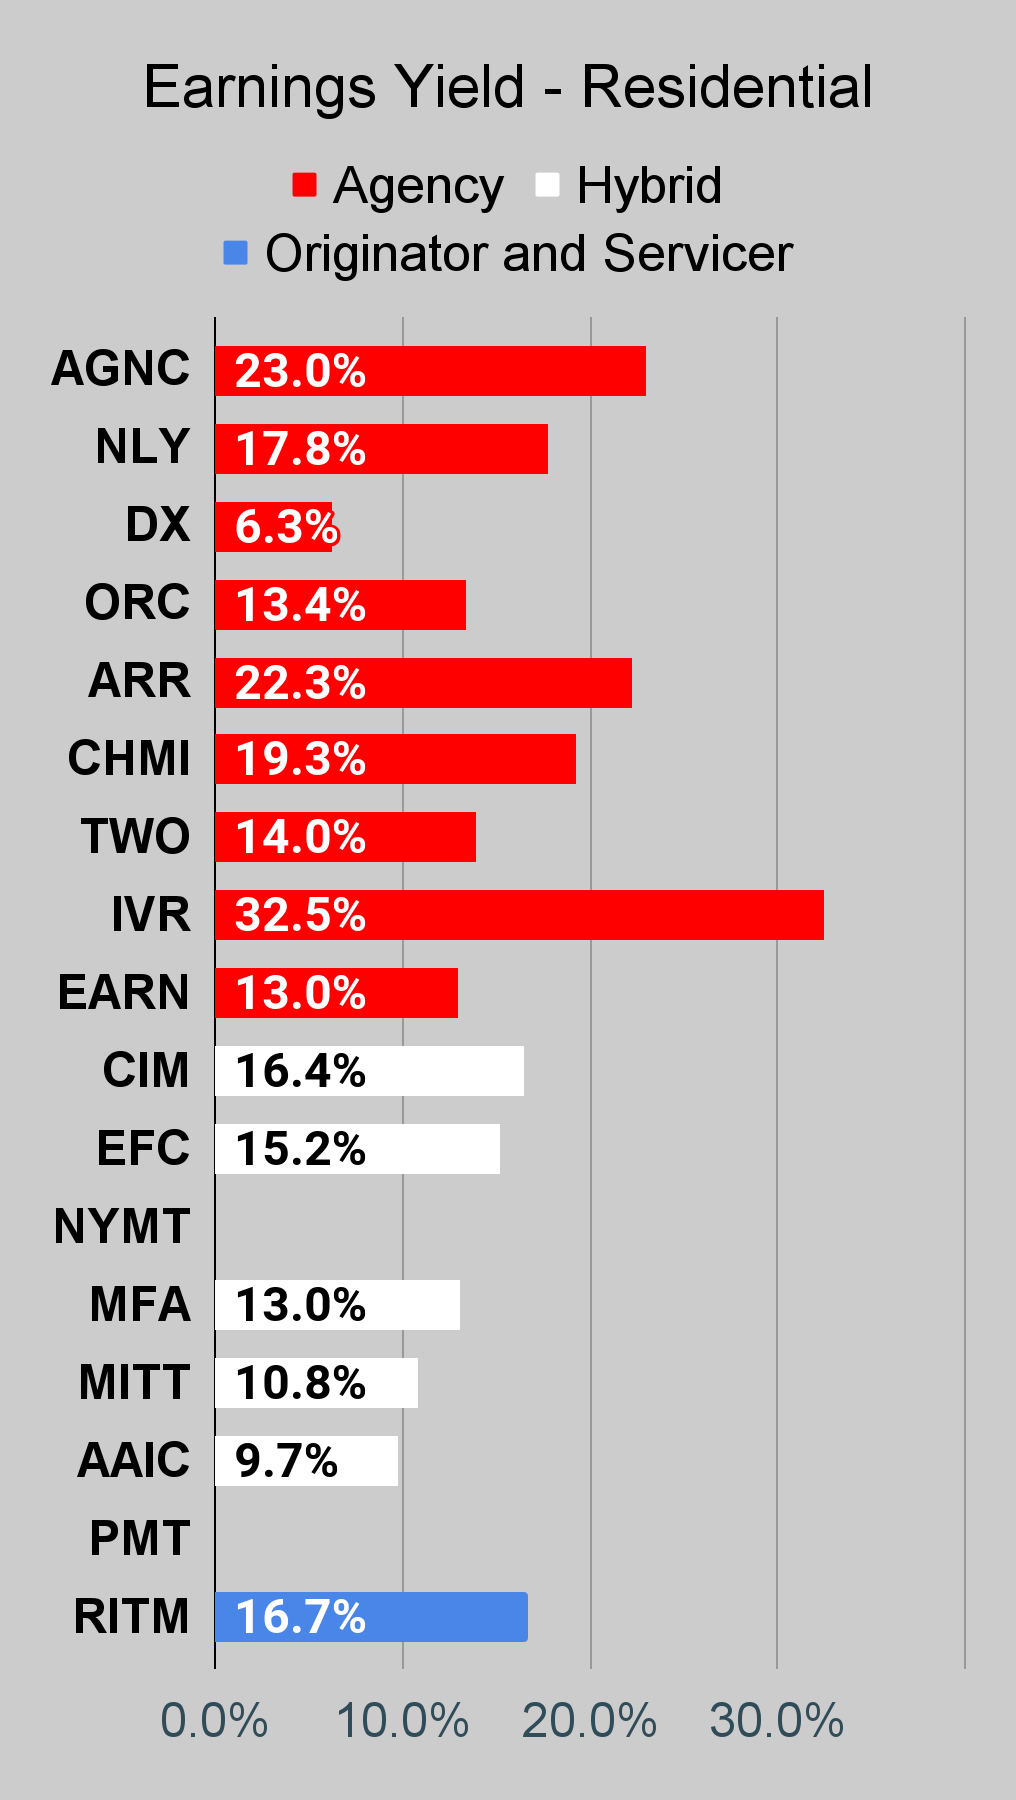
Residential Mortgage REIT Charts
Note: The chart for our public articles uses the book value per share from the latest earnings release. Current estimated book value per share is used in reaching our targets and trading decisions. It's available in our service, but those estimates are not included in the charts below. PMT and NYMT are not showing an earnings yield metric as neither REIT provides a quarterly “Core EPS” metric.
Second Note: Due to the way historical amortized cost and hedging is factored into the earnings metrics, it's possible for two mortgage REITs with similar portfolios to post materially different metrics for earnings. I would be very cautious about putting much emphasis on the consensus analyst estimate (which is used to determine the earnings yield). In particular, throughout late 2022 the earnings metric became less comparable for many REITs.
Commercial Mortgage REIT Charts
BDC Charts
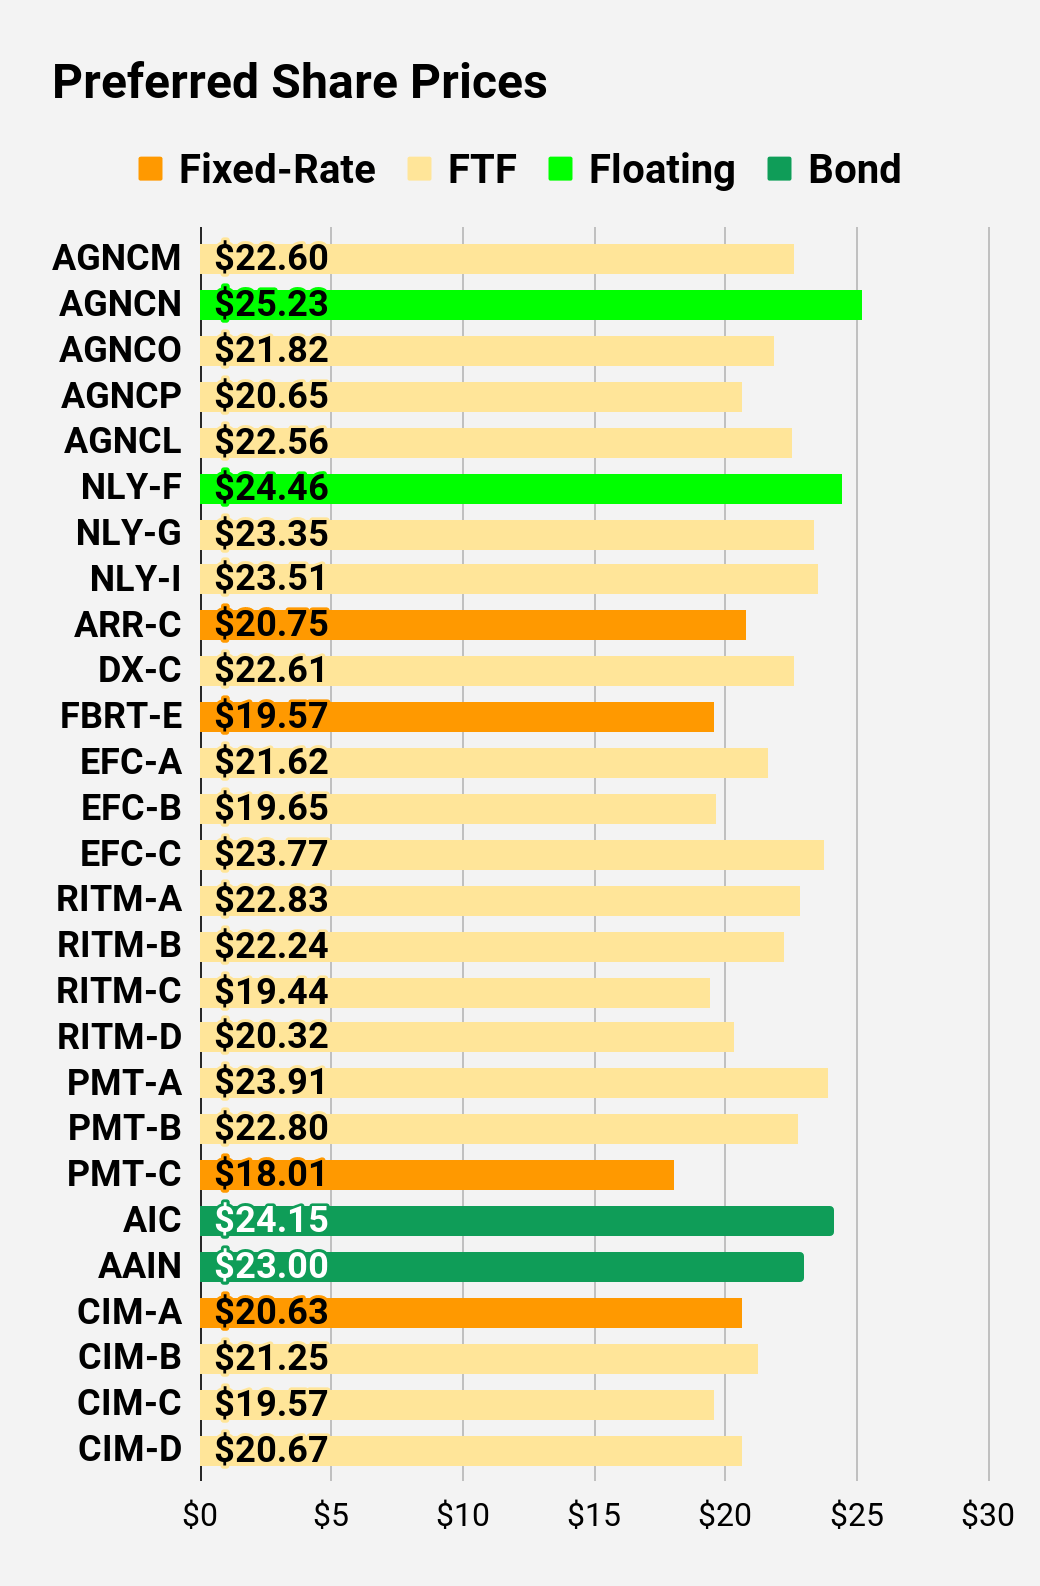
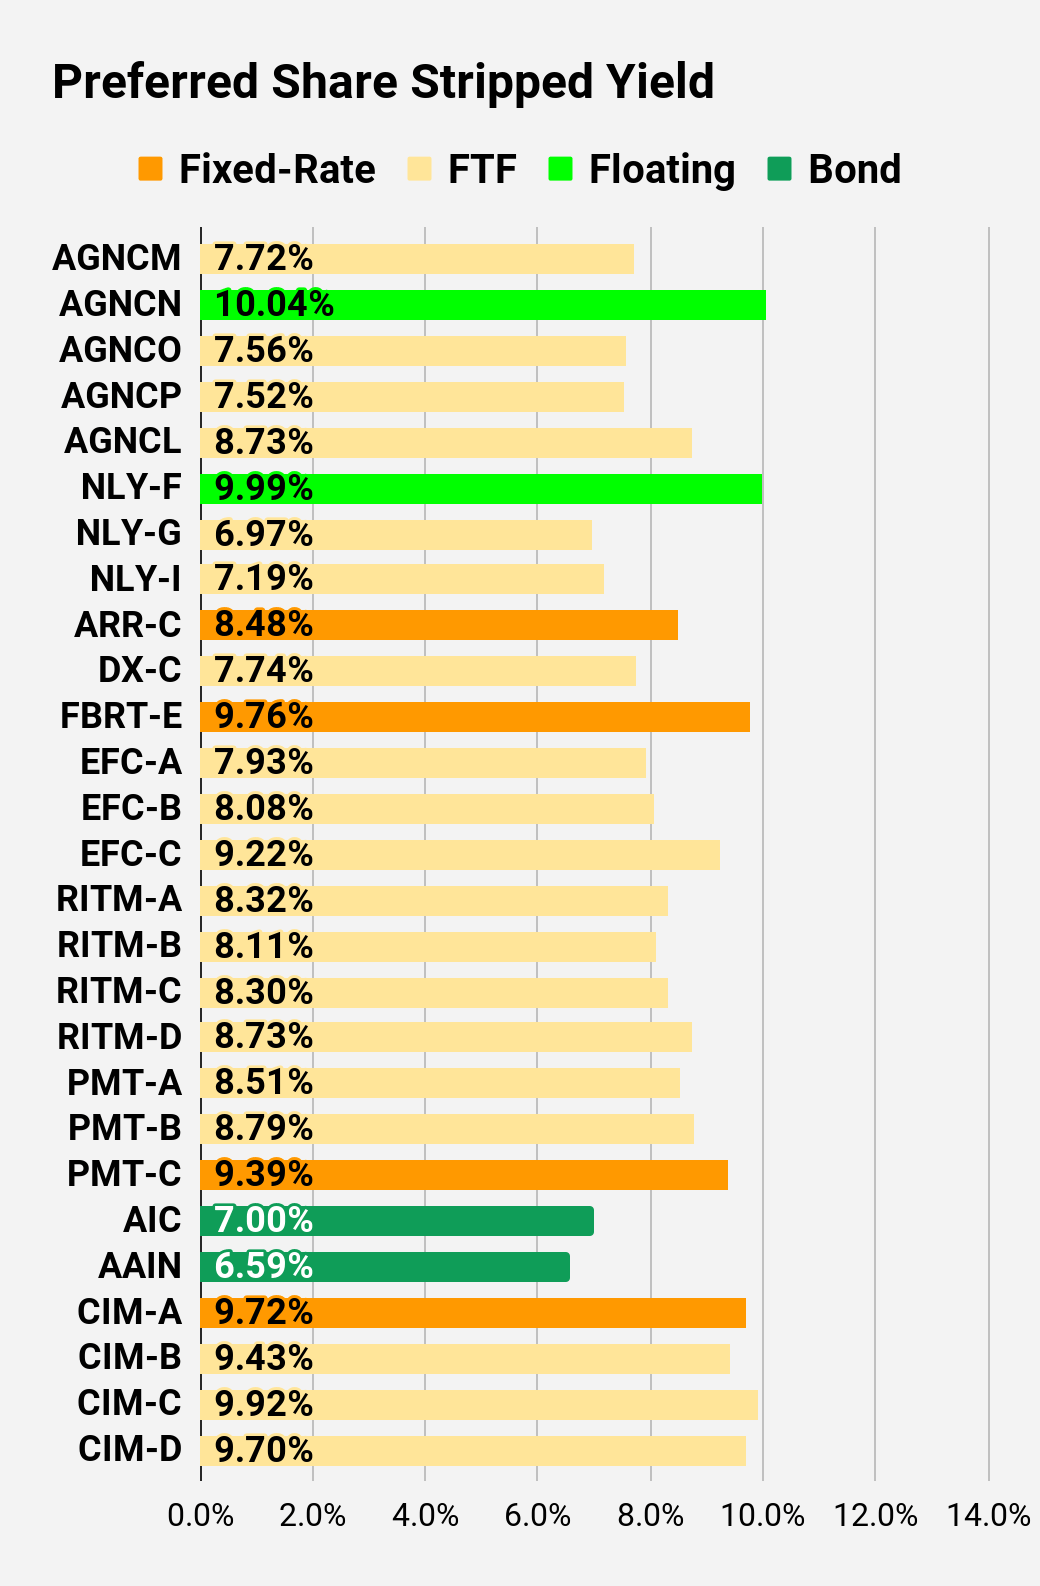
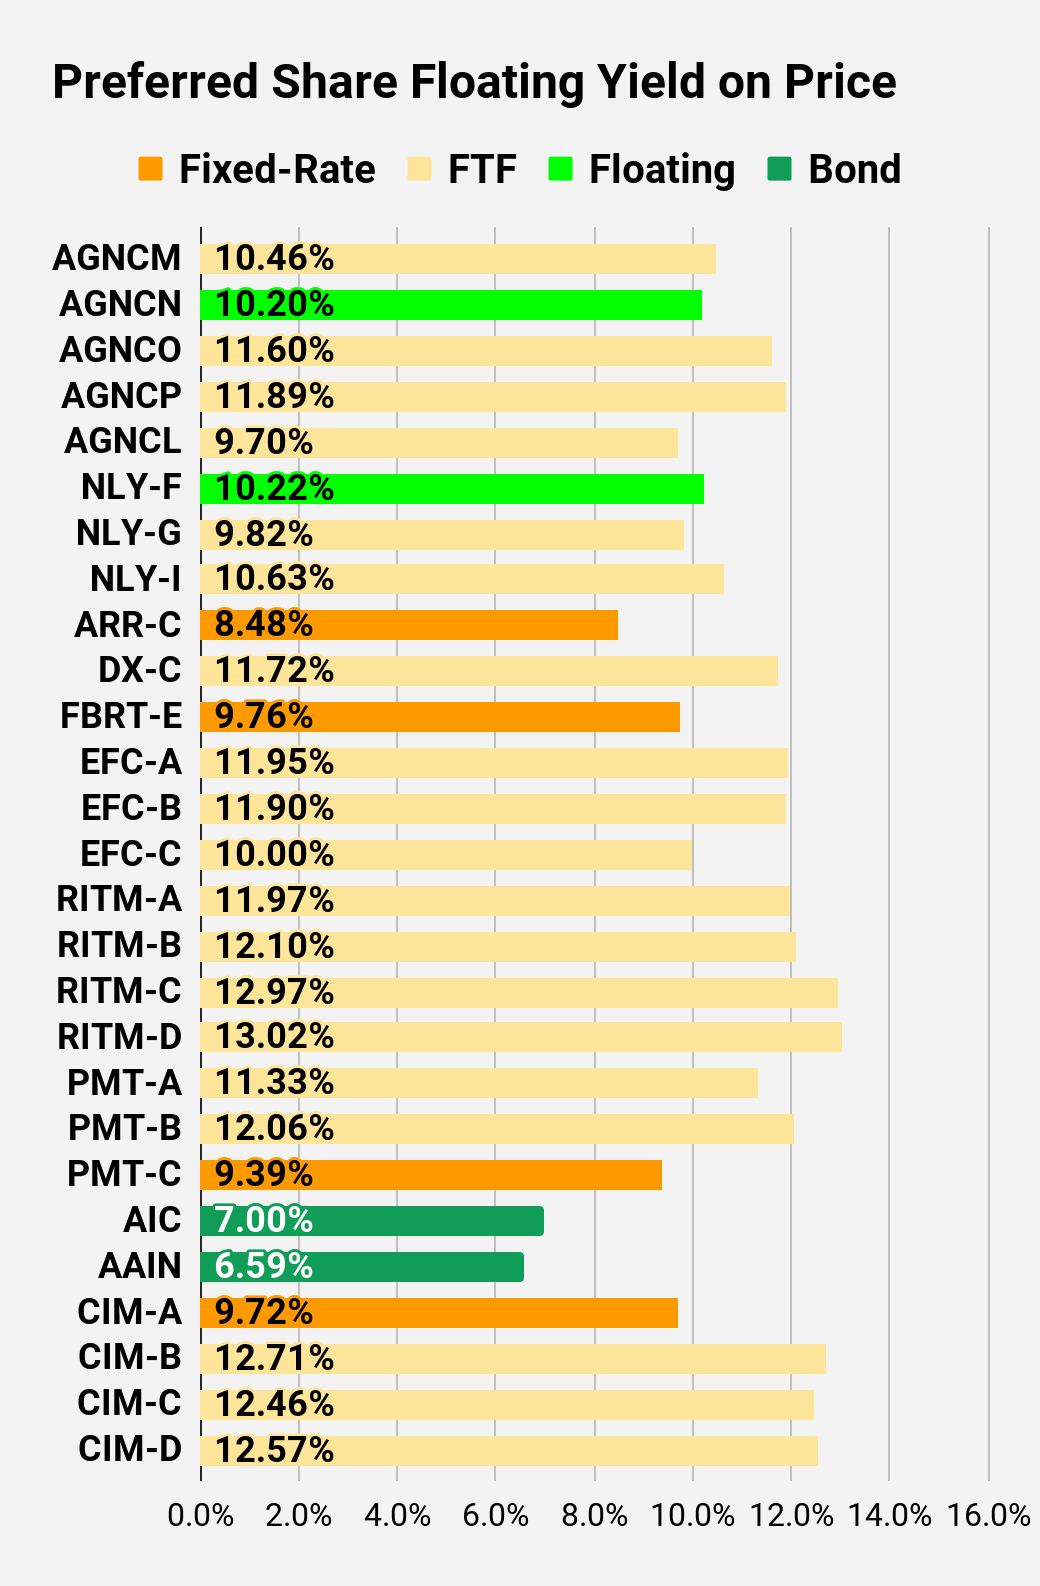
Preferred Share Charts
I changed the coloring a bit. We needed to adjust to include that the first fixed-to-floating shares have transitioned over to floating rates. When a share already is floating, the stripped yield may be different from the “Floating Yield on Price” due to changes in interest rates. For instance, NLY-F already has a floating rate. However, the rate is only reset once per three months. The stripped yield is calculated using the upcoming projected dividend payment and the “Floating Yield on Price” is based on where the dividend would be if the rate reset today. In my opinion, for these shares the “Floating Yield on Price” is clearly the more important metric.
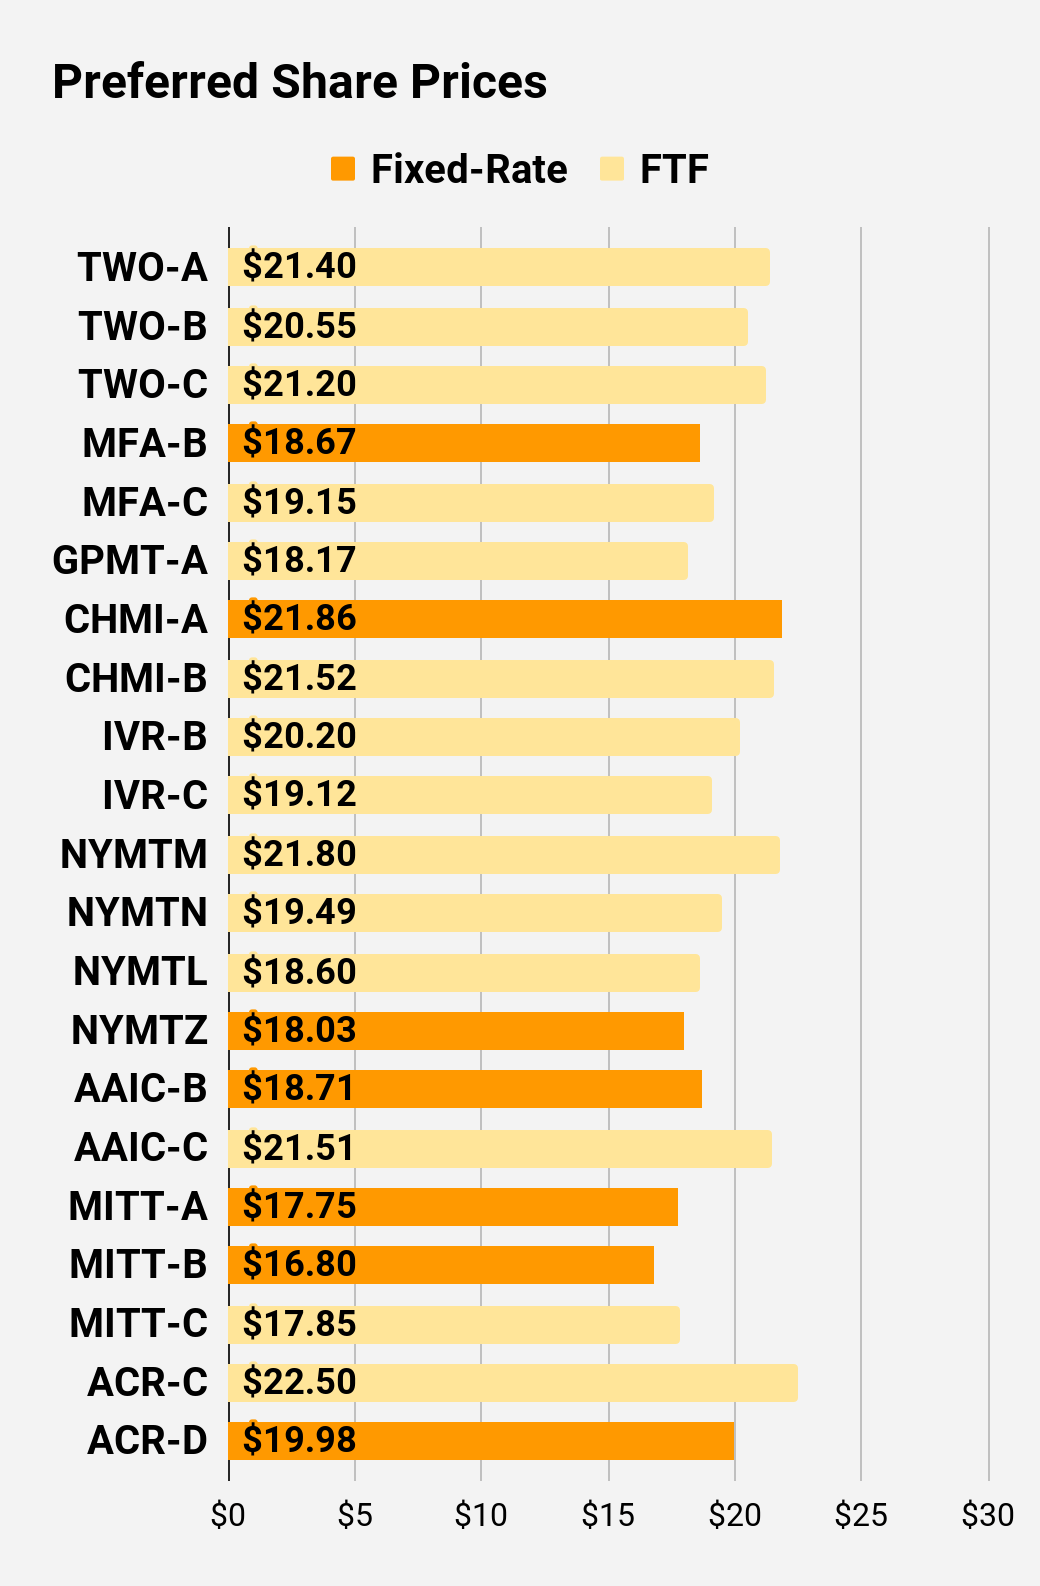
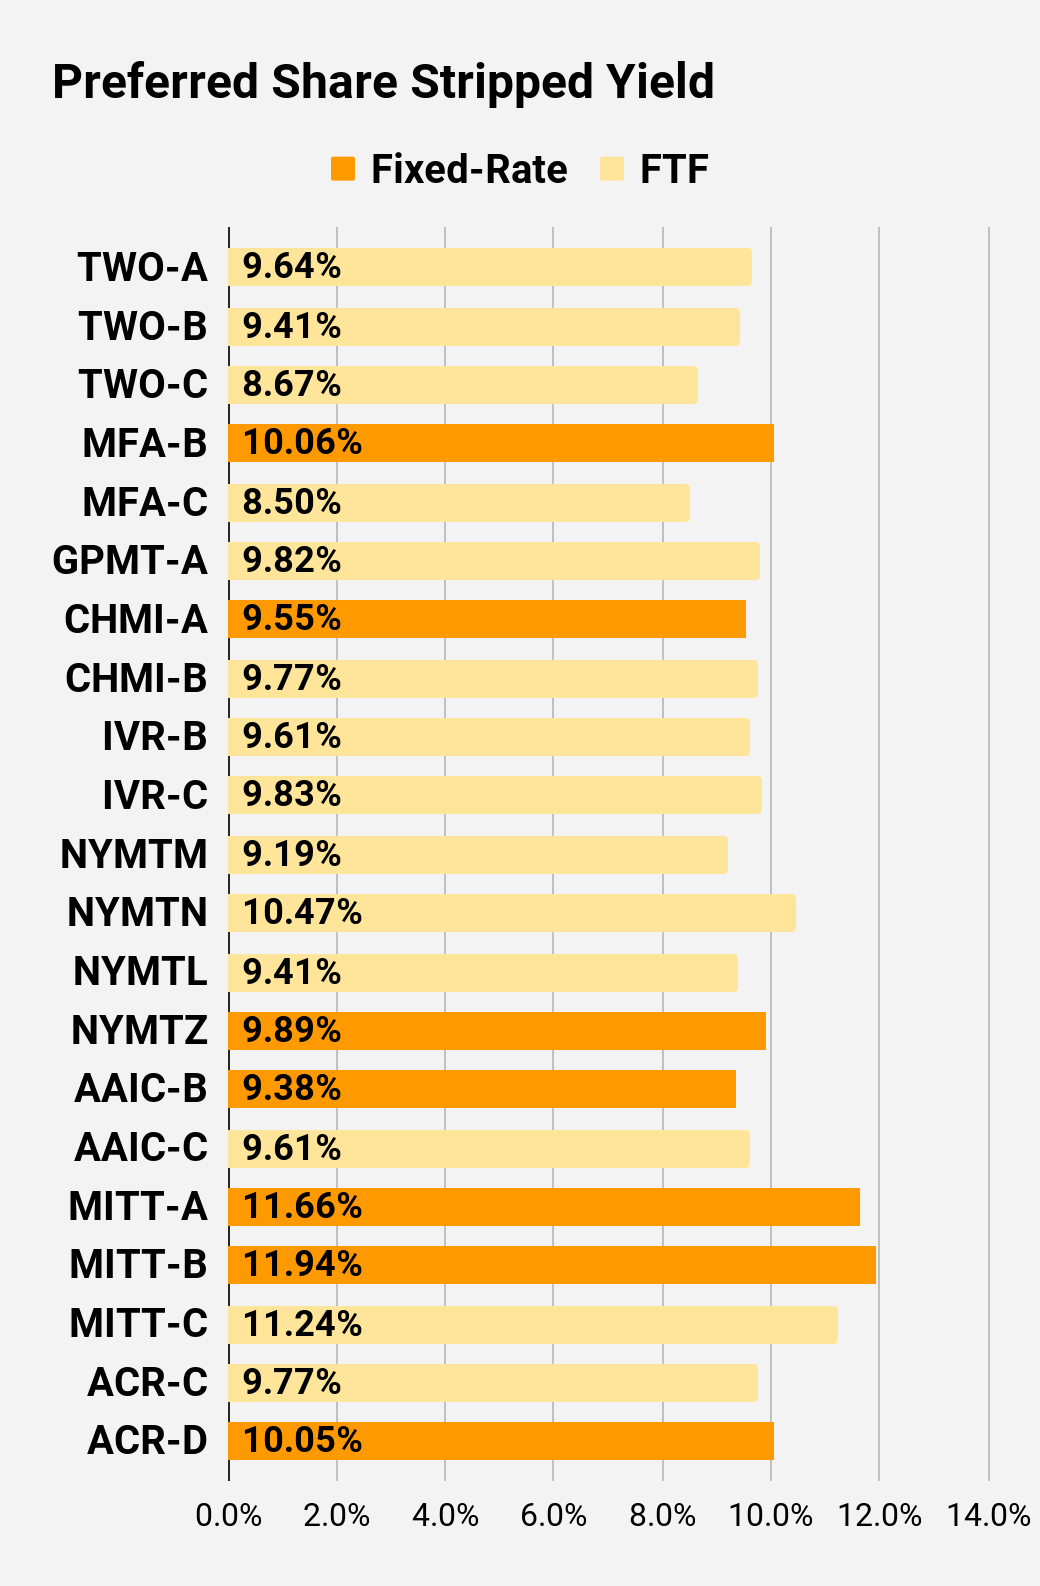
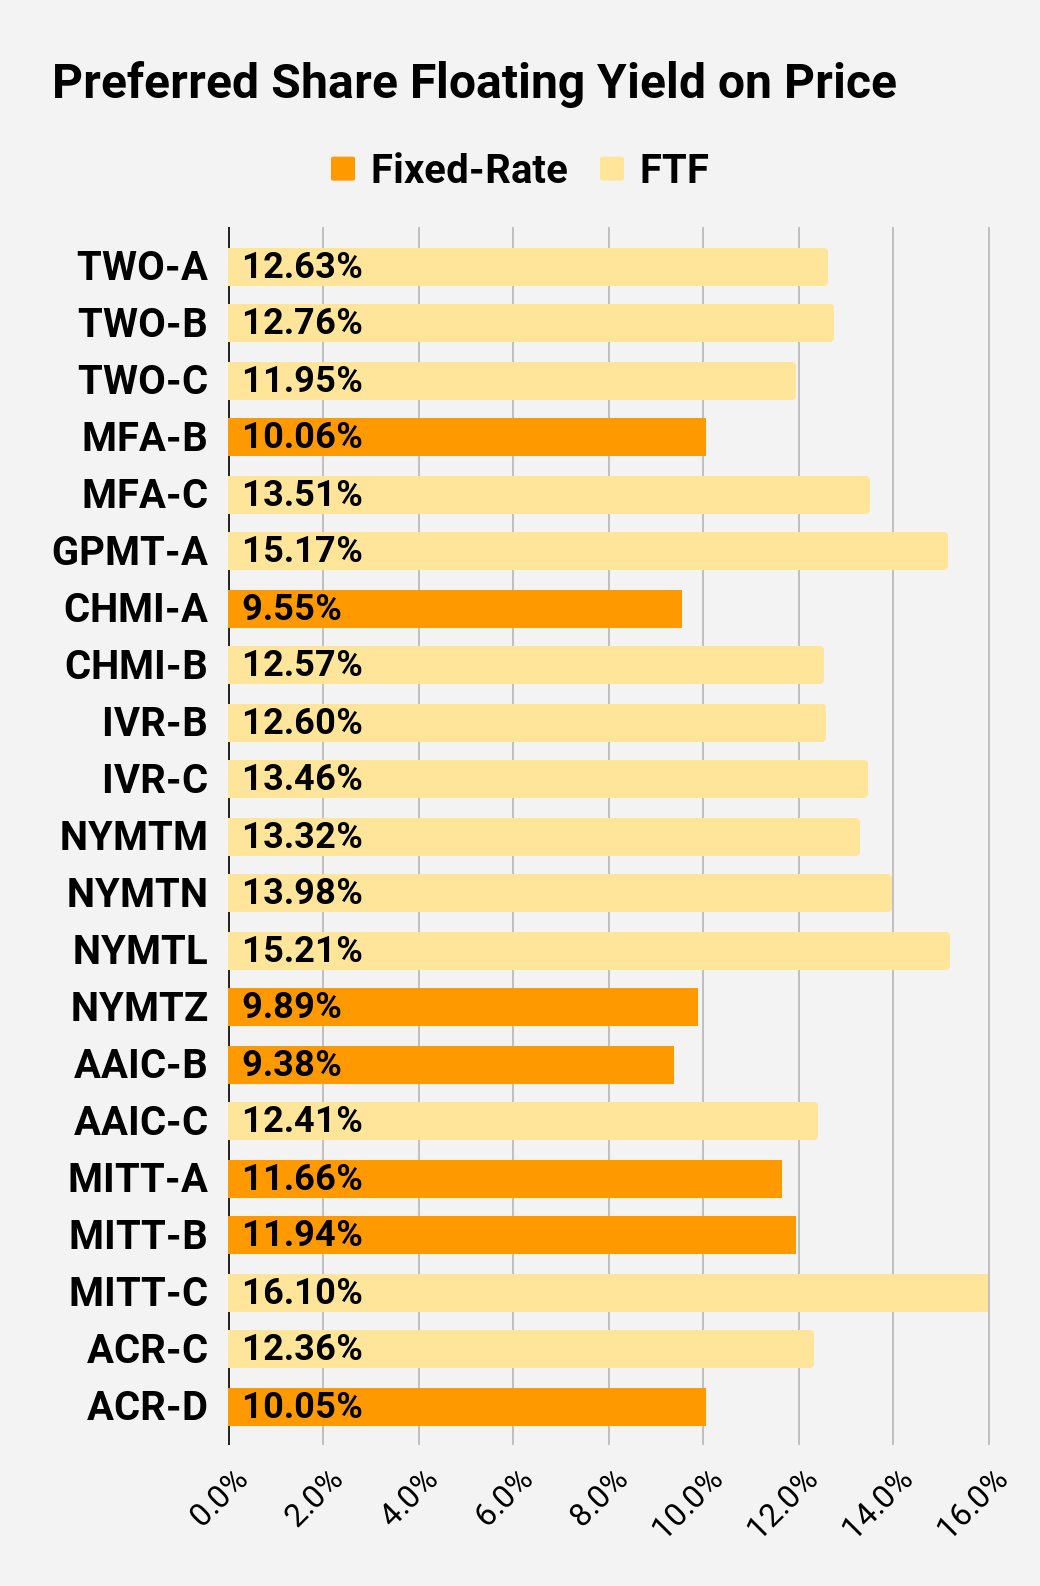
Preferred Share Data
Beyond the charts, we’re also providing our readers with access to several other metrics for the preferred shares.
After testing out a series on preferred shares, we decided to try merging it into the series on common shares. After all, we are still talking about positions in mortgage REITs. We don’t have any desire to cover preferred shares without cumulative dividends, so any preferred shares you see in our column will have cumulative dividends. You can verify that by using Quantum Online. We’ve included the links in the table below.
To better organize the table, we needed to abbreviate column names as follows:
- Price = Recent Share Price - Shown in Charts
- BoF = Bond or FTF (Fixed-to-Floating)
- S-Yield = Stripped Yield - Shown in Charts
- Coupon = Initial Fixed-Rate Coupon
- FYoP = Floating Yield on Price - Shown in Charts
- NCD = Next Call Date (the soonest shares could be called)
- Note: For all FTF issues, the floating rate would start on NCD.
- WCC = Worst Cash to Call (lowest net cash return possible from a call)
- QO Link = Link to Quantum Online Page
| Ticker |
| Price |
| BoF |
| S-Yield |
| Coupon |
| FYoP |
| NCD |
| WCC |
| QO Link |
| P-Link |
| $22.60 |
| FTF |
| 7.72% |
| 6.88% |
| 10.46% |
| 4/15/2024 |
| $4.56 |
| $25.23 |
| Floating |
| 10.04% |
| 9.94% |
| 10.20% |
| 4/8/2023 |
| $0.35 |
| $21.82 |
| FTF |
| 7.56% |
| 6.50% |
| 11.60% |
| 10/15/2024 |
| $6.04 |
| $20.65 |
| FTF |
| 7.52% |
| 6.13% |
| 11.89% |
| 4/15/2025 |
| $7.81 |
| $22.56 |
| FTF |
| 8.73% |
| 7.75% |
| 9.70% |
| 10/15/2027 |
| $11.66 |
| $24.46 |
| Floating |
| 9.99% |
| 9.75% |
| 10.22% |
| 4/8/2023 |
| $0.60 |
| $23.35 |
| FTF |
| 6.97% |
| 6.50% |
| 9.82% |
| 4/8/2023 |
| $1.69 |
| $23.51 |
| FTF |
| 7.19% |
| 6.75% |
| 10.63% |
| 6/30/2024 |
| $3.61 |
| $20.75 |
| 8.48% |
| 7.00% |
| 8.48% |
| 1/28/2025 |
| $7.60 |
| $22.61 |
| FTF |
| 7.74% |
| 6.90% |
| 11.72% |
| 4/15/2025 |
| $6.27 |
| $19.57 |
| 9.76% |
| 7.50% |
| 9.76% |
| 4/8/2023 |
| $5.86 |
| $21.62 |
| FTF |
| 7.93% |
| 6.75% |
| 11.95% |
| 10/30/2024 |
| $6.35 |
| $19.65 |
| FTF |
| 8.08% |
| 6.25% |
| 11.90% |
| 1/30/2027 |
| $11.62 |
| $23.77 |
| FTF |
| 9.22% |
| 8.63% |
| 10.00% |
| 4/30/2028 |
| $12.55 |
| $22.83 |
| FTF |
| 8.32% |
| 7.50% |
| 11.97% |
| 8/15/2024 |
| $5.00 |
| $22.24 |
| FTF |
| 8.11% |
| 7.13% |
| 12.10% |
| 8/15/2024 |
| $5.45 |
| $19.44 |
| FTF |
| 8.30% |
| 6.38% |
| 12.97% |
| 2/15/2025 |
| $8.77 |
| $20.32 |
| FTF |
| 8.73% |
| 7.00% |
| 13.02% |
| 11/15/2026 |
| $11.26 |
| $23.91 |
| FTF |
| 8.51% |
| 8.13% |
| 11.33% |
| 3/15/2024 |
| $3.13 |
| $22.80 |
| FTF |
| 8.79% |
| 8.00% |
| 12.06% |
| 6/15/2024 |
| $4.71 |
| $18.01 |
| 9.39% |
| 6.75% |
| 9.39% |
| 8/24/2026 |
| $12.81 |
| $24.15 |
| Bond |
| 7.00% |
| 6.75% |
| 7.00% |
| 4/8/2023 |
| $0.95 |
| $23.00 |
| Bond |
| 6.59% |
| 6.00% |
| 6.59% |
| 8/1/2023 |
| $2.75 |
| $20.63 |
| 9.72% |
| 8.00% |
| 9.72% |
| 4/8/2023 |
| $4.50 |
| $21.25 |
| FTF |
| 9.43% |
| 8.00% |
| 12.71% |
| 3/30/2024 |
| $5.84 |
| $19.57 |
| FTF |
| 9.92% |
| 7.75% |
| 12.46% |
| 9/30/2025 |
| $10.37 |
| $20.67 |
| FTF |
| 9.70% |
| 8.00% |
| 12.57% |
| 03/30/2024 |
| $6.42 |
Second Batch:
| Ticker |
| Price |
| BoF |
| S-Yield |
| Coupon |
| FYoP |
| NCD |
| WCC |
| QO Link |
| P-Link |
| $21.40 |
| FTF |
| 9.64% |
| 8.13% |
| 12.63% |
| 04/27/2027 |
| $12.23 |
| $20.55 |
| FTF |
| 9.41% |
| 7.63% |
| 12.76% |
| 07/27/2027 |
| $13.02 |
| $21.20 |
| FTF |
| 8.67% |
| 7.25% |
| 11.95% |
| 1/27/2025 |
| $7.43 |
| $18.67 |
| 10.06% |
| 7.50% |
| 10.06% |
| 4/8/2023 |
| $6.37 |
| $19.15 |
| FTF |
| 8.50% |
| 6.50% |
| 13.51% |
| 3/31/2025 |
| $9.10 |
| $18.17 |
| FTF |
| 9.82% |
| 7.00% |
| 15.17% |
| 11/30/2026 |
| $13.61 |
| $21.86 |
| 9.55% |
| 8.20% |
| 9.55% |
| 4/8/2023 |
| $3.54 |
| $21.52 |
| FTF |
| 9.77% |
| 8.25% |
| 12.57% |
| 4/15/2024 |
| $5.99 |
| $20.20 |
| FTF |
| 9.61% |
| 7.75% |
| 12.60% |
| 12/27/2024 |
| $8.22 |
| $19.12 |
| FTF |
| 9.83% |
| 7.50% |
| 13.46% |
| 9/27/2027 |
| $14.34 |
| $21.80 |
| FTF |
| 9.19% |
| 7.88% |
| 13.32% |
| 1/15/2025 |
| $7.15 |
| $19.49 |
| FTF |
| 10.47% |
| 8.00% |
| 13.98% |
| 10/15/2027 |
| $15.02 |
| $18.60 |
| FTF |
| 9.41% |
| 6.88% |
| 15.21% |
| 10/15/2026 |
| $12.85 |
| $18.03 |
| 9.89% |
| 7.00% |
| 9.89% |
| 1/15/2027 |
| $13.98 |
| $18.71 |
| 9.38% |
| 7.00% |
| 9.38% |
| 4/8/2023 |
| $6.33 |
| $21.51 |
| FTF |
| 9.61% |
| 8.25% |
| 12.41% |
| 3/30/2024 |
| $5.56 |
| $17.75 |
| 11.66% |
| 8.25% |
| 11.66% |
| 4/8/2023 |
| $7.33 |
| $16.80 |
| 11.94% |
| 8.00% |
| 11.94% |
| 4/8/2023 |
| $8.28 |
| $17.85 |
| FTF |
| 11.24% |
| 8.00% |
| 16.10% |
| 9/17/2024 |
| $10.12 |
| $22.50 |
| FTF |
| 9.77% |
| 8.63% |
| 12.36% |
| 7/30/2024 |
| $5.75 |
| $19.98 |
| 10.05% |
| 7.88% |
| 10.05% |
| 5/21/2026 |
| $11.54 |
Strategy
Our goal is to maximize total returns . We achieve those most effectively by including “trading” strategies. We regularly trade positions in the mortgage REIT common shares and BDCs because:
- Prices are inefficient.
- Long term, share prices generally revolve around book value.
- Short term, price-to-book ratios can deviate materially.
- Book value isn’t the only step in analysis, but it's the cornerstone.
We also allocate to preferred shares and equity REITs. We encourage buy-and-hold investors to consider using more preferred shares and equity REITs.
Performance
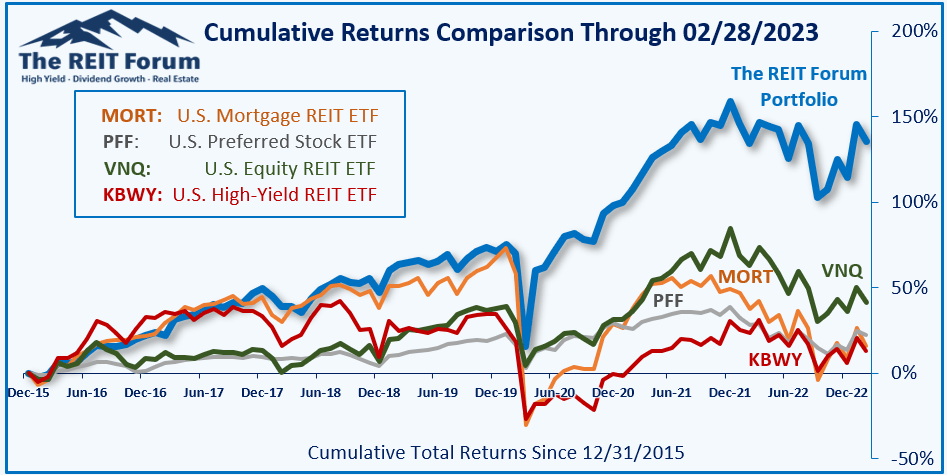
We compare our performance against four ETFs that investors might use for exposure to our sectors:
The REIT Forum
The 4 ETFs we use for comparison are:
| Ticker |
| Exposure |
| One of the largest mortgage REIT ETFs |
| One of the largest preferred share ETFs |
| Largest equity REIT ETF |
| The high-yield equity REIT ETF. Yes, it has been dreadful. |
When investors think it isn’t possible to earn solid returns in preferred shares or mortgage REITs, we politely disagree. The sector has plenty of opportunities, but investors still need to be wary of the risks. We can’t simply reach for yield and hope for the best. When it comes to common shares, we need to be even more vigilant to protect our principal by regularly watching prices and updating estimates for book value and price targets.
Ratings : Powell’s speech firing at healthcare gets a better grade than his speech ignoring net interest expense on our negative $31.7 trillion sovereign “wealth” fund. No, I’m not putting ratings on the stocks today. I got you out of CHMI before it imploded. How much more do you want? Congrats to all the shorts.
For further details see:
High Yield Carnage Begins