FINS - HIPS: The Underlying Index Changed The Issue Stays The Same
2023-04-04 08:00:00 ET
Summary
- GraniteShares HIPS US High Income ETF holds an equal weight portfolio in CEFs, MLPs, REITs, and BDCs.
- The change in underlying index last month was not a major one.
- The 4 asset categories are characterized by capital decay.
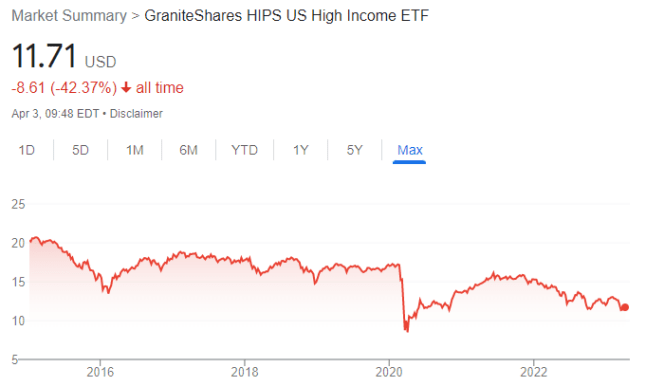
- HIPS has a stable distribution, but it has lost 42% in share price since 2015.
- Bonus: an alternative high-yield strategy taking into account total return.
This ETF (exchange-traded fund) review series aims at evaluating products regarding the past performance of their strategies and quality of their current portfolios. As holdings and their weights change over time, updated reviews are posted when necessary.
HIPS facts and portfolio
GraniteShares HIPS US High Income ETF ( HIPS ) is tracking the EQM High Income Pass-Through Securities Index. The underlying index has changed on March 15, 2023. Before that date, the fund was tracking the TFMS HIPS Index since it was launched on 1/6/2015. Now it has 40 holdings, a 12-month yield of 10.27% and management fees of 0.70%. However, it is a fund of funds and the total expense ratio is 2.88%.
At the time of my previous review in October 2022, GraniteShares HIPS US High Income ETF had 60 holdings. A note of caution: as of writing, the prospectus available on GraniteShares website still refers to the old index. I am not sure the advertised total expense ratio is up-to-date. Anyway, the portfolio has about 25% of asset value in closed-end funds, which implies a high total expense ratio.
Eligible pass-through securities must return at least 90% of their taxable earnings to shareholders. As described by EQM Indexes , the new index
is comprised of U.S. exchange-listed high income pass-through securities in the following asset categories: Closed-End Funds (CEFs), Business Development Companies (BDCs), Real Estate Investment Trusts (REITs), and Energy Master Limited Partnerships (MLPs).
This description also applied to the old index.
The rules to select CEFs are:
- Assets of at least $150 million USD,
- Average daily traded value of at least $500k over the last 6 months,
- Top 10 CEFs with the highest indicated dividend yield and lowest 180-day volatility.
The rules to select BDCs are the same, except that the minimum of assets becomes a minimum of market capitalization. The rules for REITs and MLPs are also the same, with a minimum market capitalization of $1 billion USD. REITS funding private prisons are excluded. The index is reconstituted annually and rebalanced every quarter in equal weight.
The change is not a major one. The main differences are that the old index was using volatility in the selection and weighting rules, and it had more flexibility in category weighting. There was a minimum of 15% in each category on reconstitution, whereas categories are now in equal weight, with 10 holdings in each category and a target weight of 2.5% for every holding.
Because of price action, weights drift between rebalancing dates. The next table lists the top 10 holdings as of writing, representing 27% of asset value.
| Ticker |
| Name |
| Weight |
| First Trust Senior Floating Rate Income |
| 3.91% |
| Angel Oak Financial Strategies |
| 3.76% |
| Nuveen Credit Strategies Income |
| 3.76% |
| Ares Dynamic Credit Allocation |
| 3.53% |
| DoubleLine Yield Opportunities |
| 3.53% |
| Western Asset High Yield Defined |
| 3.52% |
| Barings Global Short Duration |
| 3.45% |
| PGIM High Yield Bond Fund |
| 3.43% |
| Nuveen Real Asset Income and Growth |
| 3.42% |
| PGIM Global High Yield Fund |
| 3.33% |
Historical performance
When a fund changes strategies, you should always be wary of data preceding the change. The prudent approach is to ignore data before that date. It also means excluding the fund from back-tests starting before that date. In this case, as explained in the previous paragraph, the change is a minor one. I don’t think it may significantly modify the fund’s behavior, so I will include price history since inception in my observations.
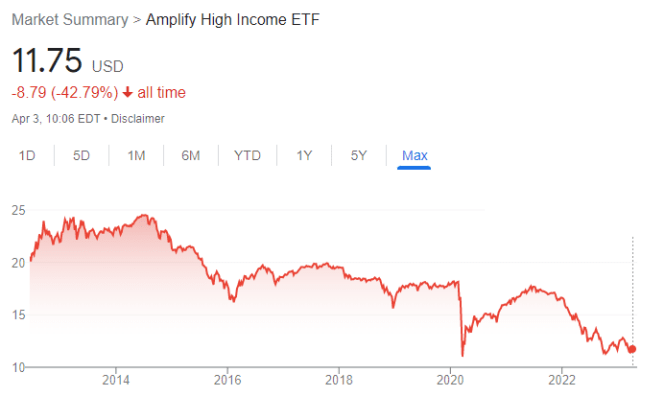
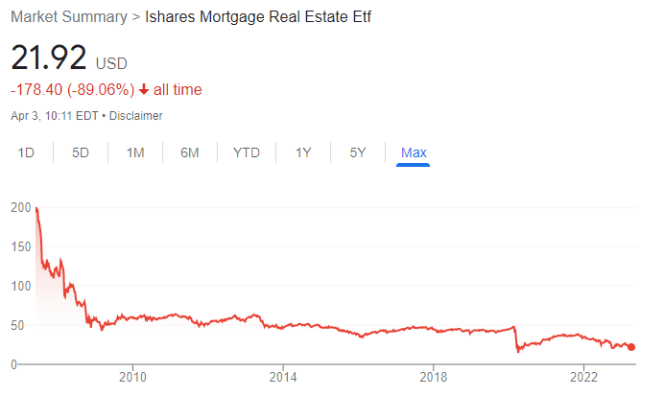
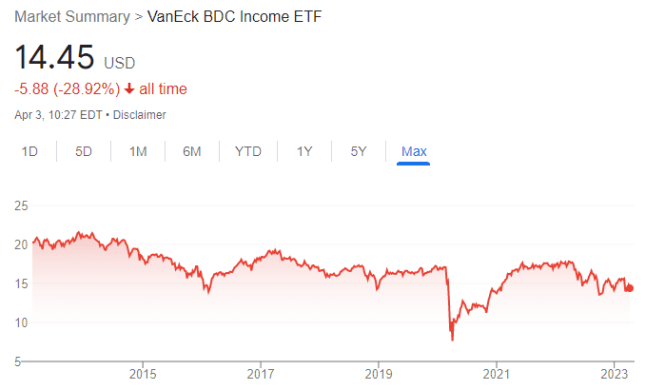
The next table compares HIPS performance since inception with the S&P 500 (SP500) and a more relevant benchmark: an equal-weight portfolio of 4 ETFs representing the 4 asset categories of the portfolio, rebalanced quarterly (like the new underlying index). For this calculation, I have chosen Amplify High Income ETF ( YYY ), iShares Mortgage Real Estate ETF ( REM ), VanEck Vectors BDC Income ETF ( BIZD ) and ALPS Alerian MLP ETF ( AMLP ). Doing this, I have reduced the REIT universe to mortgage REITs. It may not be absolutely correct, but as yield is a primary factor of selection, selected REITs are mostly of the mortgage kind.
| since 1/13/2015 |
| Total Return |
| Annual.Return |
| Drawdown |
| Sharpe ratio |
| Volatility |
| HIPS |
| 16.46% |
| 1.87% |
| -53.14% |
| 0.14 |
| 21.26% |
| YYY+REM+BIZD+AMLP |
| 29.19% |
| 3.17% |
| -55.44% |
| 0.21 |
| 23.06% |
| SPY |
| 135.41% |
| 10.98% |
| -33.72% |
| 0.68 |
| 15.97% |
HIPS has been lagging the stock benchmark by far, and it is also behind the ETF mix by 1.3 percentage point in annualized return. It means the strategy of the old index has failed to bring added value over the mix of passive indexes. After the total expense ratio, this is a second red flag. I doubt the new index will do much better.
The fund has suffered a capital decay of 42% since inception:
HIPS share price (Google Finance)
In fact, the 4 ETFs corresponding to the “pass-through” categories of the portfolio have lost value in share price since their respective inceptions (see next charts).
YYY share price (Google Finance)
REM share price (Google Finance)
BIZD share price (Google Finance)
AMLP share price (Google Finance)
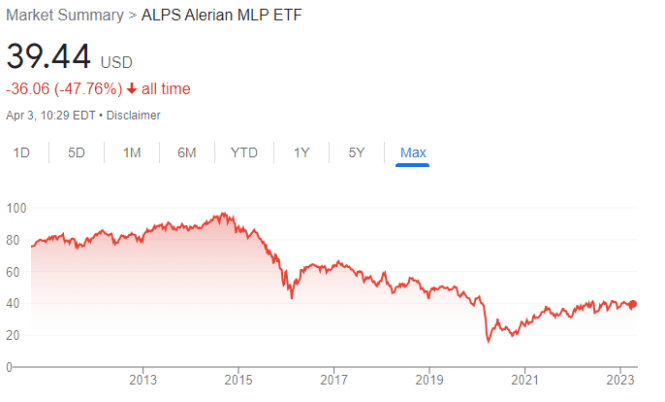
It is almost impossible to make a good recipe with bad ingredients. The problem of HIPS is structural, it is not related to management. Other similar ETFs like Global X Alternative Income ETF (ALTY), reviewed here , First Trust Multi-Asset Diversified Income Index ETF (MDIV), reviewed here , and iShares Morningstar Multi-Asset Income ETF (IYLD), reviewed here , have the same issue.
It is not specific to HIPS and these funds: Securities with yields above 6% suffer from capital decay on average (there are rare exceptions). The 10-year average annualized return including dividends of all ETFs with a yield superior to 6% is 4.5%… for an average yield over 8%!
HIPS has maintained a constant monthly distribution of $0.1075 per share since 2017, but I doubt it is sustainable on the long-term. The yield cannot go up indefinitely to offset the loss in asset value.
The picture is not pretty for an income-seeking investor, considering the current inflation rate and the tax paid on distributions. HIPS might be used as an instrument for swing trading or tactical allocation, but I don’t see it as a reasonable buy-and-hold investment. This is true for a number of high-yield instruments, not only this one.
A solution to get high yields without decay
Capital and income decay is an issue in many closed-end funds, like in high yield ETFs. However, it can be avoided or mitigated by rotational strategies, instead of using funds as buy-and-hold instruments. I designed a 5-factor ranking system in 2016, and monitored its performance during several years. I started publishing the eight best ranked CEFs in Quantitative Risk & Value ((QRV)) after the March 2020 meltdown. The list is updated every week. Its average dividend yield varies around 7%. It's not a model portfolio: trading the list every week is too costly in spreads and slippage. Its purpose is helping investors find funds with a good entry point. In the table and chart below, I give the hypothetical example of starting a portfolio on 3/25/2020 with my initial “Best 8 Ranked CEFs” list and updating it every 3 months since then, ignoring intermediate updates. Return is calculated using closing prices, with holdings in equal weights and reinvesting dividends at the beginning of every 3-month period.
| since 3/25/2020 |
| Total Return |
| Annual.Return |
| Drawdown |
| Sharpe ratio |
| Volatility |
| Best 8 CEFs quarterly |
| 121.20% |
| 30.04% |
| -20.60% |
| 1.27 |
| 20.42% |
| HIPS |
| 11.68% |
| 3.72% |
| -22.87% |
| 0.22 |
| 12.07% |
| SPY |
| 73.66% |
| 20.03% |
| -24.50% |
| 0.92 |
| 19.22% |
This simulation is not a real portfolio and not a guarantee of future return
This strategy is unlikely to perform as well in the near future as since March 2020. The 2020 meltdown resulted in price dislocations and exceptional opportunities in the CEF universe. However, I think a time-tested rotational strategy in CEFs has a much better chance to protect both capital and income stream against erosion and inflation than a high-yield passive investment.
For further details see:
HIPS: The Underlying Index Changed, The Issue Stays The Same