VTWO - Hoisington Investment Management Q3 2023 Review And Outlook
2023-10-20 04:30:00 ET
Summary
- Rising inflation precedes recessions, and monetary policy actions are pro-cyclical rather than counter-cyclical.
- The combination of fiscal stimulus and monetary expansion has resulted in negative net national saving, which will impair economic growth.
- The current fiscal policy is contractionary, and increasing government spending to reverse poor economic conditions will be counterproductive.
Impending Recession
The long history of business cycles illustrates that rising inflation precedes recessions. Inflation accelerations don’t just happen, they are caused. Accordingly, a more complete description of these aggregate fluctuations is that monetary accelerations precede rising inflation, which then requires monetary decelerations that inevitably lead to recessions. Thus, monetary policy actions are pro- rather than counter-cyclical and the financial cycle will continue to lead the GDP and price/labor cycle.
The process of the monetary policy reversal from the 2020-22 inflation is presently at an advanced stage, suggesting a repeat of the standard business cycle process. To be sure, the quick spread of inflation in this cycle was abetted by massive fiscal stimulus via transfer payments along with the central bank’s dramatic balance sheet expansion. These combined monetary and fiscal actions have resulted in negative net national saving, a condition that will impair economic growth well after the Fed reverses the severe monetary restraint currently in place. Indeed, the coming downturn may send net national saving even more deeply negative.
Money
As a result of the Fed’s engineered reduction in permanent reserves of the depository institutions of $1.0 trillion from the peak in early 2022, other deposit liabilities (ODL) have fallen $1.5 trillion. The fall in ODL is important because it leads bank credit implying further deterioration in bank credit. Since 2020, the de facto deposit multiplier averaged 2.0 meaning that for each one dollar loss in this reserve measure, ODL fell two dollars. Further evidence of monetary restraint is that the real Federal funds rate in September rose to the highest level since 2007. Here, the real Federal funds rate is calculated as the nominal rate less one- year inflationary expectations in the University of Michigan consumer sentiment index. Likewise, real ODL (deflated using CPI) decreased over the latest 12-, 24- and 36- month intervals, resulting in an unprecedented swing from acceleration to contraction. This is the same type of central bank reaction that has repeatedly exacerbated business cycle swings, as was so carefully documented by Nobel Laureate Milton Friedman and reinforced by the scholarly work of John Taylor of Stanford University. Thus, in responding to one crisis the Fed has created another crisis, which is a process of booming the booms and slumping the slumps.
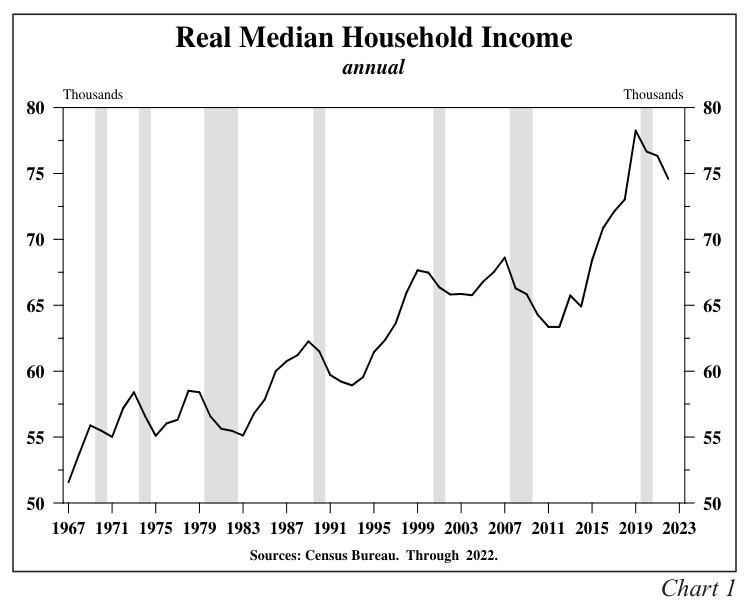
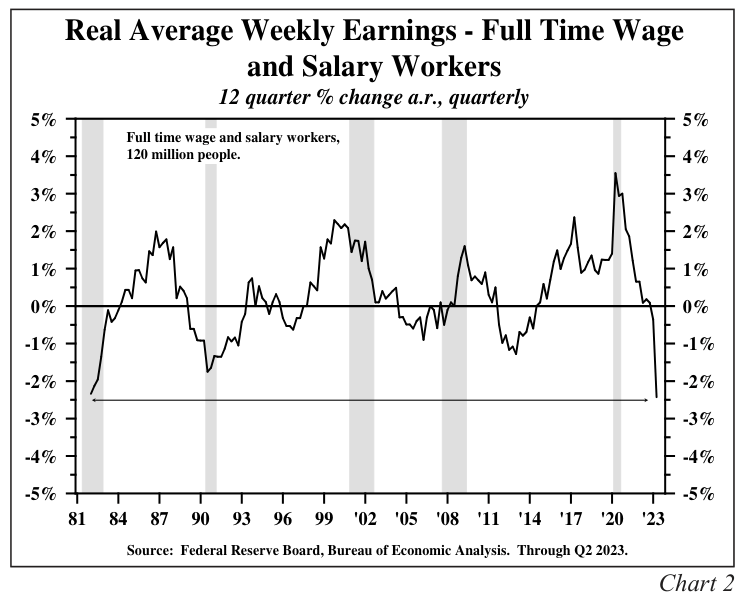
The Pandemic response of both fiscal and monetary policy makers caused the inflation rate to accelerate from a trend rate of increase of about 2% in the 2010s, to slightly over 9% in 2022. The rapid inflation affects everyone but the greatest burden falls upon the modest and low-income households. U.S. inflation adjusted median household income fell 4.7% from 2019 to 2022, bringing it back to 2018’s level (Chart 1). Real average weekly earnings of salaried and full-time hourly workers (approximately 120 million Americans) fell at a 2.4% annual rate over the latest twelve quarters (Chart 2). These income measures demonstrate the depth of the damage caused by the inflationary surge as well as the severe impact to the middle of the income spectrum. As a consequence of these income losses, housing affordability is at multi-decade lows and Cox Automotive calculates that new cars are so expensive that they are not affordable for one half of the households.
Fiscal
An analysis of the National Income and Product Accounts (NIPA), as well as financial market flows, demonstrates that fiscal policy has moved to a contractionary force on the economy.
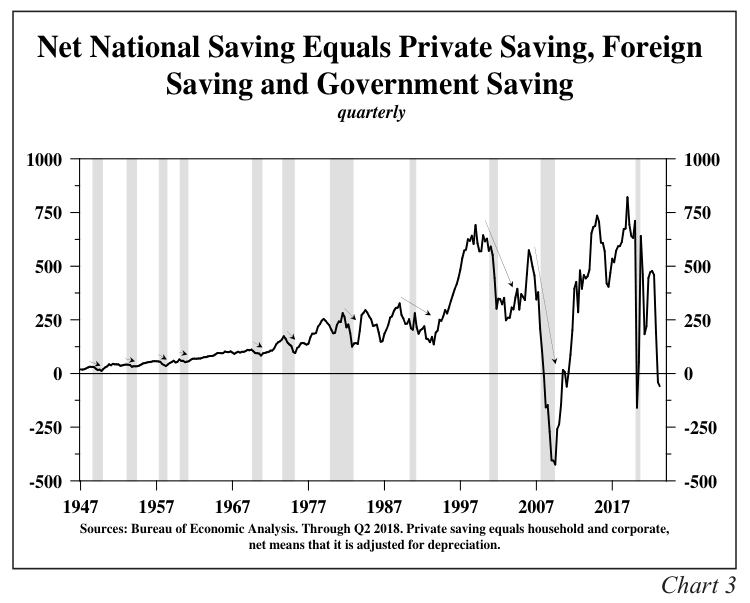
The circular flow. The circular flow is the concept that an economy’s spending equals its earnings and production. In short, GDP equals GDI. By algebraic substitution the subcomponents of GDP = GDI can also be expressed as I = S, where I is physical investment and S is total saving. For economists, the term saving is distinct from savings, and saving excludes depreciation (i.e. net saving). As such, for a country’s capital stock to increase, raising productivity, there must be an increase in investment which requires an increase in net saving. Net saving has three components: private saving (household and business), foreign saving, and government saving. Foreign saving is the inverse of the current account, meaning that a country with a current account deficit, like the U.S., has foreign saving and vice versa. In the second quarter, S was -$59 billion (Chart 3). The negative reading resulted from a government dissaving that was greater than the combined saving of the private and foreign sectors. An absolute imperative for positive S is that absolute and relative budget deficits must be reduced substantially in economic expansions. But, in FYs 2022 and 2023, the deficits totaled a massive $3 trillion or an estimated 5% of GDP per year.
Without saving, a country's capital stock does not rise on a sustained basis. When the downturn hits, private saving will fall, and government dissaving will rise as spending for built-in stabilizers surge and tax collections drop. Since 1947, S has been negative only during and immediately after the recession of the Great Financial Crisis (GFC). While remaining positive, the significant, multi-quarter decreases in S prior to the GFC were only associated with slumping real GDP and recessions. If S turns even more negative it will further worsen economic growth.
Financial Flows
The current widely held view that fiscal policy can remain stimulative and inflationary is not supported by scholarly research. The fiscal multiplier is positive for the first four to six quarters after an action. Estimates from econometric studies of highly indebted industrialized economies indicate the multiplier is negative after three years. The deficit for fiscal year (FY) 2023, which ended September 30th, was approximately $1 trillion greater than FY 2022. The private domestic nonbank sector is the source of the funding for the entire budget deficit. These private sector funds are thereby diverted from productive use in the 'positive multiplier' private sector. That is, the government borrowing "crowds out" private investment. This means that increasing 'negative multiplier' government spending to reverse poor economic conditions will be counterproductive.
Contra Normal Cyclical Characteristics
Inflation and real bank credit, since 1960, have exhibited a virtually unblemished record of lagging the GDP cycle. Yet, over the past four to five quarters they both declined while real GDP was rising. These divergences suggest that the economy is far weaker than real GDP and employment indicate and that the economy is currently far more susceptible to a downturn than is generally recognized. During the economic growth of the second half of 2022 and the first three quarters of this year, inflation slowed substantially and real bank credit contracted on a year over year basis.
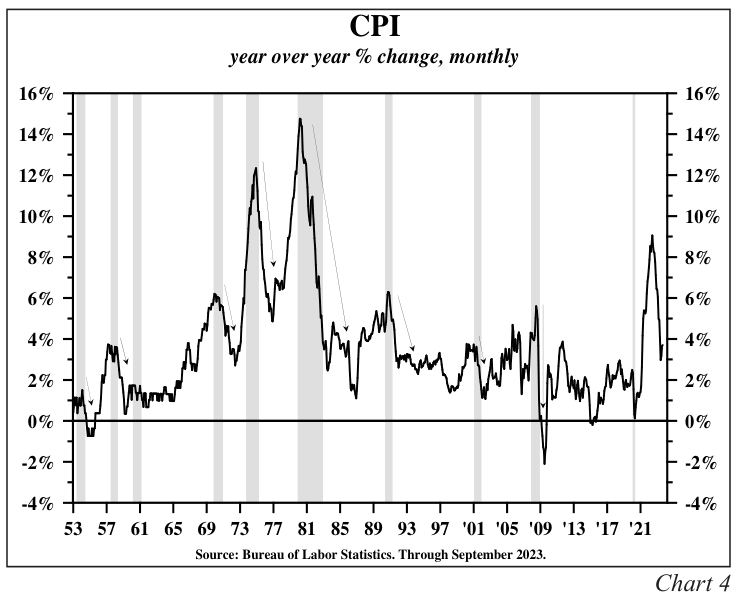
Inflation. The CPI’s twelve-month percent change fell about 540 basis points from the peak in June of 2022 to August 2023. Faster decreases have occurred since 1953, as indicated by the down arrows (Chart 4), but all of the declines were during and immediately after recessions.
Based on historical experience, inflation fell further during recessions (Table 1). In the eight recessions since 1958 (counting the two recessions of the early 1980s as one), the average low rate of increase in the CPI was 1.3%, line 9 of Table 1. If the extreme low (line 8) is eliminated the average is 1.7%, and if the extreme high and low readings are eliminated the average trough was 1.2%. This record of the historical business cycle suggests that the Fed’s 2% target is easily attainable.
Real Bank Credit. Real bank loans and investments have decreased over the latest 12-, 24- and 36-month intervals. This is entirely unprecedented for an economy where GDP is rising. Bank lending standards have risen sharply this year, but this is also a lagging indicator. The size of the increase this year is typically associated with recessions.
| End of Recession |
| Trough in CPI |
| Growth rate at trough |
| Number of months from end of recession to trough |
| 1. |
| 2. |
| 3. |
| 4. |
| 1. |
| April 1958 |
| May 1959 |
| 0.4% |
| 13 |
| 2. |
| February 1961 |
| January 1962 |
| 0.7% |
| 11 |
| 3. |
| November 1970 |
| June 1972 |
| 2.7% |
| 19 |
| 4. |
| March 1975 |
| December 1976 |
| 4.9% |
| 21 |
| 5. |
| November 1982 |
| December 1986 |
| 1.1% |
| 49 |
| 6. |
| March 1991 |
| March 1998 |
| 1.4% |
| 84 |
| 7. |
| November 2001 |
| June 2002 |
| 1.1% |
| 7 |
| 8. |
| June 2009 |
| July 2009 |
| -2.1% |
| 1 |
| 9. |
| Average |
| 1.3% |
| 26 |
The standard definition of an overall or sectoral recession is that a decline in real GDP must occur over two consecutive quarters. As measured by bank credit, the commercial banking sector has already been in recession for more than a year. Since money supply, or commercial bank checking accounts and consumer type time and savings deposits, leads bank credit, this contraction should continue.
The highest multiplier component of bank credit is commercial and industrial (C&I) loans. In real terms, this is included in the Conference Board’s index of lagging economic indicators. Yet, real C&I loans have contracted almost every month this year. When the recession brings on an even more significant advance of bankruptcies and delinquencies than has already occurred, banks will tighten credit standards even further, thereby sending business lending even lower. This is one of the reasons monetary policy is weak and ineffectual in counteracting recessions, a problem widely referred to as “pushing on a string.”
Macro Dynamics Favor Treasury Bonds
The peak in the financial cycle occurred in the fourth quarter of 2021, seven quarters ago. This is right in the middle of the five to nine quarter average monetary policy lag since World War II. Monetary conditions have steadily tightened through the end of the third quarter of 2023 and the process is widely expected to hold through the end of the year, and possibly even into 2024. Historically, these more restrictive conditions will expose, through bankruptcy and liquidation, those who took excessive risk during the monetary largess of 2020 until early 2022. Through September, the yield curve between the two- and ten-year Treasury yields has remained inverted for over twelve months. As Duke Professor Campbell Harvey’s research has shown, this barometer has, without exception, preceded each of the last eight recessions over the course of seventy years. Such developments point the economy in the direction of an economic downturn and lower inflation.
In past cycles, cost pressures, such as rising prices in oil, other commodities, and wages, all rose but the Fed still won the battle against inflation. Cost pressures in a severely constrained monetary environment serve to reduce economic activity. Oil, for example, is a highly price inelastic good. Thus, when its price rises, consumers and businesses are forced to reduce discretionary spending. When wages and other costs move higher and businesses are unable to fully pass along the higher costs then corporate profits can fall, resulting in weaker economic activity. In 2020- 21, monetary growth was off the charts. This led to much faster inflation which is now generating faster wage increases, but money conditions no longer allow them to be passed through. For these cost pressures mentioned above to result in higher inflation, the Fed would have to undertake a further round of monetary largess while inflation is still above the Fed’s official target, which they reaffirmed they would not do at their last FOMC meeting.
In the past three quarters, real GDI declined at a 0.6% annual rate while real GDP gained at a 2.3% pace, with the average of the two being just 0.8%. However, monetary and fiscal restraint intensified during this span, suggesting that the revisions are more likely to take the results lower rather than higher. In addition, the global economy, has continued to deteriorate. In the twelve months ended July, the volume of world trade declined 3.2%, a growth rate normally associated with recessions. The erosion of this very high multiplier sector indicates that the foreign sector will add to the downward force of the financial cycle. This environment will be favorable for lower Treasury bond yields.
| DISCLOSURES Hoisington Investment Management Company (HIMCo) is a federally registered investment adviser located in Austin, Texas, and is not affiliated with any parent company. The information in this market commentary is intended for financial professionals, institutional investors, and consultants only. Retail investors or the general public should speak with their financial representative. Information herein has been obtained from sources believed to be reliable, but HIMCo does not warrant its completeness or accuracy; opinions and estimates constitute our judgment as of this date and are subject to change without notice. This memorandum expresses the views of the authors as of the date indicated and such views are subject to change without notice. HIMCo has no duty or obligation to update the information contained herein. This material is intended as market commentary only and should not be used for any other purposes, including making investment decisions. Certain information contained herein concerning economic data is based on or derived from information provided by independent third-party sources. Charts and graphs provided herein are for illustrative purposes only. This memorandum, including the information contained herein, may not be copied, reproduced, republished, or posted in whole or in part, in any form without the prior written consent of HIMCo. ©2023 Hoisington Investment Management Co. |
Editor's Note: The summary bullets for this article were chosen by Seeking Alpha editors.
For further details see:
Hoisington Investment Management Q3 2023 Review And Outlook