TXN - How To Invest $1 Million In Retirement For Life-Long Income
2024-01-13 09:00:00 ET
Summary
- We outline an Income Strategy for creating a self-sufficient portfolio for retirees and income-focused investors with $1 million to generate a life-long income stream.
- We explain the benefits of generating income through dividends and distributions rather than selling shares for capital gains.
- We compare the results of backtesting an income strategy with index investing for the past 24 years, starting from the year 2000.
Why $1 Million?
In this article, our goal is to provide strategies to create a self-sufficient portfolio for retirees and income-focused investors that can generate 5% plus income, preserve the capital, and provide at least market-matching total returns.
Now, why $1 million? Well, it does not matter how much money you are investing; the strategy outlined in this article should work the same way. But we could all agree that $1 million is a good retirement milestone for so many investors.
Is $1 million sufficient to retire? There is no one answer to this. Even though it is a binary question, if you ask this question to 100 people, you are likely to get many different answers. For some, it is too little, and for others, it may be too high a target. Also, many would argue that it is not about how much you save, but how much your spending needs are. At the same time, $1 million is not the same as it used to be in the early 2000s. In the last two decades, inflation has eaten away a lot of its value. Even then, it can go a long way in providing most people with a comfortable middle-class lifestyle, assuming the availability of Social Security.
Can You Retire On Less Than $1 Million?
The simple answer is yes. One size does not fit all. It all depends on your own needs and wants. Another important factor is the place where you retire. The cost of living can greatly vary within the United States. Moreover, there are a lot of cheaper places to settle outside the U.S., but that certainly has its own challenges and is not for everyone. Retiring comfortably is determined by two factors: how much you have saved and how much your expenses are. So, it is a question of balancing the two.
So, You Have Saved $1 Million; How to Invest for Retirement?
Okay, let’s assume that you have achieved the milestone of saving $1 million in your investment accounts and are ready to retire. Certainly, it will always be helpful if you want to work for a few more years, even if it is part-time. It will help you be active as well as meet some of your expenses. Whatever you bring in after paying taxes, that much less you will have to draw from your savings. Also, if you are under 65 and not yet eligible for Medicare, it can certainly make a big difference, provided your part-time job offers medical insurance.
We will assume that you can only withdraw inflation-adjusted 4% of your capital value (at the start of retirement) every year. For a long time, most financial advisors have considered a 4% withdrawal rate as a safe way for your money to outlast you. Sure, nothing can be guaranteed, but in all probability, your money should grow at a higher rate than 4% plus inflation as long as you invest it wisely.
Why Not Invest in Broad Indexes and Sell Shares to Generate Income?
There are generally two camps: one that supports selling your shares and generating income through capital gains, and the other that supports creating an income strategy and generating needed income through dividends and distributions without ever needing to sell original shares. We obviously belong to the second camp. In our view, very few people can successfully and consistently generate income by selling shares without causing them emotional stress; most people can’t. This in itself is a good enough reason to support creating an income strategy. But there are other factors as well. With an income strategy, we can largely avoid the risk of sequential returns as well as making bad decisions under emotional stress.
Think of a retiree couple who retired at the end of 1999 and invested $1 million in the S&P 500 (SP500) (or other similar broad indexes), depending only on capital gains. They planned to withdraw inflation-adjusted $40,000 (4% withdrawal rate) annually by selling shares of their investment. In the next three years, this retiree would have depleted more than 50% of the original capital. Then, they would have recovered somewhat, but the financial crisis in 2008-2009 would have taken them back to 70% below the starting amount. Their balance would be $300,000 at the end of Feb. 2009. Even at the end of 2023, they would be left with a balance of less than $200,000. Now, sure, they could have drawn less than $40,000 or not adjusted for inflation during the tough years. All we can say is that their retirement was anything but comfortable financially. Moreover, they run the real risk of running out of money.
It is not unreasonable to believe that this would have caused enormous emotional stress and possibly forced this retiree couple to make some other financial mistakes along the way. Though we have not seen a prolonged downturn since the early 2000s (the financial crisis was only 18 months long), it can certainly happen in the future.
Plan for a Long Retirement:
The life expectancy in the U.S., as well as the rest of the world, has been going up since the 1950s, except for some recent years, when it has declined a bit in the U.S. There are good chances that an average person can live well into his/her 90’s. So, it is always preferable to plan for a long retirement so that your money outlasts you and not the other way around.
Planning for a Portfolio Model that Generates 5% Income:
Even though we are going to work with a 4% withdrawal rate, we should plan to generate income at least at a 5% rate. We do not want to end up in a situation where we are forced to sell shares to generate income. So, we want to keep some margin of safety. This extra margin of income should be kept intentionally to handle two situations. First, at times, especially during a prolonged downturn, the dividend income may fall by 10%-20% as some of the securities may cut or reduce the dividend (as happened in 2008-2009). Second, life is unknown, and there could be some exigencies once in a while, and you should be able to withdraw more than 4% during such times. But it should not be taken lightly, and the extra cash should only be used during true exigencies.
Assumptions:
- You and your spouse are 65 at the time of retirement.
- You live in an area of the United States that has an average or below-average cost of living. If you are living in a high-cost state, $1 million is not going to provide you with a comfortable retirement. Either you will need to save more, work longer, or move to a lower-cost state.
- Since you are 65, you are eligible for Medicare.
- Both you and your spouse plan to draw on Social Security at the full retirement age of 67. We assume that social security payments for the couple at 67 will be $3,600 a month. If they start withdrawing at 65, the payments could roughly be in the range of $3,000 a month, but that is an option.
- Your portfolio will target to generate 5% income annually. Any excess income of more than 4% withdrawal will be reinvested.
With the above assumptions, $1 million in investment will generate $50,000 in annual income for you, but based on the 4% withdrawal rule, you should withdraw only $40,000. The balance $10,000 should be reinvested back into the portfolio.
Total estimated annual income = $83,000 (approx.)
($40,000 of investment income + $43,200 of social-security income).
This would give you $6,933 (or roughly $7,000) of monthly income at age 67 without ever touching the original shares of principal investment (or $6,350 if drawing social security at age 65). In the meantime, since we are investing $10,000 of income back into the investment pool, it will not only help grow the capital at a decent pace but also grow the dividend yield with time. However, for the first two years (from age 65 to 67), you will need to keep an extra amount of $86,000 to fund the Social Security gap. Sure, you can withdraw from Social Security starting at 62, but it will reduce the monthly benefit amount for life. The discussion about which option may be better is rather complex and subjective. Another option would be for either you or your spouse to work part-time for the next two years.
How to Pick Investments for Your $1 Million Portfolio?
So, we will have two simple goals:
- To generate 5% income
- To grow the portfolio value by at least 4% plus the rate of inflation. Assuming the inflation rate of 3%, we should be able to grow the portfolio by at least a 7% annualized rate, but preferably higher.
With these two goals, we will select three types of securities/stocks.
- Category-1: DGI stocks of large-cap blue chip companies, averaging 4% income. These stocks are likely to provide 10% growth (including income) over a long time frame.
- Category-2: A few high-yield funds/securities, averaging 9% income. This high yield will compensate for the lower yield from categories 1 & 3.
- Category-3: A few high-growth companies or funds with minimal dividend yield but very high dividend growth. These stocks will ensure that our portfolio grows at a much higher rate than inflation.
We will allocate 50%, 30%, and 20% to the above three categories, respectively.
Table-1: Income generated
| Investment Amount |
| Income Yield % |
| Income generated (annually) |
| Bucket-1 (category 1) |
| $500,000 |
| 4% |
| $20,000 |
| Bucket-2 (category 2) |
| $300,000 |
| 9% |
| $27,000 |
| Bucket-3 (category 3) |
| $200,000 |
| 1.5% |
| $3,000 |
| TOTAL |
| $1,000,000 |
| 5% |
| $50,000 |
Bucket-1: DGI (Dividend Growth, Blue-chip, Large-cap) stocks
PepsiCo ( PEP ), NextEra Energy ( NEE ), AbbVie ( ABBV ), Home Depot ( HD ), Medtronic plc ( MDT ), American Tower ( AMT ), Verizon ( VZ ), Enbridge ( ENB ), Chevron ( CVX ), Bristol-Myers Squibb ( BMY ), Realty Income ( O ), Schwab U.S. Dividend ETF ( SCHD ).
Table-2: DGI bucket, 50% of total capital
| Ticker |
| Allocation within the bucket |
| Allocation w.r.t. Total Portfolio Value |
| Dividend /Distrib. Yield |
| Sector/ Segment |
| PEP |
| 7% |
| 3.5% |
| 3.00% |
| Consumer Staples |
| NEE |
| 7% |
| 3.5% |
| 3.01% |
| Utility-Elect. |
| ABBV |
| 7% |
| 3.5% |
| 3.82% |
| HC-Biotech |
| HD |
| 7% |
| 3.5% |
| 2.44% |
| Retail-specialty |
| MDT |
| 7% |
| 3.5% |
| 3.26% |
| HC-Med Devices |
| AMT |
| 7% |
| 3.5% |
| 3.17% |
| REIT- Cell Towers |
| VZ |
| 7% |
| 3.5% |
| 6.62% |
| Comm-Telecom |
| ENB |
| 7% |
| 3.5% |
| 7.16% |
| Energy-Midstream |
| CVX |
| 7% |
| 3.5% |
| 4.02% |
| Energy-Major |
| BMY |
| 7% |
| 3.5% |
| 4.60% |
| HC-Pharma |
| O |
| 7% |
| 3.5% |
| 5.31% |
| REIT |
| SCHD |
| 23% |
| 11.5% |
| 3.48% |
| Dividend ETF |
| TOT/AVE. |
| 100% |
| 50% |
| 4.05% |
Note: The allocation to SCHD can be split into two dividend ETFs, for example, 50% to SCHD and 50% to Vanguard High Dividend Fund ETF (VYM).
Some folks would probably ask a valid question about the duplication of some of the above stocks within the ETF SCHD. We checked for our stocks within the top-10 holdings of SCHD (the top 10 constitute nearly 44% of SCHD’s assets). We found ABBV, HD, CVX, and VZ in the top 10. However, this makes a minor difference, as the allocation of each of these stocks would increase from 3.5% to roughly 3.9% when the allocation from SCHD was accounted for.
Bucket-2 High-YIELD Funds/Stocks – 30% of Total Capital
Table-2B:
| Ticker |
| Allocation within the bucket |
| Overall allocation |
| Yield% |
| Asset Class/ Type |
| ( UTG ) |
| 10% |
| 3% |
| 8.35% |
| Utility CEF |
| ( UTF ) |
| 10% |
| 3% |
| 8.55% |
| Infra CEF |
| ( CET ) |
| 10% |
| 3% |
| 8.83% |
| US value/Pvt equity |
| ( MCI ) |
| 10% |
| 3% |
| 8.59% |
| Bonds CEF |
| ( RQI ) |
| 10% |
| 3% |
| 7.86% |
| Real-Est CEF |
| ( BST ) |
| 10% |
| 3% |
| 9.04% |
| TECH equity |
| ( JEPI ) |
| 10% |
| 3% |
| 8.44% |
| Income ETF |
| ( USA ) |
| 10% |
| 3% |
| 9.48% |
| US market equity |
| ( MPLX ) |
| 10% |
| 3% |
| 9.16% |
| Energy- MLP |
| ( ARCC ) |
| 10% |
| 3% |
| 9.41% |
| BDC |
| TOT/AVE. |
| 100% |
| 30% |
| 8.77% |
Bucket-3: High-growth (Blue-chip, Large-cap) stocks - 20% of Total Capital
Table-2C:
| Ticker |
| Allocation within the bucket |
| Overall allocation |
| Yield% |
| Sector/ Segment |
| ( MSFT ) |
| 10% |
| 2% |
| 0.82% |
| IT-Software |
| ( V ) |
| 10% |
| 2% |
| 0.80% |
| Business Srvc. |
| ( NXPI ) |
| 10% |
| 2% |
| 1.97% |
| IT-Semi |
| ( UNH ) |
| 10% |
| 2% |
| 1.40% |
| Healthcare Ins. |
| ( TXN ) |
| 10% |
| 2% |
| 3.15% |
| IT-Semi |
| ( MS ) |
| 10% |
| 2% |
| 3.65% |
| Financials |
| (E O G) |
| 10% |
| 2% |
| 3.02% |
| Energy |
| ( RF ) |
| 10% |
| 2% |
| 4.91% |
| Regional Bank |
| ( INTU ) |
| 10% |
| 2% |
| 0.61% |
| IT-Software |
| ( PH ) |
| 10% |
| 2% |
| 1.31% |
| Industrials |
| TOT/AVE. |
| 100% |
| 20% |
| 2.16% |
When we combine these three buckets into one portfolio, we will have a total of 32 securities that include:
Table-2D:
| Type of Security |
| Allocation % |
| 1 ETF (dividend ETF) |
| 11.5% |
| 1 ETF (Income ETF) |
| 3% |
| 1 BDC |
| 3% |
| 1 MLP |
| 3% |
| 2 REITs |
| 7.0% (3.5% each) |
| 7 CEFs |
| 21.0% (3% each) |
| 9 Individual dividend stocks |
| 31.5% (3.5% each) |
| 10 Individual high-growth stocks |
| 20% (2% each) |
Here is the combined portfolio:
TABLE -3:
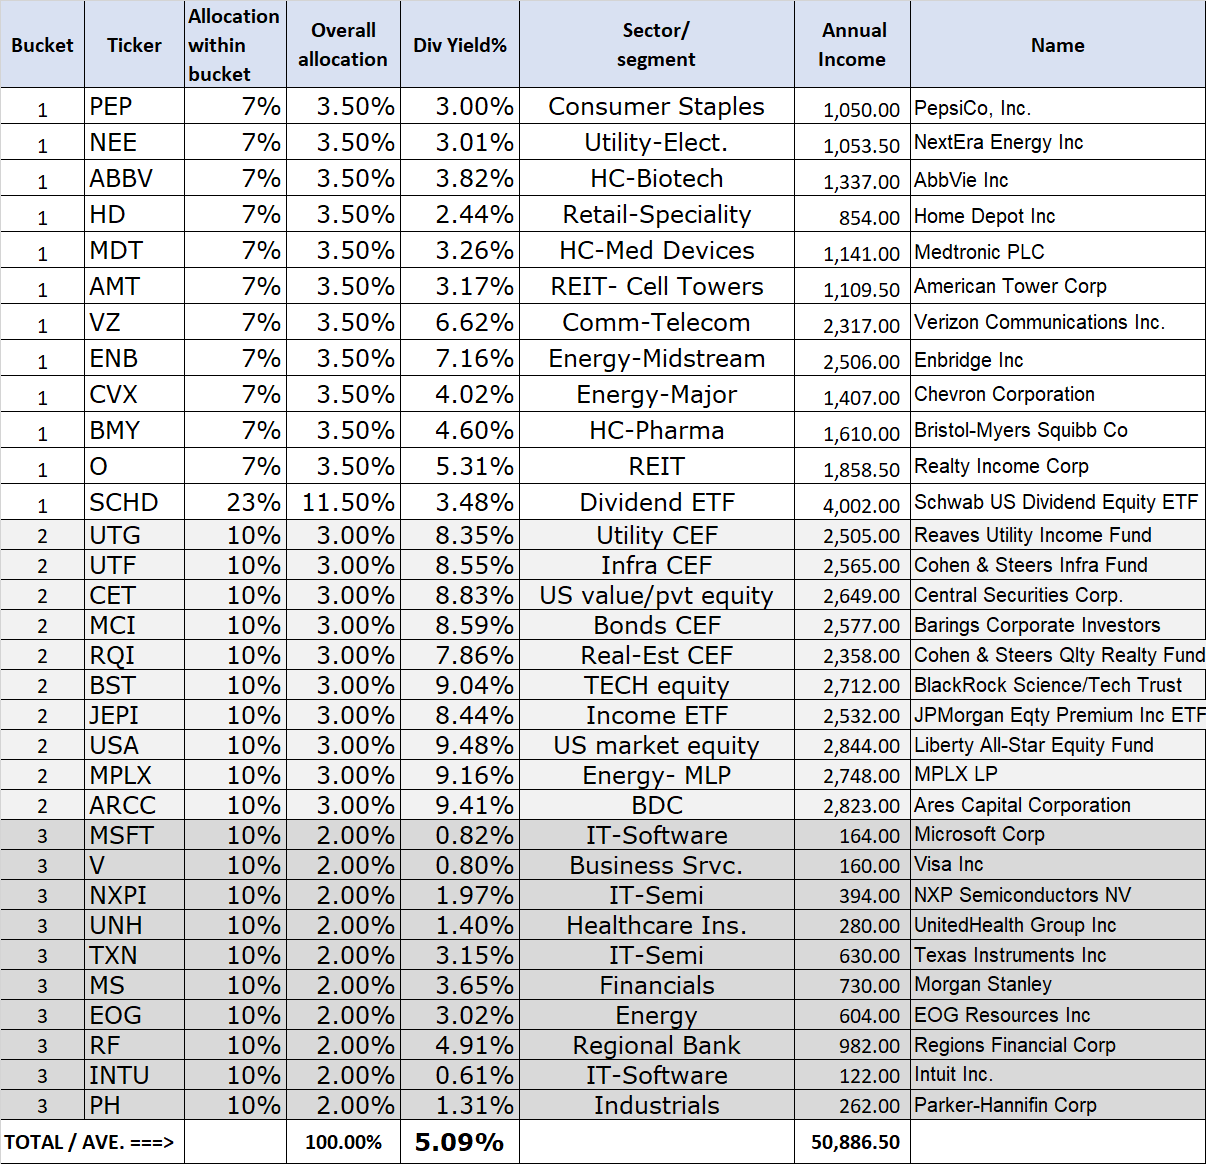
Backtesting of the combined portfolio over the last 17 years:
For any backtesting to be meaningful, it should ideally span more than 25 years. However, that becomes a very difficult task (if not impossible) with most portfolios due to the limited history of many securities. So, we targeted a slightly more modest goal of backtesting this portfolio of 32 securities over the last 17 years, starting from Jan. 2007 until Dec. 2023. However, we still had to make a few replacements while going prior to the year 2013. We believe the replacements were very similar to the original securities and would not have any significant deviation in results. The following replacements were made for the 2007-2012 period.
- The ETF SCHD was replaced by the Vanguard High Dividend Fund ETF ((VYM)).
- ABBV was replaced by its parent company, Abbott Labs (ABT).
- Visa was replaced by Mastercard (MA).
- BST was replaced with Columbia Seligman Technology Fund ( STK ) for the years 2009-2012, and then STK was replaced with Invesco QQQ Trust ( QQQ ) for the years 2007 and 2008.
- Semiconductor stock NXPI was replaced with Texas Instruments (TXN).
We see in the chart below that the 32-securities portfolio outperformed the S&P 500 by a couple of percentage points, even though it has not been easy to beat the S&P 500 in recent years. Also, the max drawdown of the model portfolio was also lower for most periods. So, we would call the performance reasonable and satisfactory. Please remember the S&P 500 is not an easy index to hold and draw income from it, as it only provides income in the range of 1.5% to 1.75%.
Chart-1:
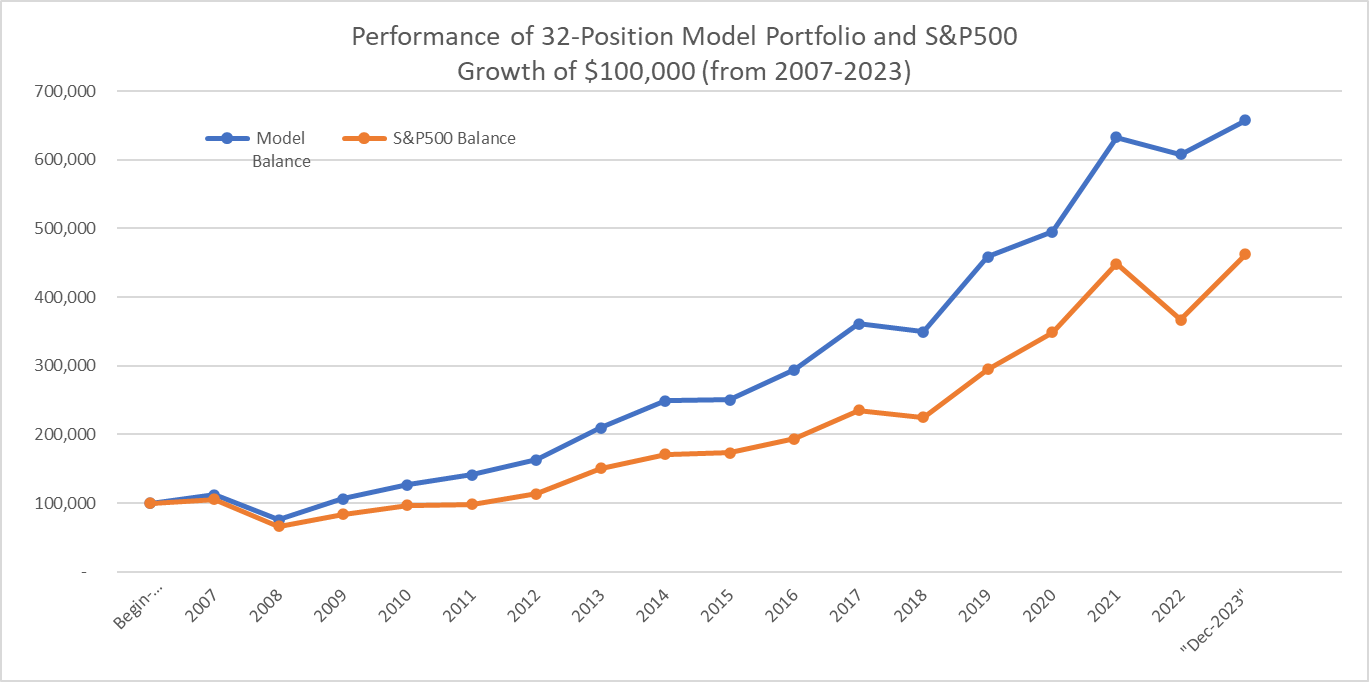
Backtesting from Jan. 2000 to Dec. 2023 (24 years):
As we said earlier, it is not easy to test all the way to the year 2000. We attempted anyway but needed to make many more replacements, and some of them were not perfect. So, we made the following replacements:
- The ETF SCHD (or VYM) was replaced by Fidelity dividend mutual fund, FEQTX.
- CEFs UTG and UTF were replaced with the Fidelity Utility mutual fund FSUTX.
- The CEF RQI was replaced with the Fidelity Real-Estate mutual fund, FRESX.
- The BDC ARCC was replaced with the Fidelity Capital & Income mutual fund FAGIX.
- Also, Visa (or Mastercard) was replaced with Fidelity Growth mutual fund FBGRX.
By making these changes, the income yield fell to 4.1% (from 5.1%), which is still acceptable as it is more than our withdrawal rate. Though we could not check if the income rate was at a similar level back in the year 2000, we believe, in all probabilities, it would have been pretty close.
Now, we tested this new portfolio from Jan. 2000 to Dec. 2023, assuming that our retiree investor never reinvested the dividends (as they needed income all along). So, without reinvesting dividends (roughly 4% but growing with time), the original amount of $1 million grew to $4.5 million. The lowest amount it fell to was $780,000 in early 2003. It also fell to $880,000 in early 2009, but these drawdowns are not scary at all compared to what they were with the S&P 500.
For comparison with the S&P 500, we ran the test, assuming that from each of the portfolios, we started with annual withdrawals of $40,000 in the year 2000 and adjusted this amount upwards for inflation each year. In fact, the S&P 500 was left with a balance of only $300,000 at the end of 2023, compared to nearly $6 million for the model portfolio.
Chart-2:
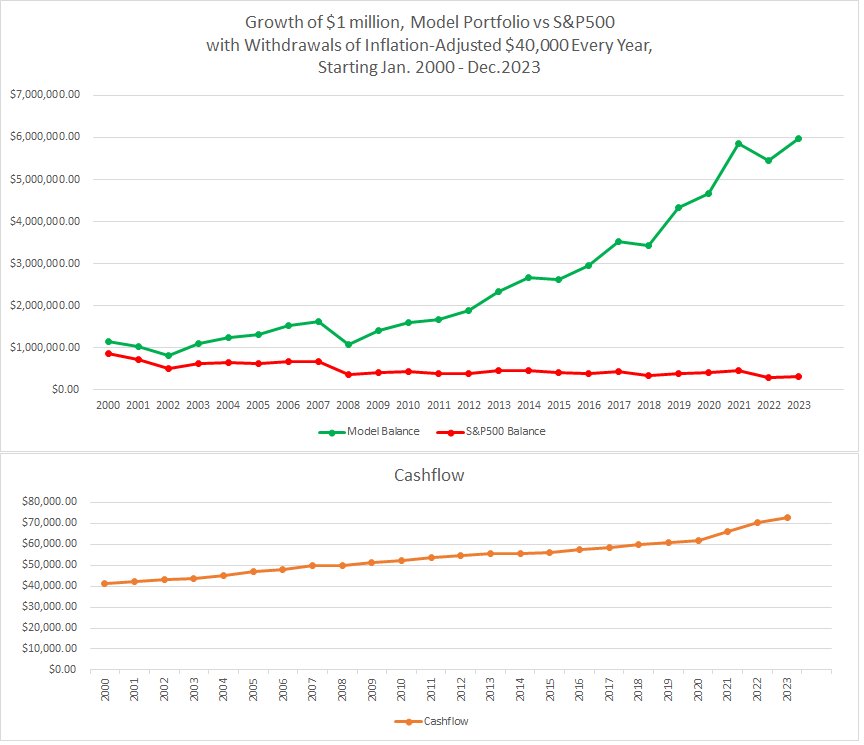
Now, to remove any survivor bias, we replaced two DGI stocks in our portfolio with two other stocks that were popular in the early 2000s but did not do well over the years. We replaced PEP with GE (General Electric) and NEE with BAC (Bank of America). It dented the performance of the model portfolio to some extent, and the balance at the end of the period was reduced to $5 million (from $6 million). Then, we replaced VZ with T (AT&T), and there was not a significant difference (the balance dipped from $5 million to $4.9 million).
Concluding Thoughts:
Now, by way of backtesting, we are quite convinced that the above portfolio of 32 securities was able to serve both our objective of providing 5% plus income and in excess of 10% total returns (in fact, 11.7%) over 17 years. However, we recognize these are only backtesting results, and future results are always going to be different, but it does provide us enough confidence in the income strategy that it should do reasonably well in comparison to the broader market indexes while not skimping on the income front at all. Sure, we should monitor the portfolio periodically, at least once every three months, to see if anything fundamentally changes with any of our individual stocks. Since we have only selected large-cap, blue-chip, dividend-paying, and relatively safe companies, this portfolio should not need changes very frequently.
For further details see:
How To Invest $1 Million In Retirement For Life-Long Income