NIMC - HTD: Good Fund But Be Ready For A Distribution Cut
2023-11-07 07:55:10 ET
Summary
- The John Hancock Tax-Advantaged Dividend Income Fund aims to provide high current income and capital gains through investments in common equity.
- The fund has underperformed the S&P 500 Index over the past two months but has only lost 5.14% for investors when considering distributions.
- The fund primarily invests in utilities and companies with stable finances, but its leverage is concerning in the current interest rate environment.
- The fund appears to be failing to generate sufficient returns to cover its distributions, which could force it to cut its distribution in the near future.
- The fund is currently trading at a reasonably attractive discount to its intrinsic value.
The John Hancock Tax-Advantaged Dividend Income Fund (HTD) is a closed-end fund that specializes in providing its investors with an exceptionally high level of current income. The fund does this task fairly well, as its 9.26% current yield is respectable even in today's high-yield environment. However, the fund's yield is not nearly as impressive as some of the funds that we have discussed over the past few weeks as some of them sport double-digit yields at their current levels. This fund is very different from these other funds though because it does not invest primarily in fixed-income securities. Rather, the John Hancock Tax-Advantaged Dividend Income Fund invests mostly in common equity, which allows it to boast a much higher capital gains potential than some of its peer funds. After all, common equities are actually riskier than fixed-income securities so they need to have a higher potential total return, or no investor would ever purchase them. This fund aims to deliver the high level of income that can be obtained by investing in fixed-income securities without sacrificing the total return potential inherent in common equity. It seems to do that reasonably well.
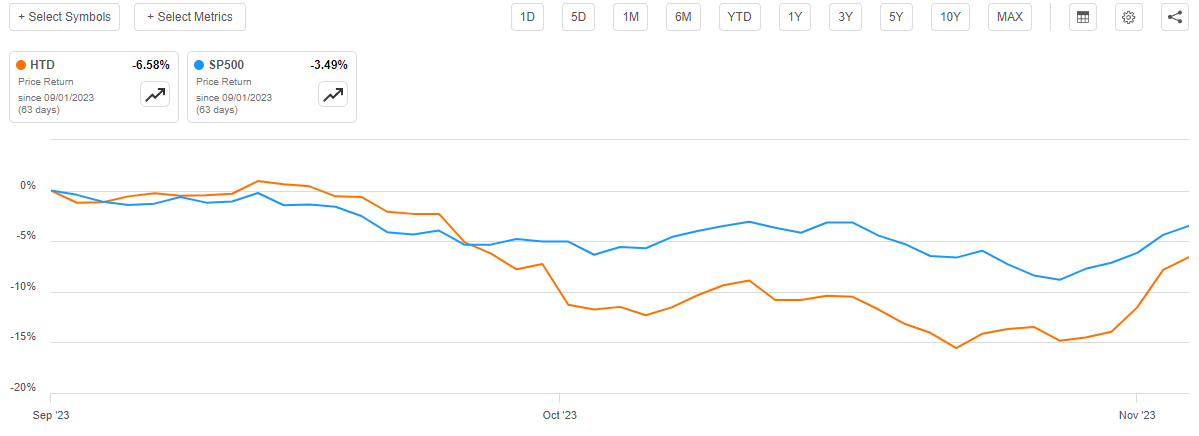
As regular readers will no doubt recall, we last discussed this fund in early September. Since that time, the fund has delivered a rather disappointing performance as the shares are down 6.58%:
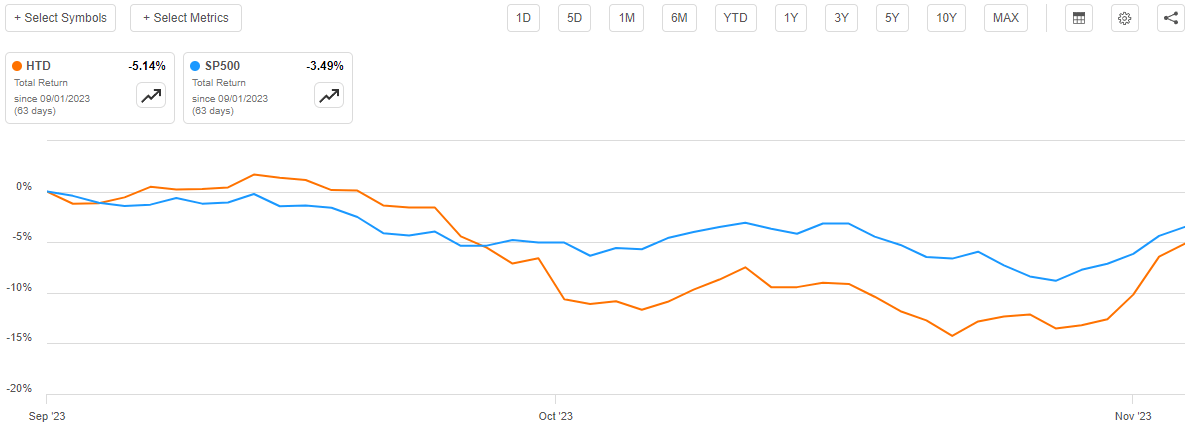
As we can see, the fund has underperformed the S&P 500 Index (SP500) since the start of September. However, one of the characteristics of closed-end funds is that these entities tend to pay out virtually all of their investment returns to the investors in the form of distributions. That is not the case with indices or index funds. As such, we need to consider the distributions paid out by the fund when evaluating its performance. This gives us a much better idea of what the fund's investors actually experienced. As we can see here, investors in this fund only lost 5.14% over the past two months. That was still worse than an investment in the S&P 500 performed, but not by very much:
The fact that the fund underperformed the broader market index may be off-putting to some investors. However, most people who purchase a fund like this are more interested in receiving a high level of income from their assets than they are in outright beating the market. After all, ultimately it is income that we use to pay our bills and finance the luxuries that we all want to enjoy. That is what this fund specializes in.
Let us investigate this fund further as a few things could have changed in the past two months.
About The Fund
According to the fund's website , the John Hancock Tax-Advantaged Dividend Income Fund has the primary objective of providing its shareholders with a high level of after-tax total return primarily stemming from dividend income and capital appreciation. This makes a lot of sense given that the fund's portfolio is primarily invested in common stock, although it does have a significant minority weighting to preferred stock and bonds:
CEF Connect
As I have mentioned in various previous articles, common stock is by its very nature a total return vehicle. Investors purchase common stock both because they want to receive an income in the form of dividends as well as capital gains as the issuing company grows and prospers. It is a bit of a different story for preferred stock and bonds. In the case of bonds, there are no net capital gains over their lifetimes as they are both issued and redeemed at face value. Preferred stocks are basically bonds with no maturity date, but they do have a face value at which the issuing company might have the option to buy them back. These securities both deliver the overwhelming majority of their investment returns in the form of direct payments to the shareholders and provide the fund with a higher level of income than it can obtain by investing in common stock alone. After all, both bonds and preferred stock usually have a higher yield than the common equity of the issuing entity.
We can see the fact that preferred stock usually has a higher yield than common equity by looking at the dividend yields of the largest positions in the fund. Here are the fund's top ten holdings:
Here are the yields of the common equity of each of these companies:
| Company |
| Current Yield |
| The Williams Companies ( WMB ) |
| 4.96% |
| BP PLC ( BP ) |
| 4.82% |
| The Southern Company ( SO ) |
| 3.98% |
| CenterPoint Energy ( CNP ) |
| 2.92% |
| American Electric Power Company ( AEP ) |
| 4.42% |
| Duke Energy ( DUK ) |
| 4.54% |
| Ameren Corp. ( AEE ) |
| 3.21% |
| NiSource, Inc. ( NI ) |
| 3.89% |
| OGE Energy ( OGE ) |
| 4.75% |
| Entergy Corporation ( ETR ) |
| 4.60% |
As of the time of writing, the ICE Exchange-Traded Preferred and Income Securities Index ( PFF ) has a thirty-day SEC yield of 6.81%. Thus, we can clearly see that in most cases preferred stock will boast a higher yield than common equity. The presence of the preferred stock in this fund's portfolio therefore provides it with a level of income that is far in excess of what it would get if its portfolio was entirely invested in common equity.
There have been very few changes since the last time that we discussed this fund. In fact, the only major change is that Black Hills Corporation ( BKH ) was removed and replaced with OGE Energy. That is a fairly minor change as it just represents the replacement of one utility with another. Other than that, the only thing that we really see different between this top holdings list and the one from two months ago is that some of the weightings have changed. In particular, BP's weight has increased substantially. However, that could simply be the result of one company performing better than another in the market and does not necessarily represent the fund doing much active trading in order to change its weightings. This fund only has an 11% annual turnover, so that suggests that it is not really doing any trading at all. That is one of the lowest turnovers that I have ever seen among any fund, regardless of its type. Thus, it appears that this fund is mostly using a buy-and-hold strategy and is not incurring much in the way of trading costs.
A quick look at the fund's largest positions suggests that it is primarily investing in utilities and companies that are very much like utilities. For example, the Williams Companies has remarkably stable operating cash flows over time. This chart shows this company's annual operating cash flow over the past ten years:
We do see a great deal of growth in the company's operating cash flow, but we also see that they are usually reasonably stable over time. They do not increase and decrease wildly like some other companies experience. The same general thing can be said for the utility companies that make up most of the rest of the fund's largest positions. The notable exception is, of course, BP. This chart shows BP's annual operating cash flows over the past ten years:
As we can clearly see, this company's cash flows fluctuate wildly with energy prices, which makes it something of an outlier compared to the other more stable companies in this fund. It appears that this fund's basic strategy is to invest in companies that enjoy remarkably stable finances and can pay out a significant percentage of their cash flows to the investors in the form of dividends while still being able to deliver a moderate amount of growth. Utilities generally fit the bill perfectly for this.
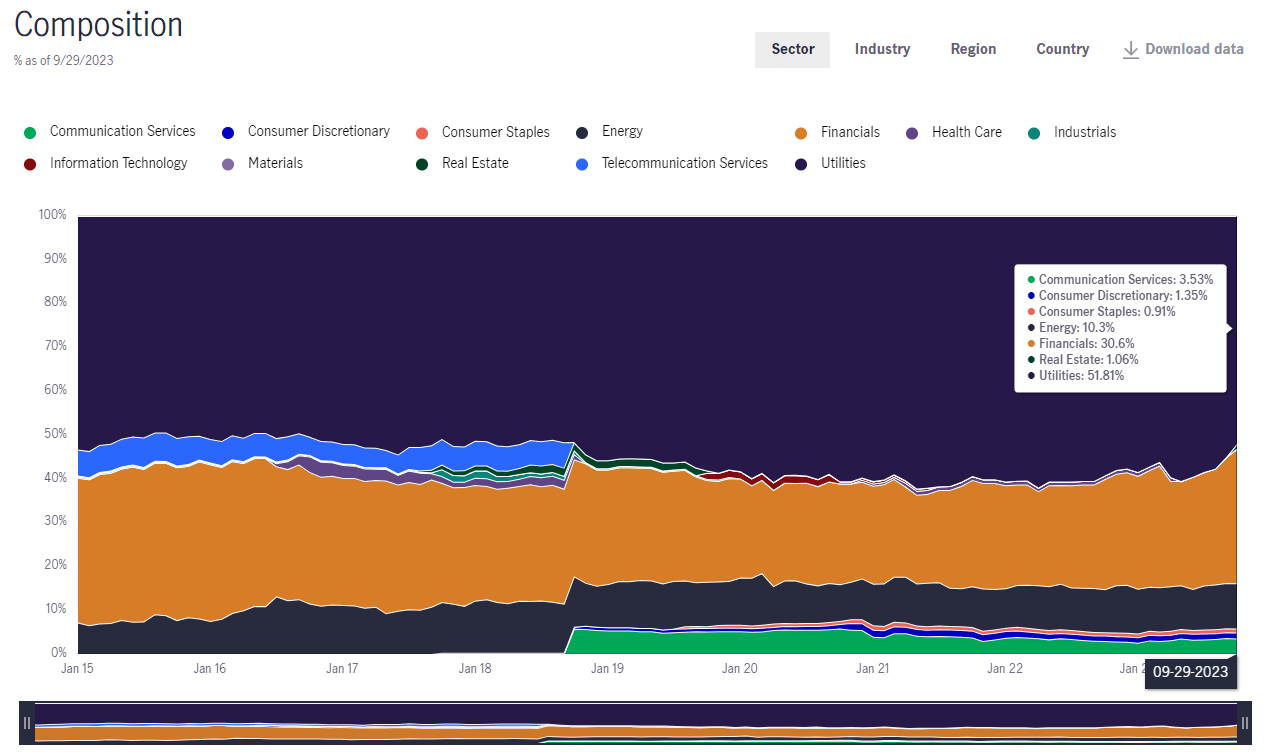
In fact, we can see here that 51.81% of the portfolio is invested in utility companies:
Utilities therefore enjoy a far greater weighting than any other sector. However, the fund's allocation to utilities is lower than we have seen in the past. As I pointed out in my June update article on this fund, utilities comprised 59.26% of the fund's holdings as of May 31, 2023. Energy and especially financials have increased in weight since that time, which explains the reduction in utilities.
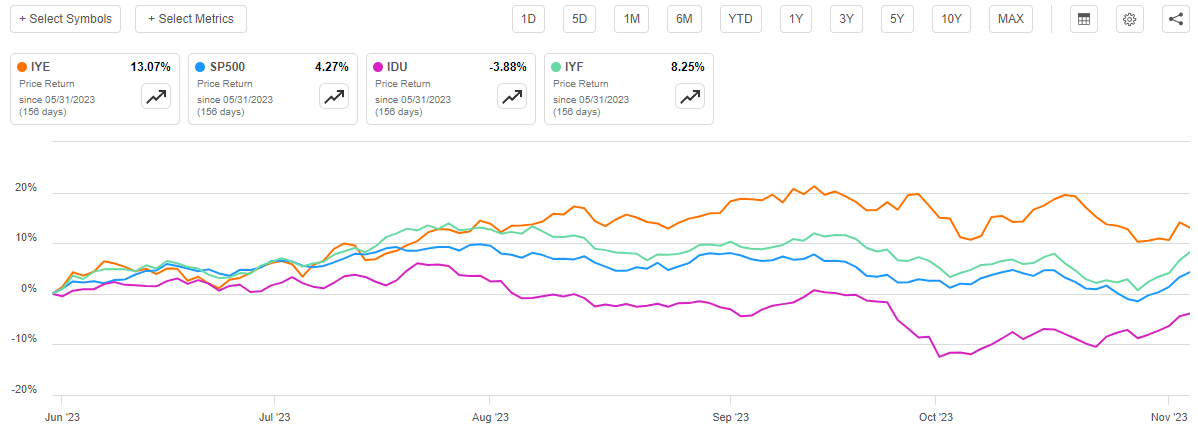
That change in weightings can easily be explained by looking at the relative performance of each of these sectors. As we can see here, the iShares U.S. Energy ETF ( IYE ) and the iShares US Financials ETF ( IYF ) have both substantially outperformed both the S&P 500 Index and the U.S. Utilities Index ( IDU ) since May 31:
Thus, the fund's weighting in these two sectors would increase over time even considering that this fund seems to engage in very minimal trading. That is exactly what we see here.
Overall, the fund's focus on investing in financially stable companies that generally grow their dividends over time is one that should appeal to most income-focused investors. After all, these companies should be a bit safer than many others if the United States does enter into a recession in the next year. The market appears to be expecting that scenario right now, as that is the only reason why the Federal Reserve would cut interest rates in the near term (this is the reason why stocks just delivered their best week of the year).
Leverage
One of the characteristics of closed-end funds is that they tend to employ leverage as a method of boosting the effective total return and yield of their portfolios. I explained how this works in my previous article on this fund:
In short, the fund borrows money and then uses that borrowed money to purchase dividend-paying common and preferred stocks. As long as the interest rate that the fund pays on the borrowed money is less than the return that it receives from the purchased assets, the strategy works pretty well to boost the effective yield of the portfolio. This fund is capable of borrowing money at institutional rates, which are considerably lower than retail rates, so this will usually be the case.
However, the use of debt in this fashion is a double-edged sword. This is because leverage boosts both gains and losses. As such, we want to ensure that the fund is not employing too much leverage, as that would expose us to too much risk. I generally do not like to see a fund's leverage exceed a third as a percentage of its assets for this reason.
As of the time of writing, the John Hancock Tax-Advantaged Dividend Income Fund has levered assets comprising 37.39% of its portfolio. This is well above the one-third level just mentioned, and it is also above the 36.50% leverage ratio that the fund had the last time that we discussed it.
This is concerning, particularly in today's high-interest rate environment. As I pointed out in a previous article on a different fund, we have started to see funds that focus on utility companies being forced to cut their distributions due to rising interest rates. The rising interest rates boost the fund's expenses and unfortunately, utility stocks have not been performing well lately. That situation makes it hard for a leveraged fund to maintain its distribution even though the companies that it holds have been able to hold their dividends steady.
Fortunately, the John Hancock Tax-Advantaged Dividend Income Fund is less heavily focused on utilities than the Duff & Phelps Utility & Infrastructure Fund ( DPG ), which is the fund that was forced to cut its distribution for the first time ever. However, this does not mean that the high leverage will not catch up with the fund so we should be cautious about its leverage.
Distribution Analysis
As mentioned earlier in this article, the primary objective of the John Hancock Tax-Advantaged Dividend Income Fund is to provide its investors with a high level of total return through a combination of current income and capital appreciation. In order to achieve this objective, the fund invests in a portfolio of companies that deliver a significant percentage of their total return via dividends paid to the investors. Many of these companies also increase their dividends over time, which frequently causes the stock price to increase and provides the fund with some capital gains. The fund collects all of the payments that it receives and then boosts them with a layer of leverage. It pays out the investment profits to its investors, net of its own expenses. We might expect that this would provide the fund's shareholders with a very respectable yield.
This is indeed the case as the John Hancock Tax-Advantaged Dividend Income Fund pays a monthly distribution of $0.1380 per share ($1.656 per share annually), which gives it a 9.26% yield at the current price. This fund has a very respectable distribution history, as it has been raising the payout consistently since 2009:
This is a far better and much more attractive distribution history than many other funds possess, which positions it well to appeal to anyone who is seeking to earn a high level of current income from the assets in their portfolios. This income can, of course, be used to pay bills or finance other expenses. However, there are very few funds that have been able to sustain their distributions considering the market turbulence over the past two years. We should investigate this one quite closely to see if this fund is truly able to sustain this distribution or if it is paying out more than it can actually afford and destroying its net asset value in the process. After all, no fund can sustainably pay out more than it actually generates from its investments over the long term.
Unfortunately, we do not have an especially recent document that we can consult for the purpose of our analysis. As of the time of writing, the fund's most recent financial report corresponds to the six-month period that ends on April 30, 2023. Thus, this report will not include any information about the fund's financial performance over the past six months. That is a shame because that period included a number of events that are particularly relevant to a fund such as this. For example, the market was generally very optimistic through mid-July that rate cuts would soon be coming, and the value of many assets was bid up. This failed to materialize, and the market sold off utility stocks while buying energy. As this fund is most heavily weighted towards utilities, this almost certainly caused it to eat some realized or unrealized losses that will not be reflected in this report. Thus, it is possible that this report will make the fund's distribution look more sustainable than it actually is.
During the six-month period, the John Hancock Tax-Advantaged Dividend Income Fund received $23,802,724 in dividends along with $7,686,819 in interest from the assets in its portfolio. We need to subtract out the money that it had to pay in foreign withholding taxes, which gives the fund a total investment income of $31,344,633 during the period. It paid its expenses out of this amount, which left it with $15,741,844 available for the shareholders. This was, unfortunately, nowhere close to enough to cover the $30,296,719 that the fund actually paid out in distributions during the period. At first glance, this is almost certainly going to be concerning as the fund was unable to fully cover its distribution out of net investment income.
However, there are other methods through which the fund can obtain the money that it needs to cover its distributions. For example, it might have been able to realize some capital gains that can be paid out. It generally failed in this task, however, as the fund reported net realized losses of $27,273,338 during the period. These realized losses were partially offset by $26,455,493 in net unrealized gains, but as we can clearly see, the net unrealized gains were not sufficient to fully offset the realized losses. Overall, the fund's assets declined by $15,162,787 after all inflows and outflows during the period are included. Thus, the fund failed to cover its distribution.
Unfortunately, it seems somewhat unlikely that things have improved for the fund. As we can see here, the fund's net asset value declined by 8.46% over the past six months:
If the fund was actually generating sufficient investment returns to cover its distributions, its net asset value would not decline. We can see that the fund probably did okay through late July or so but then its distributions started exceeding the fund's investment returns. We will not know for sure until the fund releases its full-year annual report around the end of this year, but it appears that this fund is failing to fully cover its distribution and may be forced to cut the payout if it does not correct this problem shortly.
Valuation
As of November 2, 2023 (the most recent date for which data is available as of the time of writing), the John Hancock Tax-Advantaged Dividend Income Fund has a net asset value of $19.80 per share but the shares currently trade for $17.89 each. This gives the fund's shares a 9.65% discount on net asset value at the current price. This is a reasonable discount, but it is nowhere near as attractive as the 13.35% discount that the shares have had on average over the past month. Thus, it might be possible to get in at a better price in the near future but that is probably only likely if the market swings downward in the near future. The current price is not altogether unreasonable though if you want to add the fund to your portfolio.
Conclusion
In conclusion, the general strategy that is employed by the John Hancock Tax-Advantaged Dividend Income Fund is quite reasonable. The fund buys financially stable companies that have a history of delivering relatively slow growth over time while boosting their dividends. Thus, the fund tries to earn steady income growth along with the capital gains that should accompany the growth and prosperity of the companies in the portfolio. This strategy worked pretty well up until last year, and it has unfortunately been struggling to sustain its distribution. It may be best to be cautious here, although this fund does have a better strategy than most of its peers. It just might have to cut the payout at some point if conditions do not improve in the near future.
For further details see:
HTD: Good Fund, But Be Ready For A Distribution Cut