IBB - IBB: Targeting A Buy Point Heading Into Year-End
2023-11-21 21:11:32 ET
Summary
- Tech-related stocks have performed poorly in 2023, with small-sized funds experiencing even worse losses.
- The iShares Biotechnology ETF and the SPDR S&P Biotech ETF have performed similarly so far in 2023.
- IBB is a large ETF with exposure to the biotech industry, but its performance has lagged behind the broad market.
- I highlight key price levels to watch on this fund, which now trades at less than 17 times earnings.
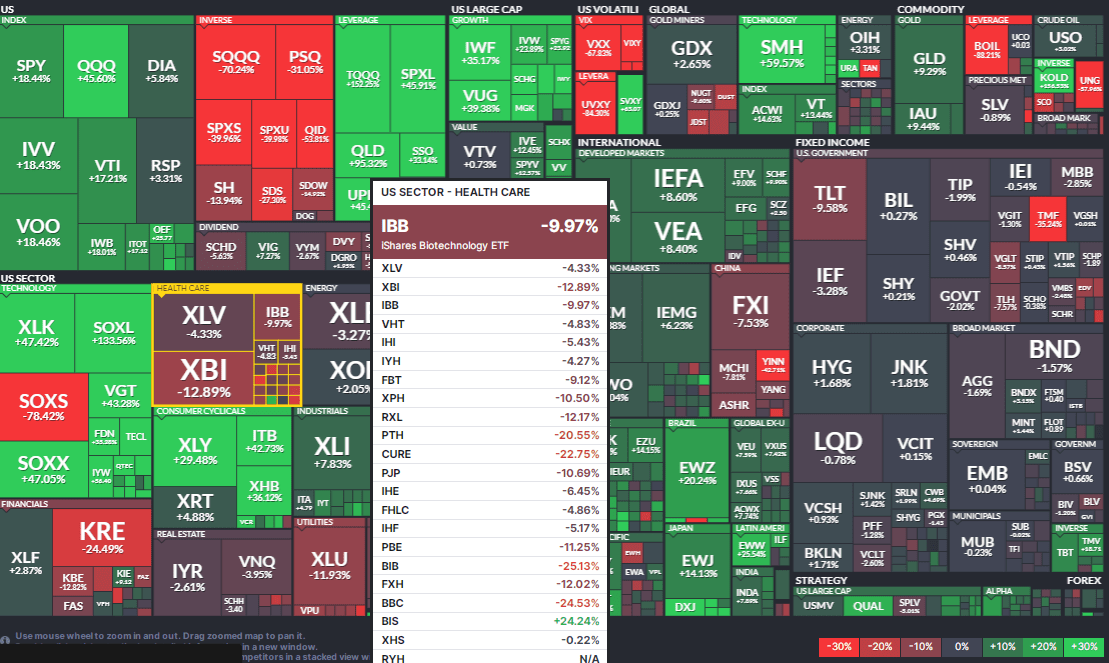
Venture away from tech-related stocks, and you are going to find a healthy dose of red on your 2023 performance screen. Relative losses are even worse for small-sized funds. Interestingly, both the cap-weighted iShares Biotechnology ETF (IBB) and the equally weighted SPDR S&P Biotech ETF (XBI) have performed about the same so far in 2023, illustrated by the ETF performance heat map below.
I have been keeping a watchful eye on IBB, and I reiterate a hold rating, but will later point out one crucial price point to monitor for a timed entry.
YTD ETF Performance Heat Map
According to the issuer , IBB offers investors exposure to the biotech industry within the broad US stock market. Targeting no more than a few hundred individual companies, it is a liquid ETF that allows investors to express an industry view without having to take much stock-specific risk in the volatile biotech area. It invests in growth and value stocks of companies across diversified market capitalization.
Despite significantly lagging the broad market this year, IBB is a large ETF with more than $6.5 billion in assets under management as of November 20, 2023. The fund pays a paltry 0.27% trailing 12-month dividend yield , and share-price momentum is downright dreadful, according to Seeking Alpha ETF Grades. Still, it is not an overly costly product with an annual expense ratio of 0.45% and liquidity is very strong - average daily volume is near 1.9 million shares and IBB’s 30-day median bid/ask spread is narrow at just two basis points, per iShares. Finally, IBB is quantitatively a highly risky fund, which makes intuitive sense given its narrow industry concentration.
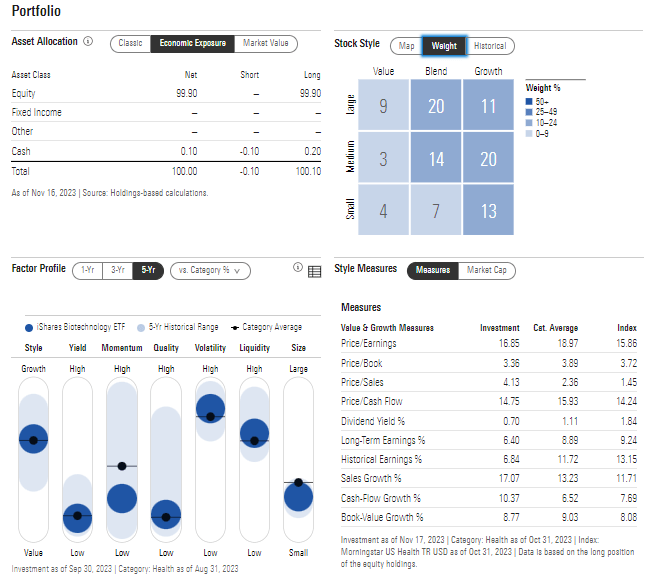
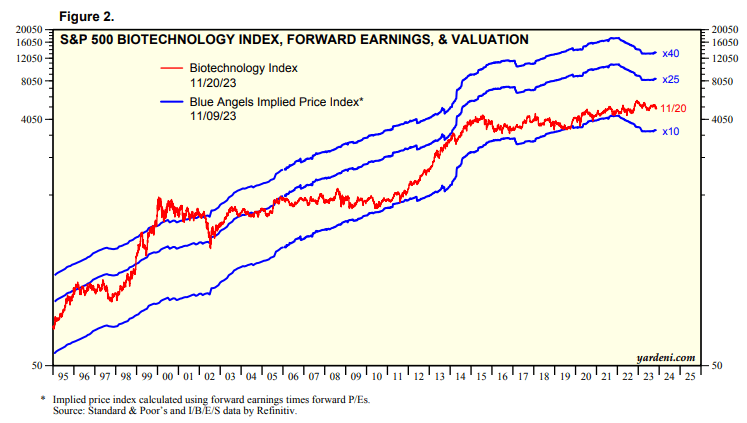
Digging into the portfolio, the 2-star, bronze-rated ETF by Morningstar plots on the growth side of the style box, but there is ample diversification across market caps. That has been a negative feature in 2023 given the sharp underperformance among value equities and small-sized stocks. The allocation’s price-to-earnings ratio is rather attractive at less than 17 times earnings, but that is not all that expensive when looking back over the past 30 years.
IBB: Portfolio & Factor Profiles
Biotech Industry Valuation History
Unlike its equally weighted counterpart, IBB is top-heavy. The top 10 holdings comprise more than half of the fund. What’s more, the largest 4 positions total more than one-third of the ETF. A bright spot I found when researching IBB is that its dividend growth history is not bad - the payout was under $0.20 in 2018 but has since more than doubled as of FY 2022.
IBB: Top Holdings, Dividend Trends
Seeking Alpha
Seasonally, we never did see a summer rally that historically has played out - I was on the lookout for such a move when I last covered the ETF in the first half of the year. According to data from Equity Clock , though, the mid-November through mid-January stretch has also been a good time to be overweight the fund. So, seasonal tailwinds are apparent.
IBB: Seasonal Strength Through mid-January
Equity Clock
The Technical Take
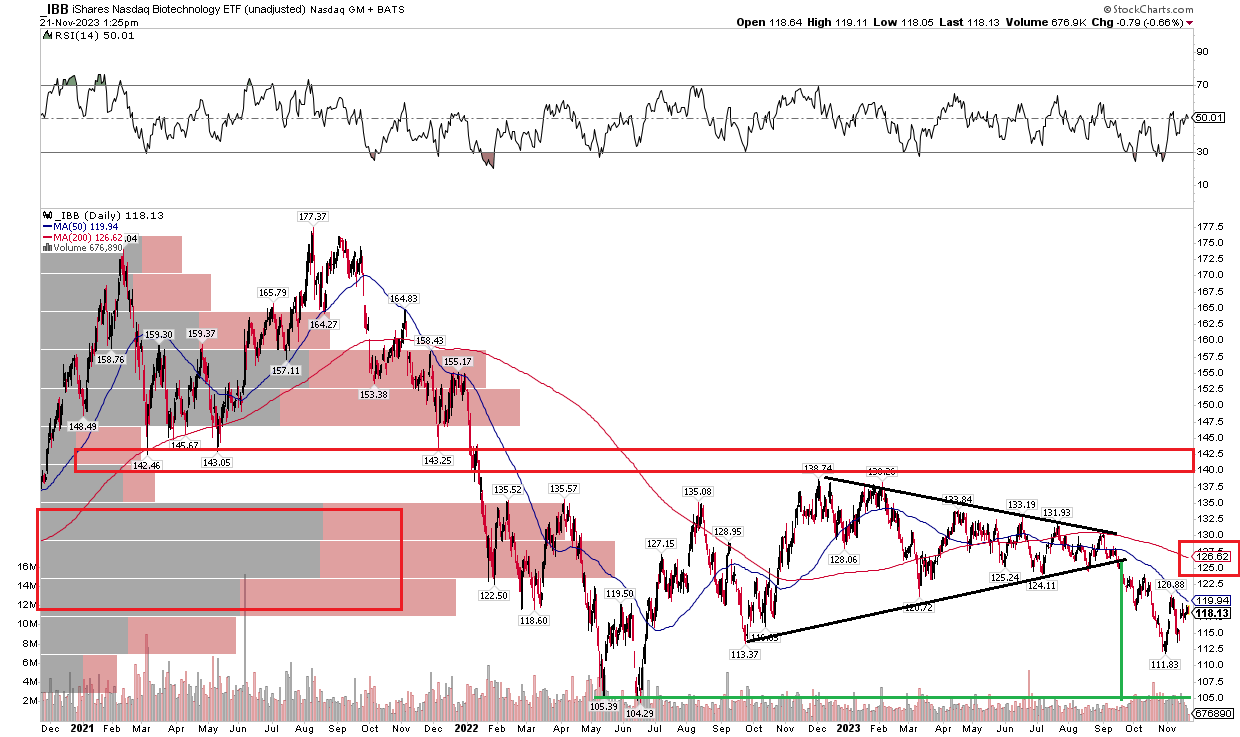
So, what is the important price level I hinted about at the onset of the article? Notice in the chart below that IBB broke down from a symmetrical triangle pattern a few weeks ago. Based on the $22 height of that triangle, and then subtracting that dollar amount from the breakdown point from September, we arrive at a downside price objective of $104 ($126 - $22). That has confluence with the May-June 2022 double bottom in the $104 to $105 range. Getting long IBB there with a stop under $99 could work for a favorable risk/reward play.
For now, the chart is broadly bearish with a negatively sloped long-term 200-day moving average. Sellers also came about on a late-2022 rally attempt toward the $140 area - that was the range base from 2020 and 2021. Also, take a look at the volume by price indicator on the left side of the graph - there is a high amount of shares traded in the $120 to $135 zone - that will make rally attempts tough sledding for the bulls.
Overall, IBB’s chart is bearish in the near term, but getting long on an approach of noted support presents a solid risk/reward investing opportunity.
IBB: Bearish Triangle Breakdown, Targeting $104
The Bottom Line
I reiterate my hold recommendation on IBB. The portfolio is to the cheap side right now, but I continue to see bearish technical factors. Buying on a 10% retreat from the latest price is a more prudent move versus being long today.
For further details see:
IBB: Targeting A Buy Point Heading Into Year-End