DUKB - IGF: Playing Defense With Global Infrastructure
Summary
- iShares Global Infrastructure ETF looks like an attractive buy for a balanced portfolio.
- Utility exposure presents defensive positioning.
- Infrastructure policy will fuel medium-term growth.
- Lower cement prices will ease construction margins.
- Technical analysis also supports a bullish outlook on IGF.
Introduction
I believe global utilities and infrastructure sectors are positioned well to outperform the S&P 500 ( SPY ) due to their defensive nature, fiscal spend growth drivers and reductions in key material costs. In this article, I discuss the iShares Global Infrastructure ETF ( IGF ) to play this theme.
IGF ETF Exposure Mix
Sector Mix
IGF ETF Sector Exposure (IGF ETF Website, Author's Analysis)
Utilities and transportation sectors dominate IGF with 40.5% and 39.1% weightage respectively. Utility exposure would include core services that every country needs such as access to electricity, water, gas and the internet. The usage and demand profiles for these services is rather stable, giving IGF an overall defensive slant.
Transportation infrastructure involves roads, metro rail, freight rail, airports, sea ports and so on. Activity levels and demand from these industries would be more varied. For example, roads and metro rail may have a more resilient usage profile, whilst airport, freight and sea port activity would be more indexed to production volumes in an economy across both services and goods sectors, thus giving it a more cyclical exposure profile.
Geography Mix
IGF ETF Geography Exposure (IGF ETF Website, Author's Analysis)
The table above depicts that IGF has a large part (41.2%) of its exposure to the United States followed by Canada and Australia with 9.4% and 9.3% respectively. Beyond that, there is a long tail of exposure to many other countries' infrastructure assets and their yields.
Top 5 Holdings Mix
IGF ETF Top 5 Holdings (IGF ETF Website, Author's Analysis)
IGF's top 5 holdings include Transurban Group Stapled Securities ( OTCPK:TRAUF ) ( OTCPK:TRAUF ), Enbridge ( ENB ) ( ENB:CA ), NextEra Energy ( NEE ), Aena S.M.E.( OTCPK:ANNSF ) ( OTCPK:ANYYY ) and Duke Energy Corporation ( DUK ).
IGF is a very well-diversified ETF because the top 5 holdings make up only 23.3% of the total weightage. This reduces the diversifiable risk in the portfolio. In addition, there is no outsized exposure of any component holding as evidenced by the fact that the top 5 holdings have roughly equal weight. This makes the ETF a more effective tool to bet on the broad theme underlying it (global infrastructure), without taking a bet on any individual company's outlook.
Bullish Thesis for IGF
My bullish case on IGF is made up of for three reasons:
- Utilities exposure presents defensive positioning
- Infrastructure policy will fuel medium term growth
- Lower cement prices will ease construction margins
Here's the discussion of each part of my thesis:
Utilities exposure presents defensive positioning
As discussed, the essential need for utilities make this industry's volumes rather recession proof category. The US utilities sectors' beta is 0.41 , one of the lowest across all sectors, making it a resilient destination for capital flows during times of the widely anticipated recession:
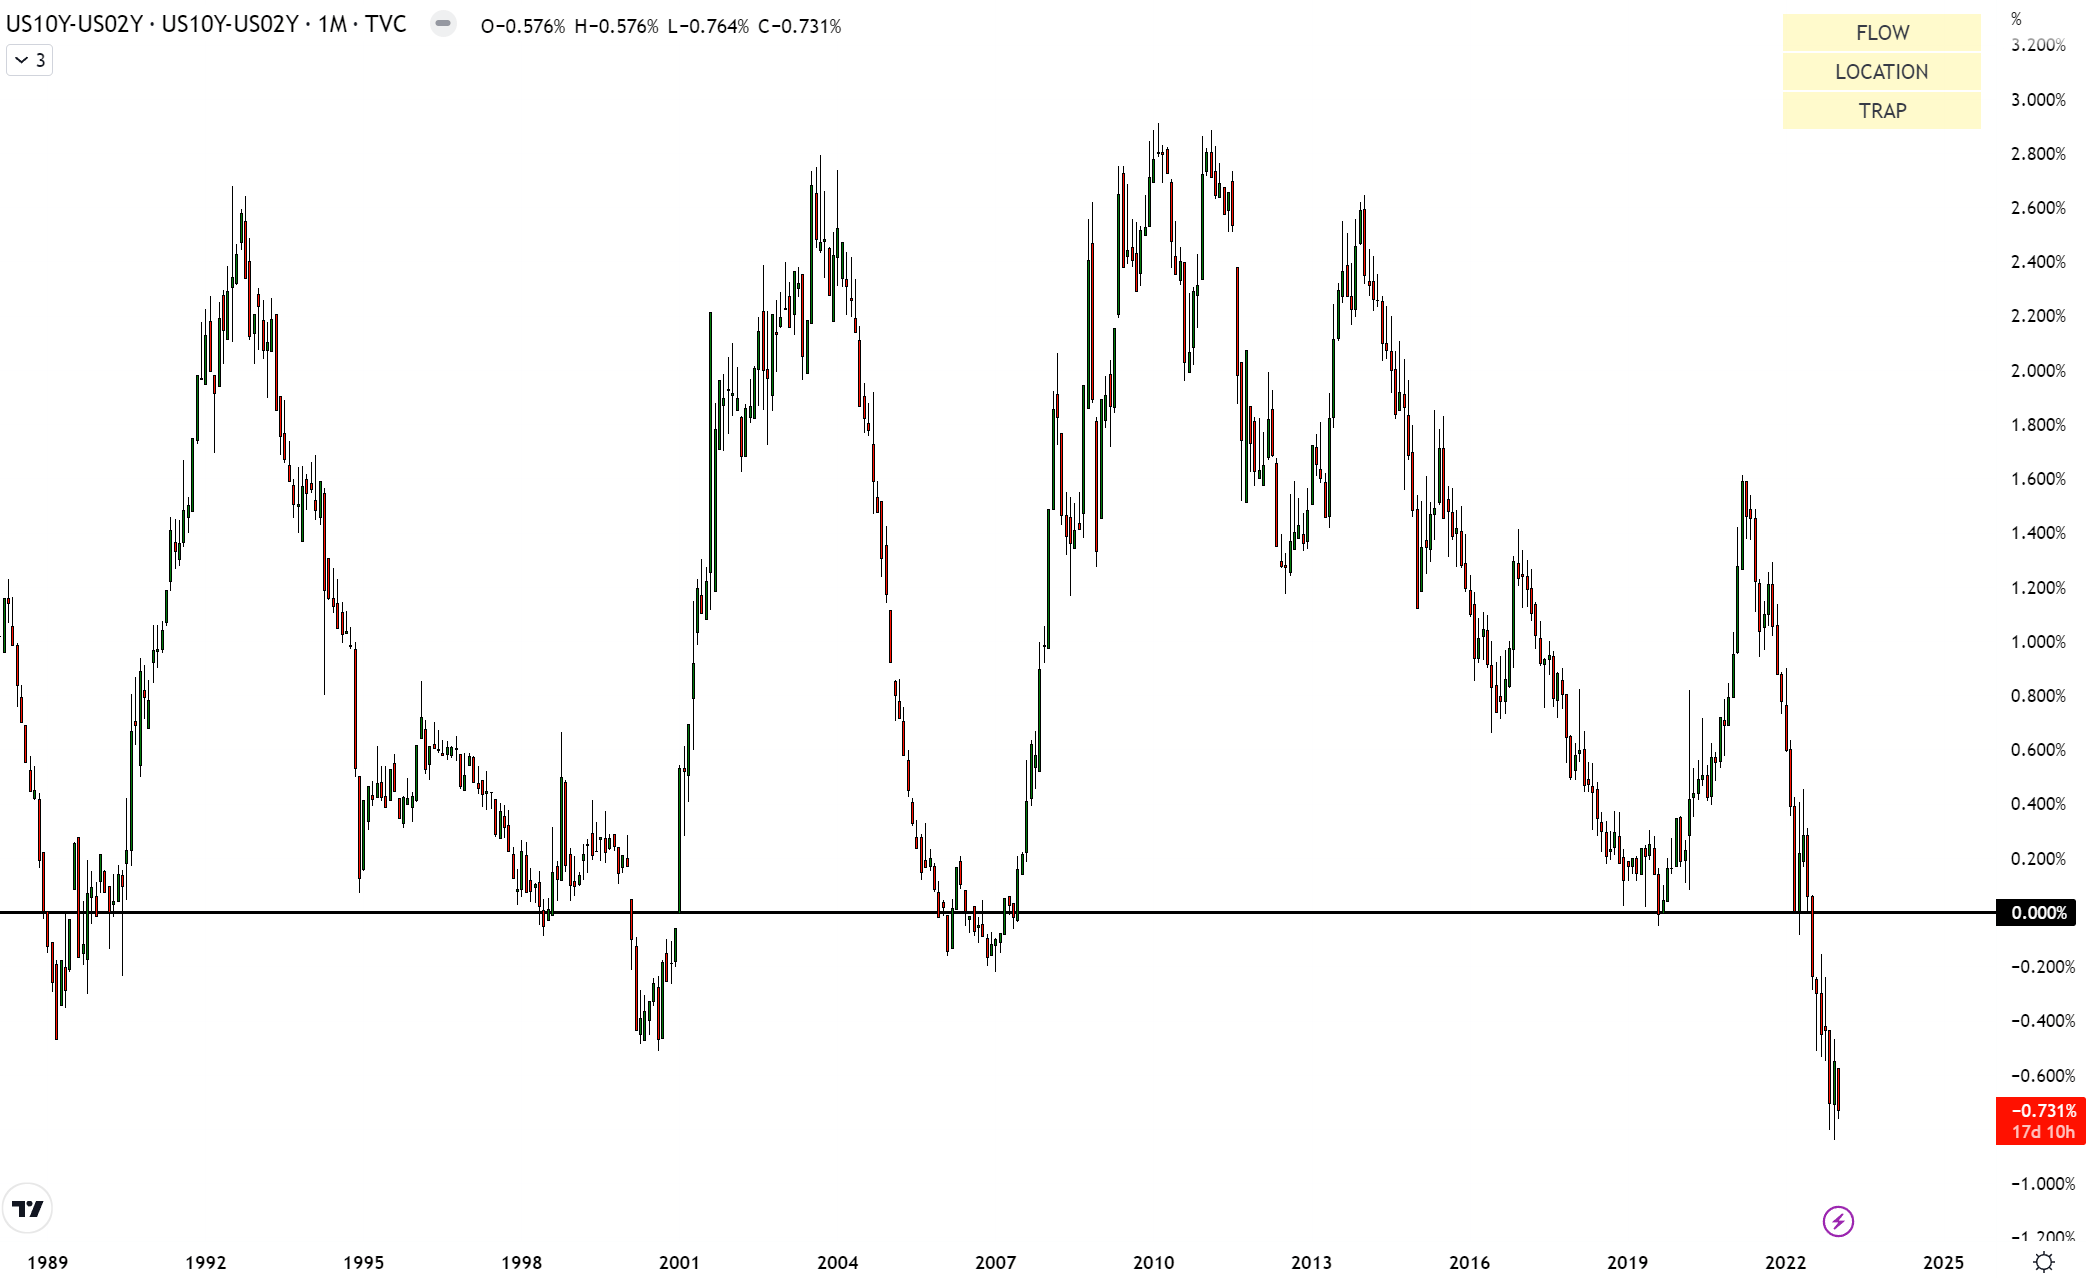
US 10yr Yield - US 2yr Yield (TradingView, Author's Analysis)
The chart above depicts a negative yield spread which corresponds to yield curve inversion . This is one of the best leading indicators of a slowing economy and recession.
Furthermore, the US Inflation Reduction Act (IRA) includes 10-year extensions of investment and production tax credits for wind, solar and battery storage. I believe these measures will support further investment and drive growth in renewable utilities.
Infrastructure policy will fuel medium term growth
The US has a lot of old infrastructure in need of upgrades. In 2021, the American Society of Civil Engineers (ASCE) gave the state of US infrastructure a median grade of 'D+', with 11 of the 17 (58%) of the categories receiving a grade in the 'D- to D+' range:
Infrastructure Report Card (ASCE's 2021 US Infrastructure Report Card, Author's Analysis)
For some context on the scale of the problem, 620,000 road bridges in the country, about 44,000 are deemed to be structurally deficient. In other words, 7 out of every 100 road bridges in the United States are in need of repair .
To solve these problems, the US is executing on a $1 trillion infrastructure bill to revamp infrastructure in the country. I think this provides a healthy tailwind for US infrastructure and hence IGF due to the large US exposure.
Lower cement prices will ease construction margins
US Cement Price Growth (IBISWorld, Author's Analysis)
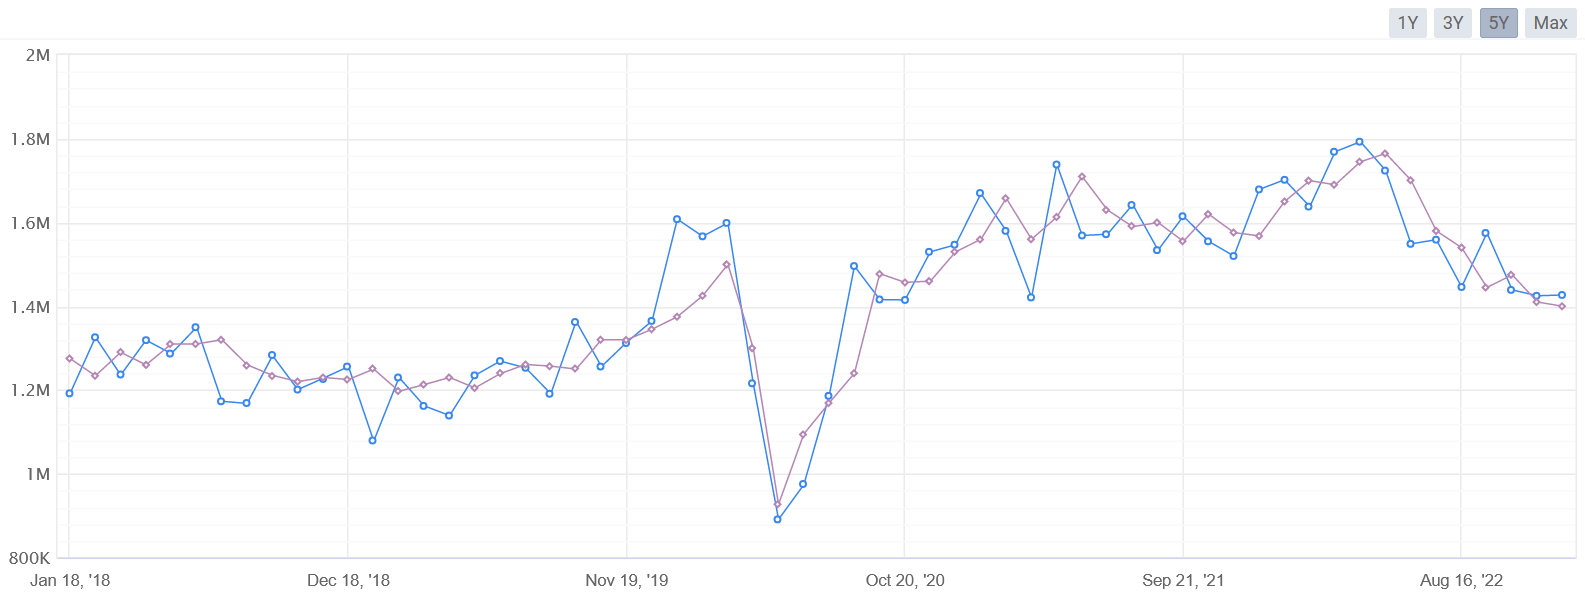
Industry research firm IBISWorld expects US cement prices to fall by 6.2% in 2023 as housing demand slows down. I find this rationale believable as the home construction market has gotten weaker over the past few months. For example, new housing starts has declined 20% over the last 9 months:
US New House Starts (myfxbook)
The blue data series depicts the actual figures. The purple data series depicts consensus estimates.
I believe lower cement prices will be margin-accretive for the public infrastructure companies that will carry on with the government's fiscal spend activities. In this way, IGF should benefit as well.
Technical Analysis
If this is your first time reading a Hunting Alpha article using technical analysis, you may want to read this post , which explains how and why I read the charts the way I do, utilizing the principles of Flow, Location, and Trap.
Relative Read of IGF vs S&P 500
IGF vs SPX500 Technical Analysis (TradingView, Author's Analysis)
The relative chart of IGF/SPX500 above shows the price moving upwards after creating a strong base. Previous resistance created in 2021 is now acting as a demand zone where historic volatility was observed. I anticipate a sideways to bullish move in this relative pair, suggesting IGF outperformance over S&P 500 ( SPY ) ( SPX ).
Standalone Read of IGF
IGF Technical Analysis (TradingView, Author's Analysis)
On a standalone basis, IGF is forming strong support at the $45 zone. There is a history of volatility at this level in 2020 and 2022. Previous resistance is now acting as a support area. I believe $50 will act as a major resistance zone for IGF while $41 will act as a key demand area. I anticipate a sideways to bullish move in IGF.
Summary
On the fundamentals side, my read on IGF is bullish due to its defensive positioning and tailwinds from US Infrastructure spending plans and lower cement prices being accretive to construction margins. On the technicals side, I am bullish, but I am a little less confident on whether it would outperform the S&P 500. Nevertheless, I believe IGF is a 'buy'.
For further details see:
IGF: Playing Defense With Global Infrastructure