EGF - It's Not How Much Duration You Hold It's Where You Hold Your Duration
2023-09-30 04:15:00 ET
Summary
- Rising rates have led to negative year-to-date returns for the US Aggregate benchmark index, but anticipated rate cuts by the Fed could support bond investors.
- The historically inverted yield curve may result in shorter maturities outperforming longer maturities in the bond market.
- Bonds are not rallying as much when stocks sell off, making shorter-maturity bonds more effective as a hedge against stocks.
Fixed income market views from BlackRock Systematic
Rising rates in the second half of the year have brought year-to-date returns for the US Aggregate ( AGG ) benchmark index negative. Anticipated rate cuts by the US Federal Reserve (“Fed”) late next year could support a more positive outcome for bond investors. But a “bull Systematic Fixed Income steepening” of what is now close to a historically inverted yield curve may leave risk-adjusted returns of longer maturity bonds lagging those of shorter maturities. And today, “flight-to-quality” means holding shorter rather than longer maturity bonds as post-COVID structural changes to the bond market likely persist.
This makes where investors hold their duration even more important than how much duration they hold.
Key highlights
Lessons from the taper tantrum
A decade ago, yields moved dramatically higher following indications of an early tapering of Quantitative Easing (“QE”) purchases from the Great Financial Crisis (“GFC”) era. The market feared the implications of this new element of Quantitative Tightening (“QT”), focusing its concerns on the longest maturity interest rates. Today, the combined effect of QT and increased Treasury supply may lead to a similar outcome of increased pressure on longer maturity bonds.
The impact of a historically inverted yield curve
A decade later, yield increases have been led by the shortest maturities, resulting in a historically inverted yield curve. Next year, the Fed is expected to cut rates to keep pace with falling inflation. This means that rate declines would be concentrated in the front end rather than the back end of the curve, making shorter maturities the best performing areas of the bond market. Investors with exposure to the Agg benchmark index may be left behind as roughly 94% of the benchmark’s duration lies in maturities greater than 2 years.
Short maturities may outperform during “flight-to-quality”
Stock-bond correlation moved significantly more positive during the post-COVID inflation, undermining the role of bonds as a diversifier in portfolios. More recently, the diversifying properties of bonds were somewhat restored during banking crisis concerns in March. But a closer look reveals an important implication of the historically inverted yield curve: bonds are not rallying nearly as much when stocks sell off. Rather, shorter dated maturity notes have exhibited the most hedging efficacy versus stocks.
It’s not how much, but rather where you hold your duration
Rising rates in the second half of the year have brought year-to-date returns for the US Aggregate (“Agg”) benchmark index negative—a disappointing turn to the “bonds are back” narrative. Looking ahead to 2024, the market anticipates that the Fed will cut interest rates. But rate declines may be led by the short end of the curve, and this “bull steepening” would leave the risk-adjusted returns of the Agg lagging those of shorter duration bonds. [1]
More broadly, this scenario highlights a shift away from the long-standing outperformance of the long end for portfolio hedging. The factors that were underpinning that performance: (i) hedging efficacy led to levered long end positions from risk parity strategies, (ii) a historic drop in both the level and variability of interest rate volatility suppressed term premium, and (iii) the Fed put, unbridled by inflation concerns, led to interest rate suppression as a tool for policy accommodation. Each of these dynamics are unlikely to return in a post-COVID investment environment, returning bond market “flight-to-quality” insurance to its traditional role in the front end of the yield curve.
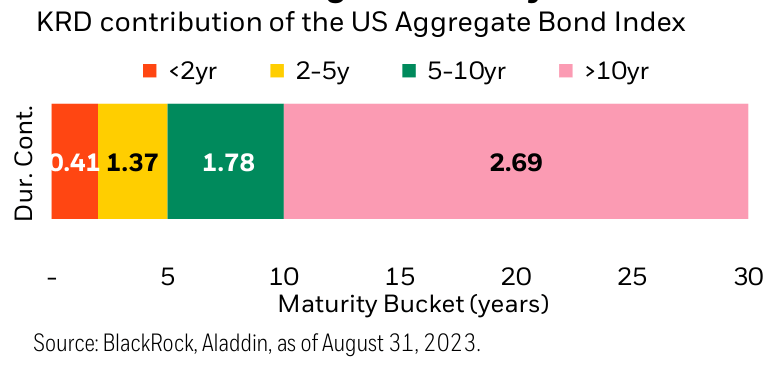
Traditional “core” fixed income tracking the Agg mostly provides exposure to the long end, as shown by the distribution of Key Rate Duration (“KRD”) in Figure 1. KRD measures interest rate sensitivity by maturity. Not only does the Agg have a high level of duration (6.25 years), but the majority of that duration (93.5%) comes from maturity points greater than 2 years.
Figure 1: The Agg distribution of duration is concentrated in higher maturity bonds
Today’s historically inverted yield curve means that its return impact on bonds may be greater than the direction of rates. For the bond return outlook, it’s not how much duration you hold, it’s where you hold your duration.
Lessons from the taper tantrum
A decade ago, yields moved dramatically higher, and stocks moved lower following then Fed Chair Ben Bernanke’s accidental indication of an early tapering of Quantitative Easing (“QE”) purchases from the GFC era. On May 22 nd , 2013, Bernanke stated, “In the next few meetings, we could take a step down in our pace of purchases.” The market reaction was swift and violent, with both stocks and bonds selling off on the news that QE purchases were ending.
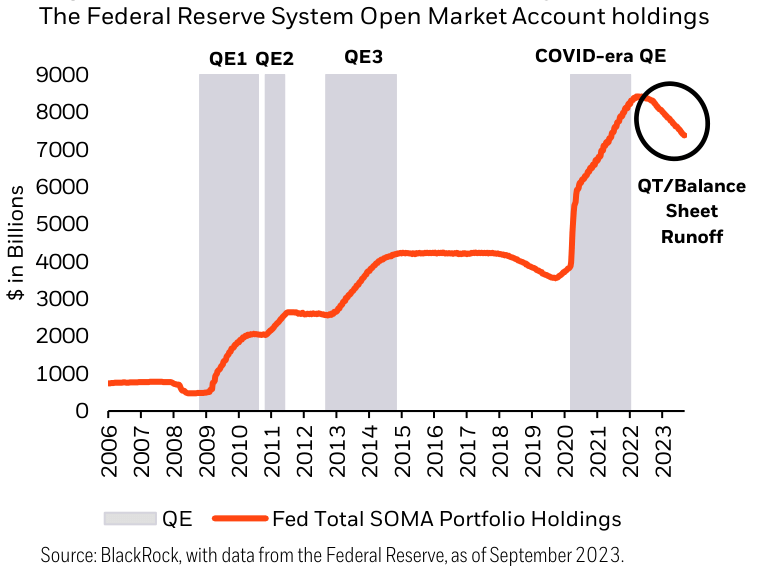
Note that this was not the Fed signaling the start of selling its holdings or running down its balance sheet through maturities—as is the case today (Figure 2). This was simply turning off the spigot of continued asset purchases. Back then however, the market had little experience with the end of QE and feared its consequences, focusing its impact on the longest maturity interest rates. Today, the combination of Quantitative Tightening (“QT”) at a time of greater Treasury supply may lead to a similar outcome of increased pressure on longer maturity bonds.
Figure 2: The “end of QE” vs. QT today
Figure 3 shows how fears of the end of QE manifested over the course of 2013 with higher rates and steeper curves. By 2014, however, the back end of the curve recouped most of its tantrum losses as the Fed successfully slowed and eventually halted purchases by mid-2014 with little market disruption. With the front end of the curve anchored by Zero Interest Rate Policy (“ZIRP”), most of the bond market’s returns were to be found in longer dated maturities.
Figure 3: Lessons from the taper tantrum to today
Today by contrast, the yield curve stands just off of historic lows of inversion with 1-year Treasury Bill yields exceeding 30-year bond yields by over ¾ of a percent. This level of inversion reflects several dynamics. The most notable is the end of the Fed’s hiking cycle which typically sees the flattest levels of the curve. The expected path of inflation towards pre-COVID 2% levels, anchored longer-run inflation expectations, and lingering fears of a hard landing have all contributed to lower longer maturity interest rates. Unlike during the taper tantrum, today it’s the short end (meaning typically out to 2 years in maturity, but potentially as far out as 5 years) that offers the best combination of yield and potential upside from future relative declines in rates.
Several factors may contribute to the outlook for a steeper path for the yield curve: (i) rising Treasury issuance must increasingly be absorbed by the market as the Fed normalizes its balance sheet (Figure 4), (ii) post-COVID structural economic changes may imply a much higher real neutral rate, leading the Fed to end up with higher nominal rates than currently priced, (iii) Global Central Banks winding down their QE regimes can further influence higher rates in the US, and (iv) less hedging efficacy of long dated Treasuries (as previously outlined) implies a return of both term and inflation risk premia that has been missing since the onset of the GFC. Each of these dynamics suggest that the likely path for the yield curve will be steeper, implying relative underperformance of the long end of the curve.
On the flip side, higher or more persistent inflation that forces the Fed to keep rates higher for longer (or even add to hikes) would upend market expectations, causing higher short end rates and further curve inversion. Our outlook favors the bull steepening case, but we hold a modest amount of duration in the back end of the curve to account for the possibility of the consensus being wrong again.
Figure 4: Rising net Treasury issuance net of Fed purchases may contribute to a steeper curve ahead
YIELD CURVE SCENARIOS: What does the market expect?
Bull steepening: The consensus case
The market consensus on duration turned positive following the sell-off in rates in 2022 and expected positive performance for 2023. That view proved to be premature as the subsequent increase in rates since June and the negative year-to-date performance in the Agg has sapped some enthusiasm in survey measures of investor sentiment.
Despite these setbacks, net survey position shows long duration, with surveys pointing towards a preference for shorter maturities over longer-dated maturities. This implies an expectation for bull steepening. This would also be consistent with the Fed’s expectation for continued progress on inflation leading to interest rate cuts later in 2024.
These expectations increasingly also reflect market and Fed confidence in a soft-landing economic scenario. The absence of a hard landing-induced collapse in inflation and return to QE likely limits back-end performance in this scenario.
Bear flattening: Out-of-consensus
Continued increases in interest rates from the Fed (beyond just one more hike) leading to further curve inversion and higher overall rates appears unlikely according to most forecasters— and for good reason. This would require the consensus view to get both growth and inflation wrong in 2023.
Forecasters maybe underestimating the potential for still robust labor markets to fuel persistent wage inflation. And the quick return to corporate profit growth may end up undermining the outlook for wage disinflation due to the lack of layoffs. Continued tight labor markets, headline inflation increases from rising oil prices bleeding into core inflation increases, and a growth picture that remains too strong to support demand falling back below potential all argue (despite low odds) for the need for further rate hikes rather than rate cuts. That is the recipe for bear flattening.
Bear steepening/bull flattening: Out-of-consensus
Other scenarios outside of consensus include bear steepening from belatedly rising Fed rates alongside persistent growth and stubborn inflation, or bull flattening from a financial shock and dramatically lower inflation concerns and a return of QE.
Portfolio construction implications of a historically inverted yield curve
An inverted yield curve means that short maturities outperform long maturities during “flight-to-quality”. Stock-bond correlation moved significantly more positive during the post-COVID inflation, undermining the role of bonds as a diversifier in portfolios.
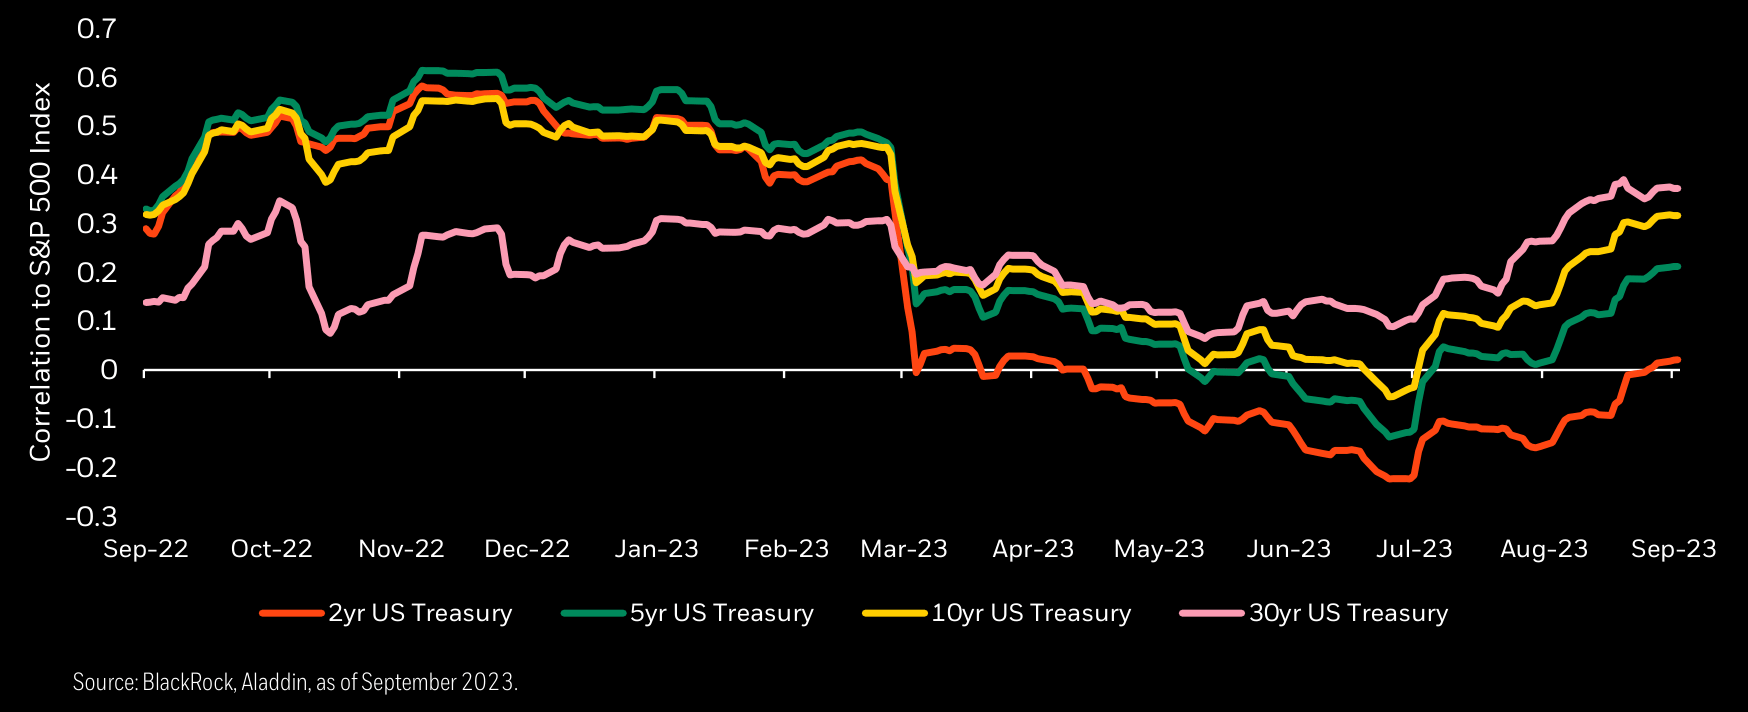
More recently, as shown in Figure 5, the diversifying properties of bonds were somewhat restored during the March banking crisis, as bonds rallied when stocks sold off (and correlations fell back towards zero/negative).
Figure 5: Shorter maturity bonds have exhibited the most diversification to stocks
But a closer look reveals an important implication of the historically inverted yield curve: bonds are not rallying nearly as much when stocks sell off. Rather, its shorter-maturity notes that exhibit the most hedging efficacy versus stocks. This is another reason to favor shorter over longer-term bonds.
This dynamic reflects a return to pre-QE and pre-ZIRP bond market dynamics where the flight to quality is a yield curve steepener. With short-term rates far away from zero, they have more room to fall. That relationship flipped on its head post-GFC where the flight to quality meant back-end outperformance (as the front-end was limited by the zero lower bound). Today, flight to quality again means outperformance of the short end.
Implications for investors
A base case outlook of curve steepening, the higher yields of shorter maturity bonds, and their better diversification properties all favor the risk-adjusted performance of short over long maturity bonds.
Conclusion
As the Fed’s hiking cycle comes to a close, many investors are expecting a return to more consistently positive returns from bonds and the resumption of long end duration as the most effective portfolio hedge.
But today’s historically inverted yield curve along with the potential effects of QT and rising Treasury supply, normalized levels of interest rate volatility, and a Fed wanting to secure the gains from its fight against inflation from setting into longer-run inflation expectations are among several factors that may contribute to a steeper yield curve ahead—and a return of “flight-to-quality” insurance better expressed in the short end rather than the long end.
Along with the expectation for curve steepening, the attractive yield and diversification potential of shorter-term bonds may make them better positioned than longer maturity bonds for what’s ahead. When considering the outlook for fixed income returns, where you hold your duration may be even more important than how much duration you hold.
Footnotes
[1] Note that a large enough steepening would make the unadjusted returns favorable to shorter maturity bonds. Risk-adjustment means holding more notional in short vs long maturity bonds to equate the duration contributions.
This material is prepared by BlackRock and is not intended to be relied upon as a forecast, research or investment advice, and is not a recommendation, offer or solicitation to buy or sell any securities or to adopt any investment strategy. The opinions expressed are as of September 2023 and may change as subsequent conditions vary. The information and opinions contained in this material are derived from proprietary and nonproprietary sources deemed by BlackRock to be reliable, are not necessarily all-inclusive and are not guaranteed as to accuracy. As such, no warranty of accuracy or reliability is given and no responsibility arising in any other way for errors and omissions (including responsibility to any person by reason of negligence) is accepted by BlackRock, its officers, employees or agents.
This material may contain “forward-looking” information that is not purely historical in nature. Such information may include, among other things, projections and forecasts. There is no guarantee that any of these views will come to pass. Reliance upon information in this material is at the sole discretion of the reader. This material is intended for information purposes only and does not constitute investment advice or an offer or solicitation to purchase or sell in any securities, BlackRock funds or any investment strategy nor shall any securities be offered or sold to any person in any jurisdiction in which an offer, solicitation, purchase or sale would be unlawful under the securities laws of such jurisdiction.
Stock and bond values fluctuate in price so the value of your investment can go down depending upon market conditions. The two main risks related to fixed income investing are interest rate risk and credit risk. Typically, when interest rates rise, there is a corresponding decline in the market value of bonds. Credit risk refers to the possibility that the issuer of the bond will not be able to make principal and interest payments. The principal on mortgage- or asset-backed securities may be prepaid at any time, which will reduce the yield and market value of these securities. Obligations of US Government agencies and authorities are supported by varying degrees of credit but generally are not backed by the full faith and credit of the US Government. Investments in non-investment-grade debt securities (“high-yield bonds” or “junk bonds”) may be subject to greater market fluctuations and risk of default or loss of income and principal than securities in higher rating categories. Income from municipal bonds may be subject to state and local taxes and at times the alternative minimum tax.
Index performance is shown for illustrative purposes only. Indexes are unmanaged and one cannot invest directly in an index.
Investing involves risk, including possible loss of principal.
©2023 BlackRock. Inc. or its affiliates. All rights reserved. BLACKROCK and ALADDIN are trademarks of BlackRock, Inc. or its affiliates. All other trademarks are the property of their respective owners.
This post originally appeared on the iShares Market Insights
Editor's Note: The summary bullets for this article were chosen by Seeking Alpha editors.
For further details see:
It's Not How Much Duration You Hold, It's Where You Hold Your Duration