IVOL - IVOL: A Contrarian Macro Investor's Dream
2023-08-14 05:30:33 ET
Summary
- The Quadratic Interest Rate Volatility and Inflation Hedge ETF is a contrarian trade that bets on 2-year US bond yields falling relative to 10-year inflation expectations.
- The IVOL ETF holds a portfolio of inflation-linked bonds and options to hedge against a steepening yield curve.
- Speculators are heavily betting on further upside in 2-year yields, but I strongly expect 2-year yields to fall below long-term inflation expectations in the next 12-24 months.
- Such a move should see the IVOL return at least 25% over this period plus sizeable dividend income resulting from payments linked to CPI.
I last wrote on the Quadratic Interest Rate Volatility and Inflation Hedge ETF ( IVOL ) in June and since then I have been aggressively adding to my position. While the IVOL uses various derivatives, it is essentially a bet on 2-year US bond yields falling relative to 10-year inflation expectations from their current elevated level. With speculative positioning skewed heavily towards continued upside in 2-year yields, the IVOL is a deeply contrarian trade. While the high expense ratio of 1.03% is a drawback, I see potential for 50% upside in this ETF over the next 12-24 months.
The IVOL ETF
IVOL is a fixed-income ETF that holds a portfolio of inflation-linked bonds and options that seeks to hedge against a steepening yield curve, whether from falling short-term interest rates or rising long-term interest rates. The bulk of the IVOL's assets are held in the Schwab U.S. TIPS ETF (SCHP) which holds inflation-linked bonds with an average maturity of 7.4 years, which benefit from rising inflation expectations. The remainder is held in OTC options which seek to benefit from yield curve steepening, specifically the spread between 2-year and 10-year interest rate swaps.
Because the fund has long exposure to 10-year bonds through its SCHP holdings and short exposure via swaps, the fund's net exposure boils down to a long position in 2-year bonds and a short position in 10-year breakeven inflation expectations. The fund also benefits from rising long-term inflation expectations as this raises the value of its SCHP holdings, and it should also benefit in nominal terms if reported inflation rises as these inflation-linked bonds will pay out coupons linked to headline CPI. The current dividend yield on the ETF is a solid 3.9% even after the high expense fee, which largely reflects these CPI-linked payments.
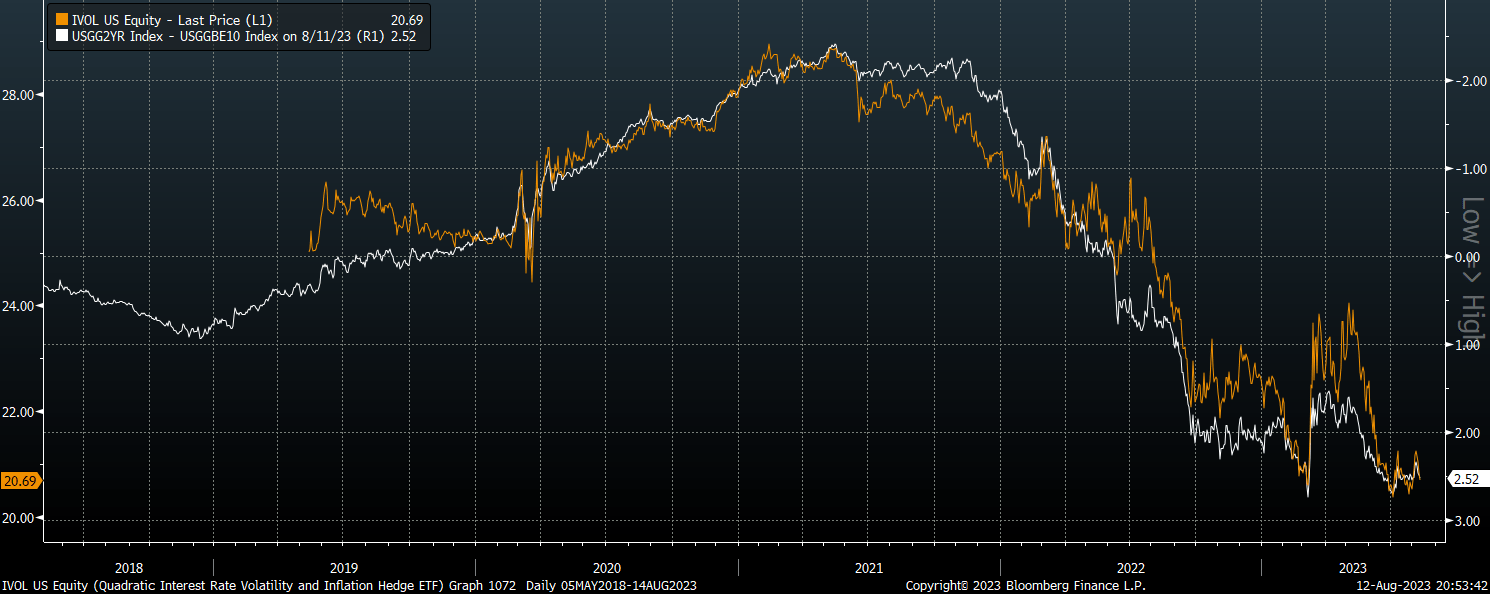
The chart below shows the performance of the IVOL against the spread of 2-year bond yields over 10-year breakevens. The r-squared between the two since the IVOL's inception has been 0.96. As the 2-year yield is much more volatile than 10-year breakevens, daily returns are closely correlated with 2-year bond prices, although with much greater volatility.
IVOL Vs Spread of 2-Year UST over 10-Year Breakeven Inflation Expectations (Bloomberg)
High 2-Year Real Yields At Odds With Growth And Deficit Outlook
In a recent article on inflation-linked bonds I argued that real interest rates will have to be brought back down below zero in order to prevent US Treasury interest payments from rising to a cripplingly high share of tax revenues. The combination of high structural fiscal deficits, a huge debt to GDP ratio, and rising real yields risks creating a self-reinforcing rise in yields as rising interest costs cause large deficits, requiring further bond issuance and even higher yields and so forth. The Japanese central bank has been forced to cap bond yields even amid rising inflation so as to prevent the need for spending cuts, and the US is not far from being forced to enact similar yield curve control policies.
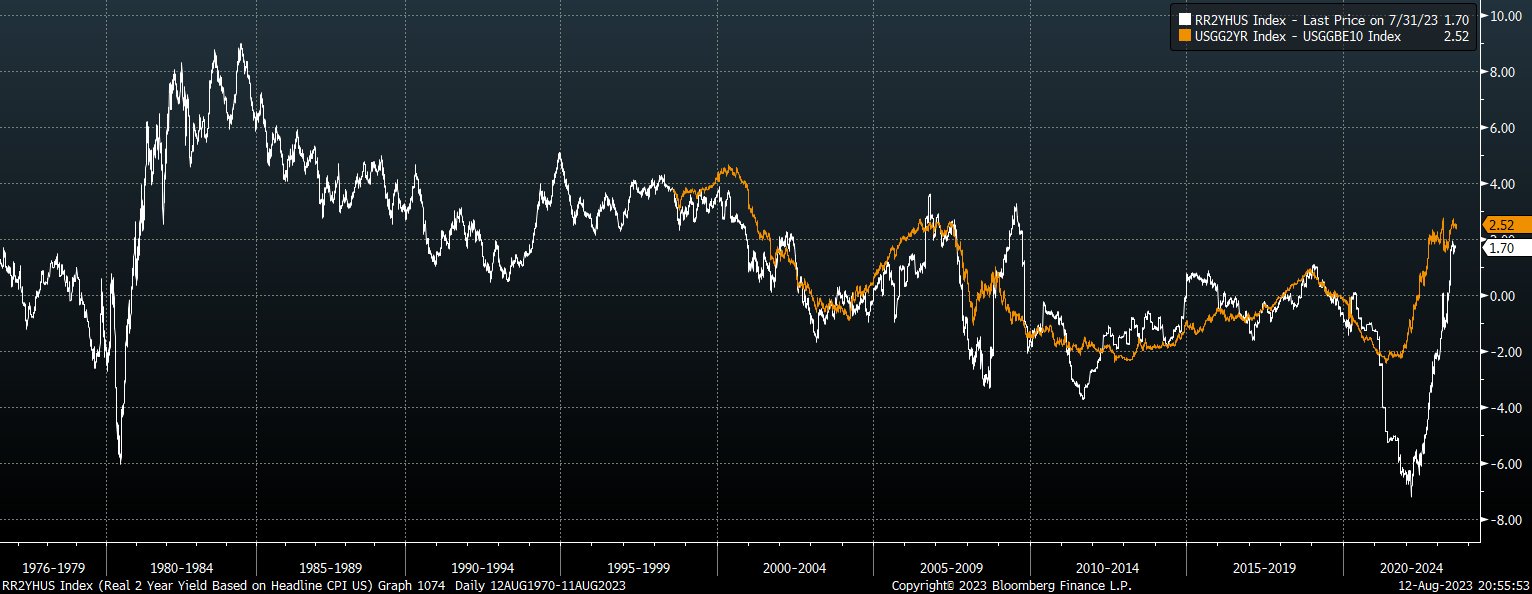
The 2-year yield is now 252bps above 10-year breakevens, which compares with an average spread since 1998 of around zero. Looking at the longer term, the 2-year yield has tended to average around 1pp above actual inflation going back to the 1970s.
White Line: 2-Year UST Yield Vs Headline CPI. Orange Line: 2-Year UST Yield Vs 10-Year Breakevens (Bloomberg)
Real 2-year yields tend to track real GDP growth reasonably closely as strong real GDP growth means that investors require a higher risk-free return on bonds. Considering that real GDP growth has averaged 2.7% since the 1970s, this means that real 2-year yields have averaged 1.7pp below the rate of growth of the real economy. I expect trend US real GDP growth to average no more than 1% over the long term, meaning that we might expect 2-year real yields to be less than 1% based on historical averages.
However, even at 1% real yields, persistent primary deficits mean that debt interest would still likely continue to grow relative to tax revenues. The rise in government debt and slowing real GDP growth rate largely explain the trend of declining real yields over the past 50 years.
I fully expect that we will see 2-year yields fall back below long-term inflation expectations over the next 12-24 months, and while this is likely to result from falling yields IVOL would also benefit from a rise in long-term inflation expectations. I would not be surprised to see both falling yields and rising inflation expectations as the Fed ends its quantitative tightening program and lowers rates.
Speculators Are Betting Heavily On Further 2-Year Yield Upside
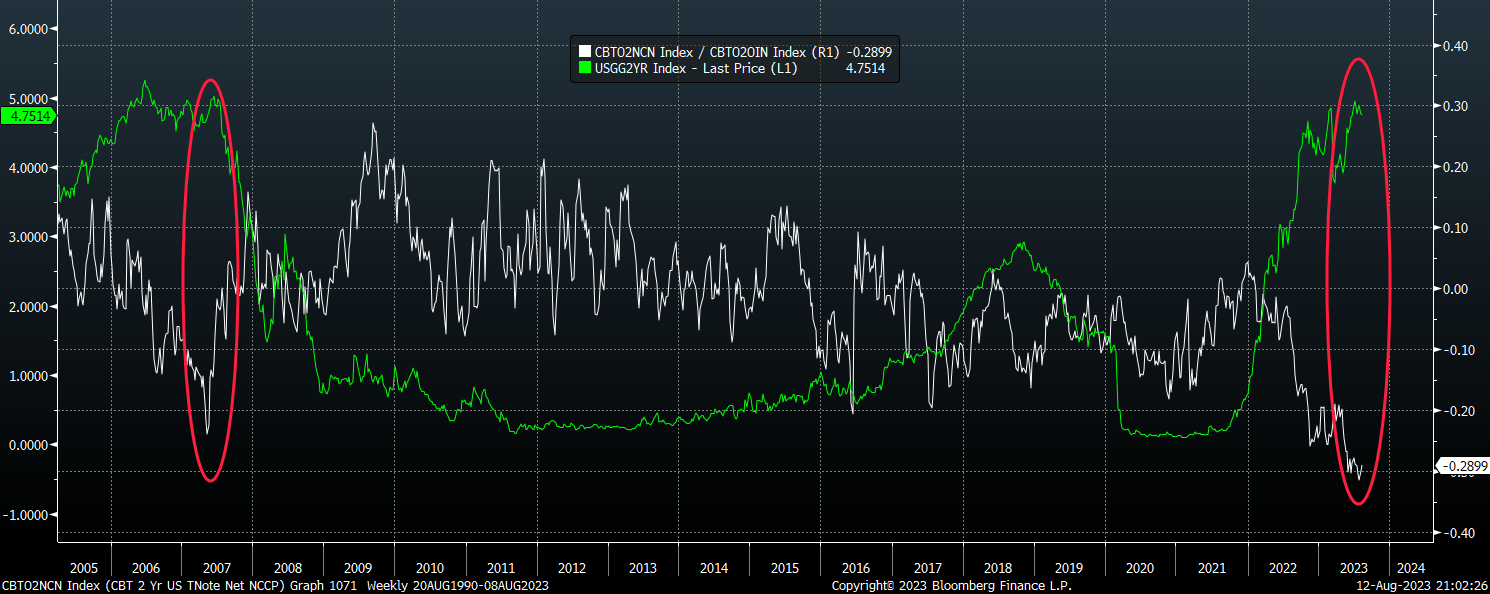
Investors appear to be betting aggressively on further upside in 2-year yields. Net non-commercial futures positioning is heavily short, with net positioning now at -29% of open interest, its most negative on record. The previous record short position came in mid-2007 when investors were also betting aggressively on further upside in short-term yields and curve flattening.
US 2-Year UST Vs Net Non-Commercial Positioning/Open Interest (Bloomberg, CFTC)
Over the following 6 months the spread of 2-year yields over 10-year breakevens would fall 350bps to -100bps at the financial crisis lows, while the Fed's attempt to reflate asset markets would see the yield spread fall to -240bps by the 2013 lows. While the IVOL was not around then, the correlation in place since 2018 suggests this would result in almost 50% upside, while a move back to just zero would result in 25% upside. Including dividend payments, I expect to see 25-50% returns in IVOL over the next 12-24 months.
Another Leg Higher In Stocks Is The Main Risk
As I argued in my previous article on IVOL, the main risk comes from another leg up in equity markets. Such a move could force policymakers to maintain rates at current levels if inflation continues to drop due to fears about the wealth effect reigniting price pressures. There are also risks associated with IVOL's use of options contracts that have embedded leverage in that the investor's overall exposure to the underlying strategy that the options are based on is greater than the value of the options. However, even with these risks considered, IVOL is an excellent risk-reward play in the current environment.
For further details see:
IVOL: A Contrarian Macro Investor's Dream