CVX - IXC: Energy Stocks At A Crossroads
2024-01-13 01:33:08 ET
Summary
- The iShares Global Energy ETF has traded sideways over the past year but cheap valuations and upside risks to oil prices suggest a resumption of long term outperformance.
- The IXC ETF is more diversified than its rival the XLE, with a lower concentration risk, although this comes at the expense of fees.
- The IXC is testing key support levels and a breakout could signal a change in market trend.
The iShares Global Energy ETF ( IXC ) has traded sideways since my last article a year ago, failing to partake in the broader equity rally as oil prices have moved lower. The uptrend from the June 2022 lows is under pressure, but the fundamentals are increasingly positive, with valuations once again relatively cheap and oil prices facing upside risks. The trend of outperformance versus global stocks that begun in 2020 looks set to resume.
The IXC ETF
IXC tracks the performance of the S&P Global 1200 Energy Sector index and charges an expense fee of 0.44%, which is higher than its rival ETF, the XLE , which tracks the Energy Select Sector SPDR Fund and charges just 0.1%. In terms of country exposure, XLE is 100% focused on the US, while IXC has 69% of its assets in US stocks and the rest spread across Canada, Europe, and the rest of the world. As a result, IXC is much more diversified, with the top 10 holdings accounting for 59% of the index versus 76% in the case of XLE. The combined weighting of Exxon ( XOM ) and Chevron ( CVX ) in IXC is 25% versus 40% in XLE. These stocks have underperformed over the past year, reducing their weighting and the associated concentration risk. The IXC pays a dividend yield of 3.6%, which has fallen sharply over recent years due to falling payouts, although this in part reflects a shift towards increased buybacks among oil majors. The underlying index offers a yield of 4.5% suggesting there is potential for the IXC yield to rise over the coming months.
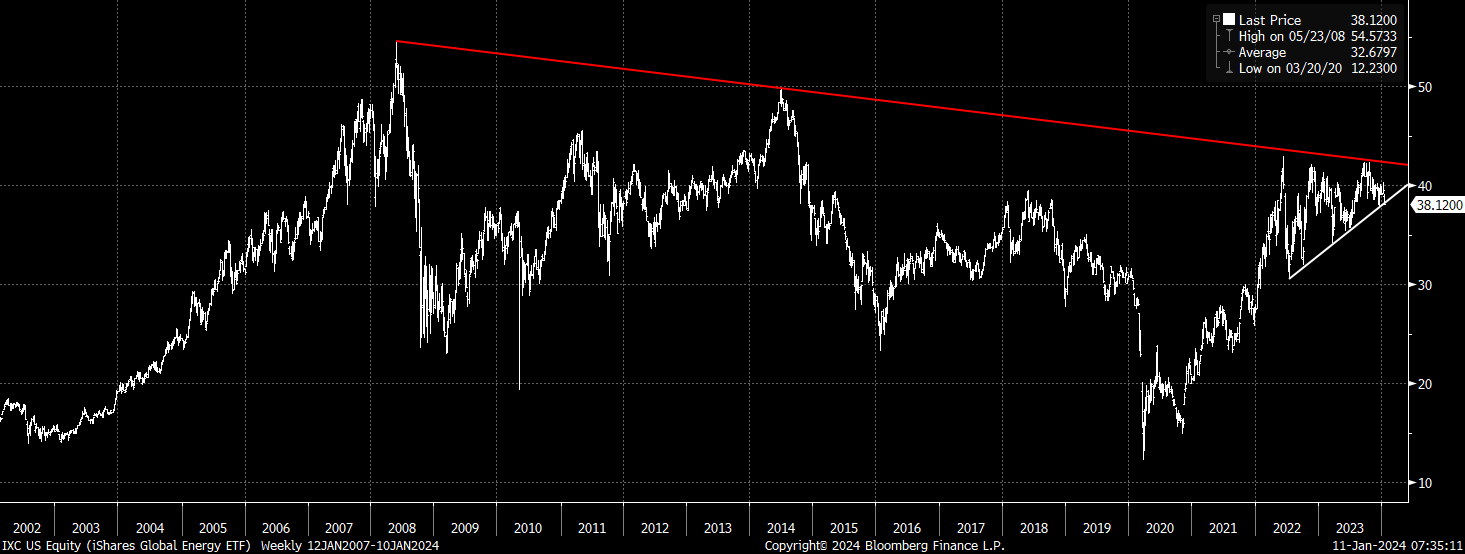
Chart Pattern Suggests An Upcoming Breakout
The IXC is testing the $38 level, which marks the December lows as well as the uptrend from the July 2022 lows. A close below here would be bearish, implying a significant change in the market trend following an 18-month consolidation patterns. On the upside, a bounce from current levels would put trendline resistance into focus, which comes in around $42. This level also marks down trendline resistance from the 2008 highs, and so we should expect some volatility over the coming months as the next trend takes shape.
Valuation Discount Once Again Extreme
Valuations remain cheap from both a historical perspective and relative to the broader market. Even as sales and earnings have fallen across the energy sector amid lower oil prices, the trailing PE ratio remains attractive at 8.3x, and this is also supported by the low price to free cash flow ratio of 8.8x. The discount relative to the MSCI World is close to its widest going back 20 years, as the table below shows. Taking an average of popular valuation metrics, the S&P Global Energy Sector trades at a 56% discount to the MSCI World.
| PE |
| P/FCF |
| PS |
| PB |
| P/Dividend |
| S&P Global Energy |
| 8.3 |
| 8.8 |
| 1.0 |
| 1.7 |
| 22.2 |
| MSCI World |
| 20.1 |
| 25.1 |
| 2.1 |
| 3.1 |
| 51.0 |
| Ratio |
| 0.41 |
| 0.35 |
| 0.48 |
| 0.55 |
| 0.44 |
| Ratio Percentile Since 2005 |
| 3rd |
| 5th |
| 9th |
| 12th |
| 12th |
While cheaper valuations should help the IXC to outperform over the long term, the short term direction will be driven largely by crude oil prices and the outlook here is improving. Both Brent and WTI appear to be consolidating above support going back to the mid-2021 lows after failing to join in the broader rally seen since October. If stocks are correct in pricing in a global economic recovery, oil prices should start to see some upside sooner rather than later. According to the US Department of Energy global oil and liquid fuel consumption hit a new all-time high in December, taking out the pre-Covid highs seen in 2019. This is despite the ongoing decline in US oil imports. According to Goldman Sachs derivatives desk as reported by ZeroHedge, CTA funds, which have an outsized impact on oil prices, are heavily short oil and are expected to engage in forced buying on any up move.
CTA Trader Positioning (Goldman Sachs, ZeroHedge)
Tracking Error Is A Potential Downside Risk
IXC has tracked the performance of its benchmark, the S&P Global 1200 Energy Sector index, very closely on a day to day and month to month basis, but has underperformed by around 0.6% annually over the past decade in total return terms. This is higher than the rate implied by the fund's expense fee, which is a concern.
Performance of IXC over XLE versus Performance of Benchmarks (Bloomberg)
This drag has been the main reason why the IXC has underperformed the XLE over this period. As the chart above shows, the S&P Global 1200 Energy Sector index has actually outperformed the US-focused Energy Sector Select index, but this has not translated into IXC outperformance. Nonetheless, the former's valuation discount and higher dividend yield should offset the impact of higher expense fees.
For further details see:
IXC: Energy Stocks At A Crossroads