IXUS - IXUS: Valuation Fair But Not Cheap Enough
2023-06-09 08:59:42 ET
Summary
- The iShares Core MSCI Total International Stock ETF is currently fairly valued but not cheap, according to the Warren Buffett Indicator.
- Persistent inflation and the Federal Reserve's potential continuation of rate hikes may pose headwinds for IXUS's performance.
- Investors are advised to wait on the sidelines before initiating a position in IXUS.
Introduction
As the Federal Reserve's rate hike cycle gradually moves to the end, many investors wonder whether this is a good time to invest in stocks outside of the United States. In this article, we will analyze iShares Core MSCI Total International Stock ETF ( IXUS ) and provide our insights and recommendations.
ETF Overview
IXUS seeks to provide investors with exposure outside of the United States. The fund is diversified and has over 4,000 non-U.S. equities in its portfolio. Although the global economy may have stabilized in the first half of 2023, the Federal Reserve may continue its rate hike cycle albeit at a slower pace. This will continue to suppress the valuation of IXUS. In addition, its valuation based on the Warren Buffett Indicator is still not attractive. Therefore, we think investors should not be in a hurry to initiate a position.
YCharts
Fund Analysis
The fund has been rangebound in H1 2023
We all knew that last year was a brutal year for most equities in the United States or in other parts of the world. However, the global stock market has since stabilized. Let us look at IXUS's performance in the first half of 2023. As can be seen in the chart below, IXUS had a good rebound in January as the fund rebounded over 9% in that month. However, the fund has unable to move past the high reached in January and has been range-bounding since January 2023. In contrast, the S&P 500 index has outperformed IXUS by registering a gain over 12% since the beginning of the year.
YCharts
How the global economy will look like in 2023?
We will now take a look PMI data, or purchasing manager's index. This index is often seen as a forward indicator to gauge how well the economy will perform in the future. Here, we will particularly look at the global PMI composite index. As can be seen from the chart below, the global PMI composite index is in a rising trend since November 2022. It has since risen from below 48 to over 54. Therefore, it appears that the global economy is in a healthy shape.
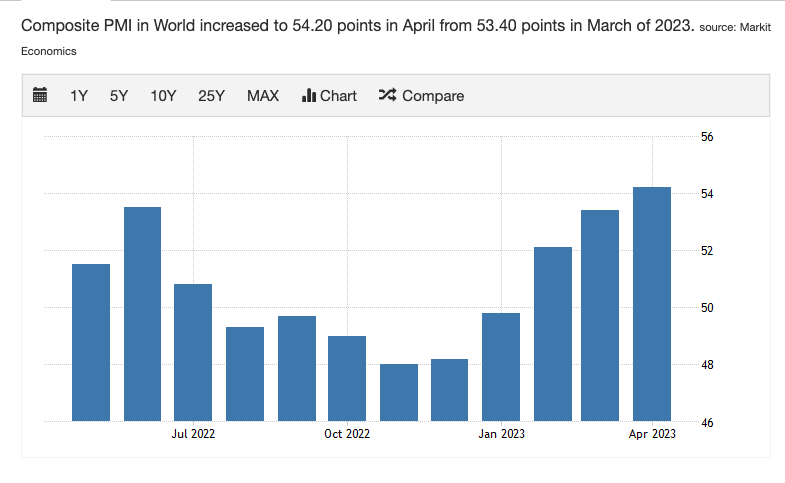
However, we think persistent inflation will continue to be a headwind
Since the beginning of 2023, the Federal Reserve has slowed down its rate hike trajectory and has only raised the rate by 25 basis points each in February, March, and May. Many investors think that a pause in rate hike is likely. However, we think it is likely that the Federal Reserve may continue to raise the rate in the next few meetings at 25 basis points each. The answer is simple, the economy is still robust and the job market remains strong. This shows that demand in the economy remains quite robust. Hence, the Federal Reserve may have to continue to raise rates to lower inflation expectations.
In this environment, it will be a challenge to see a sustainable rally for IXUS. As can be seen from the chart below, IXUS's fund price tends to be inversely correlated to the strength of the .U.S dollar. If the Federal Reserve continues to raise the rate upward even just slowly, it will result in a strengthening U.S. dollar. IXUS is unlikely to outperform in this environment.
YCharts
Buffett Indicator shows that IXUS is fair, but not cheap
It is difficult for us to evaluate every stock in IXUS's portfolio as the fund has over 4,000 stocks. However, we can analyze its valuation using an indicator that Warren Buffett often uses. It is called the Buffett Indicator. In a Forbes interview in December 2001, Warren Buffett suggests using the ratio of market capitalization to GDP to evaluate whether the broader stock market is overvalued or not. If the market capitalization to GDP ratio is in the range of 75% to 90%, the valuations of equities are reasonable. However, if this ratio is above 120%, the stock market is quite overvalued. We can also use Warren Buffett indicator to look at whether different stock markets around the world are overvalued or not. Since many central banks in the world have inflated their balance sheets in the past 20 years, we will also take into consideration of their assets. Therefore, we have modified the equation slightly. Instead of the market capitalization to GDP ratio, the denominator will be GDP + Assets. We believe, this will better reflect the valuations of different stock markets in the world.
Let us first look at IXUS's exposure to different markets. As can be seen from the table below, the top 11 countries represent about 70.82% of its total portfolio. Based on the revised Buffett Indicator, China and Germany's stock markets appears to be quite cheap at 45.14% and 33.28% respectively. On the other hand, Canada and Switzerland appears to be quite expensive with ratios of 122.83% and 110.30% respectively. The weighted average market cap to (GDP+ Assets) ratio is currently 74.79%. By rounding the number to 75%, its ratio appears to be fair but not cheap. It appears that a pullback will provide a better entry point.
| Top-10 Countries |
| Weight (%) |
| Market Cap/(GDP+Assets) Ratio (%) |
| Japan |
| 15.37 |
| 62.00 |
| United Kingdom |
| 9.53 |
| 75.27 |
| China |
| 7.54 |
| 45.14 |
| Canada |
| 7.42 |
| 122.83 |
| France |
| 6.99 |
| 71.62 |
| Switzerland |
| 6.00 |
| 110.30 |
| Germany |
| 5.11 |
| 33.28 |
| Australia |
| 4.93 |
| 80.38 |
| Taiwan |
| 4.64 |
| N/A |
| India |
| 4.30 |
| 83.16 |
| South Korea |
| 3.63 |
| 79.33 |
| Total /Weighted Average |
| 70.82 |
| 7 4.79 |
Source: Created by author, iShares, Gurufocus
Investor Takeaway
IXUS's total performance of 68% since its inception in October 2012 is not particularly impressive as the S&P 500 index has risen by over 260% in the same period. Its valuation is also not cheap based on Warren Buffett indicator. Therefore, it is hard for us to recommend a buy. We think investors should wait on the sidelines.
For further details see:
IXUS: Valuation Fair But Not Cheap Enough