CVX - IYE: There Are Better Alternatives To Play The Oil And Gas Sector
2024-01-05 05:13:29 ET
Summary
- The iShares US Energy ETF underperformed the S&P 500 in 2023, while technology stocks led the market.
- Fund outflows, higher expense ratios, and lower dividend yield lead to muted risk/reward prospects for IYE.
- In my view, IYE is not the best option for gaining exposure to the oil & gas sector.
Investment thesis
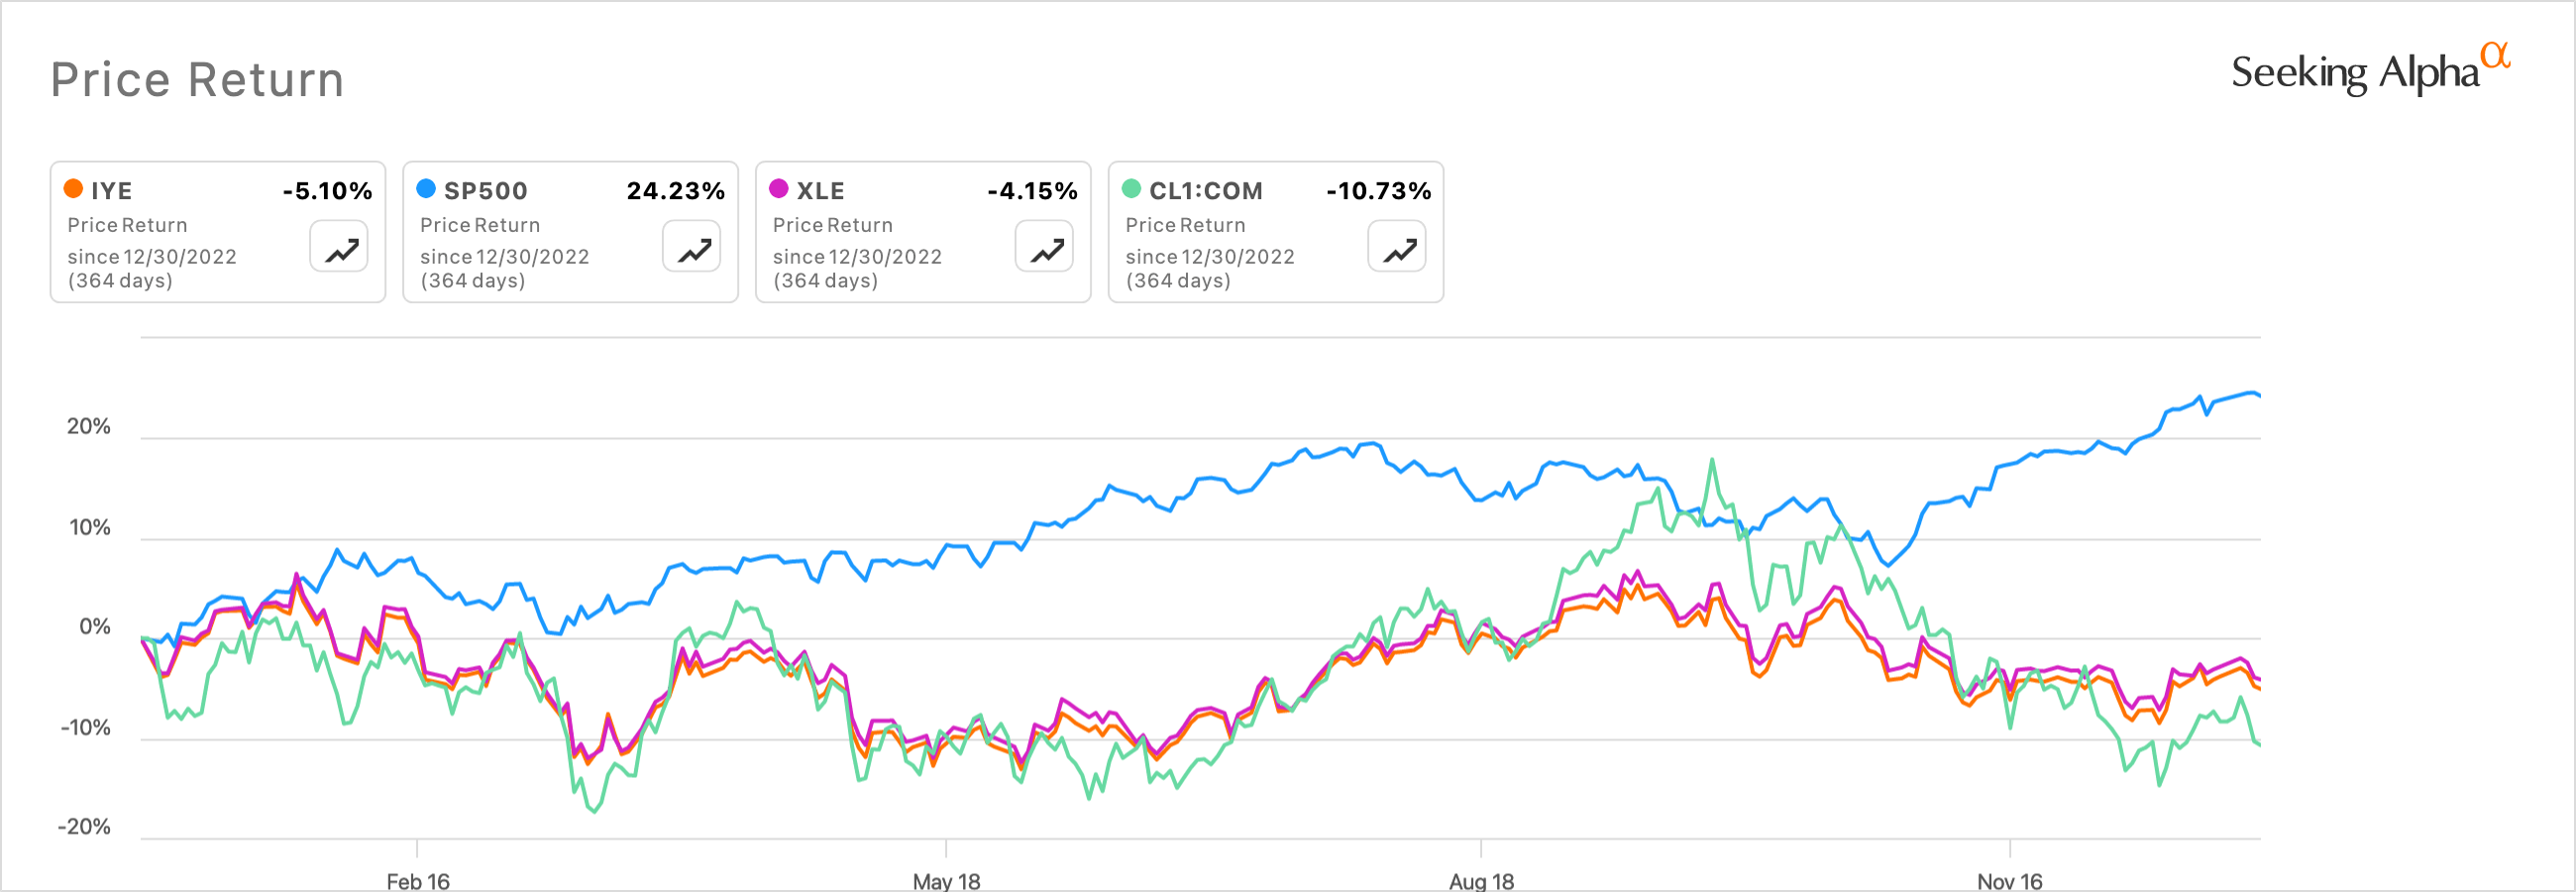
The iShares US Energy ETF (IYE) largely underperformed the S&P 500 ( SP500 ) in 2023. Most of the stock market's growth was led by technology complex with the XLK (XLK) fund returning 55% for investors last year while pulling most of the S&P 500 including Nasdaq 100's (NDX) impressive 43% gain. The Energy Select Sector SPDR® ETF (XLE), usually seen as a barometer for the energy sector's performance in the stock market, was down 4.2% in the same period.
Last month, I had published a note on my outlook for oil prices in 2024 and beyond where I had pointed out reasons I believe oil prices would head higher in 2024. So far, in 2024, with just a few days of trading sessions wrapped up, we can already see how investors have tried to reallocate capital towards last year's laggards such as the oil sector. At the time of writing this research, the XLE is up 2.7% week-to-date, while the SP500 is down -1.36% with the XLK down further at 3.6%. IYE is not far behind XLE, with the fund up 2.3% week-to-date.
When it comes to researching IYE, I believe there are better alternatives available to participate in the oil & gas sector. In this post, I will talk about my reasoning for being neutral about IYE.
About IYE
IYE is issued by the world's largest asset management company, BlackRock. The fund seeks to provide exposure to domestic oil and gas companies in the U.S. The fund aims to achieve this by tracking the Russell 1000 Energy RIC 22.5/45 Capped Index, which measures the performance of the U.S. energy sector. I will briefly explain the meaning of the capped index here by linking literature from LSEG (see Section 6 ).
At the quarterly index reviews, all companies that have a weight greater than 4.5% in aggregate are no more than 45% of the index, and no individual company in the index has a weight greater than 22.5% of the index.
By tracking the Russell 1000 Energy RIC 22.5/45 Capped Index, the IYE has to make sure that no component in its fund is larger than 22.5% of the fund's assets. This is one major difference between IYE and other energy ETF's.
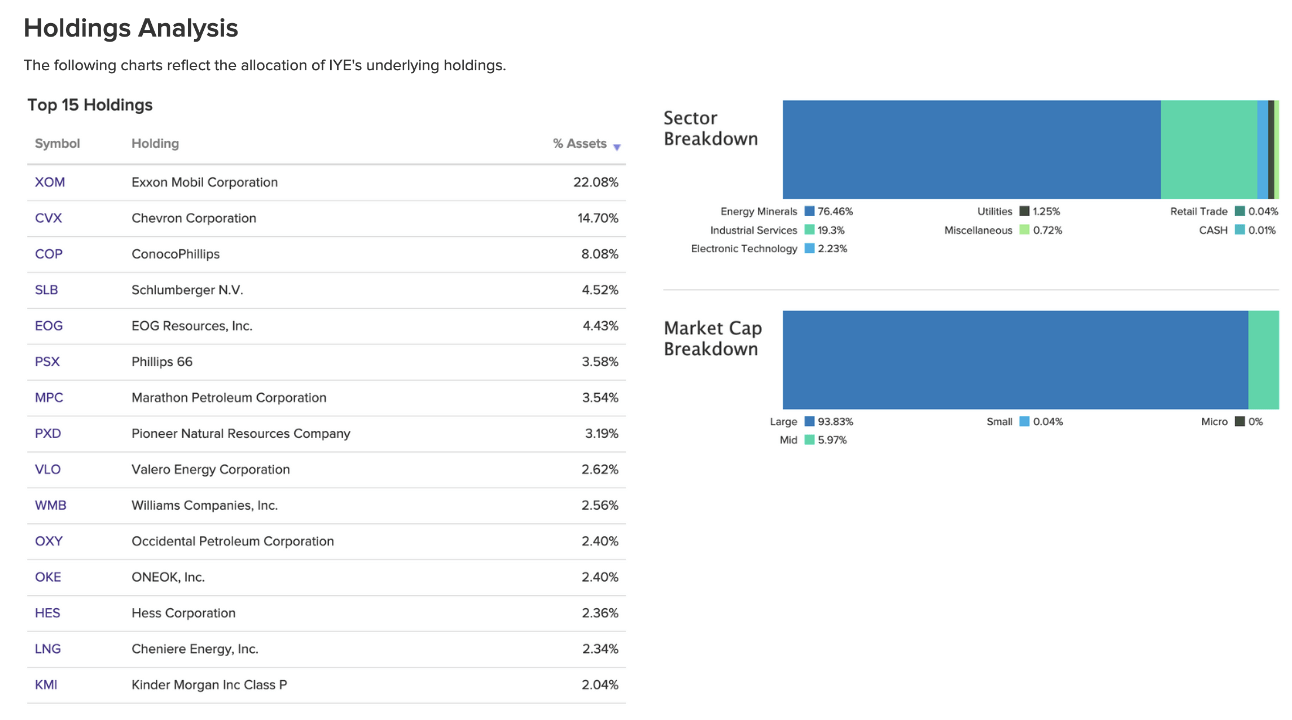
Still, a significant part of IYE's funds is deployed towards larger names in the U.S. energy sector, as can be seen in the chart below.
Given that the objective of the fund is to offer exposure to the U.S. energy sector, it is easy to observe the positive correlation between WTI oil prices and the IYE. In the chart below, I have also added the XLE fund to the mix.
Peer Comparison
Looking at the Holdings Analysis chart in the previous section, a couple of things immediately stand out to me. First, the fund is more diversified than its largest peer, the XLE by nature of the underlying Russell 1000 Energy RIC 22.5/45 Capped Index that it tracks. The fund also maintains a slightly larger exposure to the Oil Services complex of stocks vs. its peers.
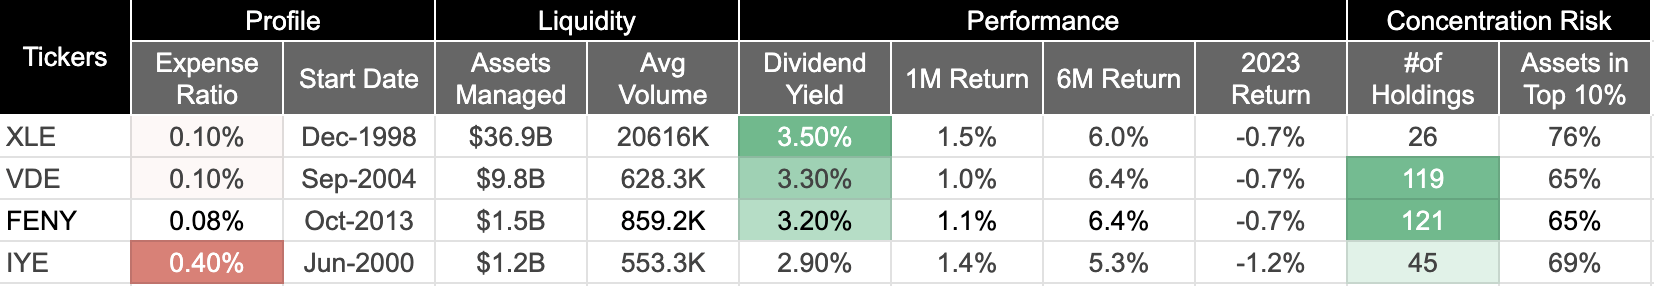
Here is how IYE compares with some of its peers. The list below is ordered by largest-to-smallest fund in terms of assets managed.
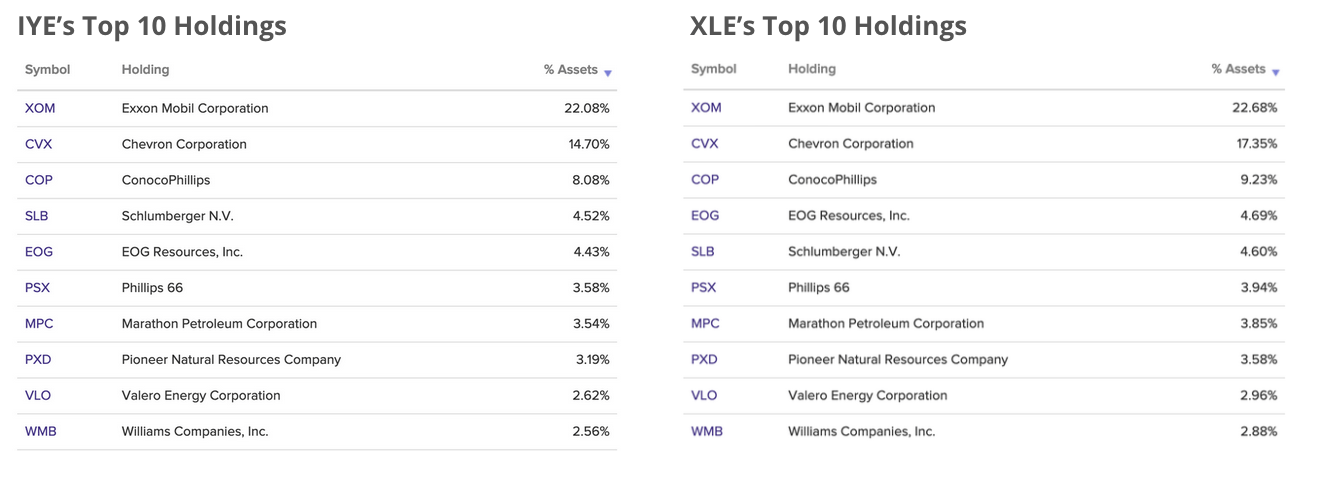
Observing the peer comparison chart, it looks like the IYE fund is quite similar to the XLE fund in terms of its top holdings. While 76% of the XLE's assets are deployed in the top 10 stocks, 69% of the IYE's assets are invested in the top 10. So I added a head-to-head comparison of IYE's Top 10 holdings vs. XLE's Top 10 holdings to observe if there is any variation in the XLE's and IYE's top 10 stock components.
I can immediately see how similar the Top 10 holdings of both the XLE and IYE etfs are, as there is a near 100% match. Having established this similarity, I do not see any comparative edge that IYE offers over XLE, especially when it is four times cheaper to invest in the XLE vs. the IYE while securing a higher dividend yield.
IYE's risk/reward prospects are muted as compared to peers
In the previous section, I explained how IYE fails to impress me compared to its peers. It is far more expensive to invest in IYE versus other ETFs in the energy sector; it offers relatively inferior dividend yields; and it is also the smallest ETF in terms of assets managed, despite being one of the earliest ETFs to offer exposure to the U.S. energy space.
Further, in terms of its risk/reward, the IYE does not offer a compelling reason for me to get excited. To illustrate this, I have taken a different approach and used IYE to historically compare the fund versus the largest energy ETF, XLE, and observe its correlation with oil prices.
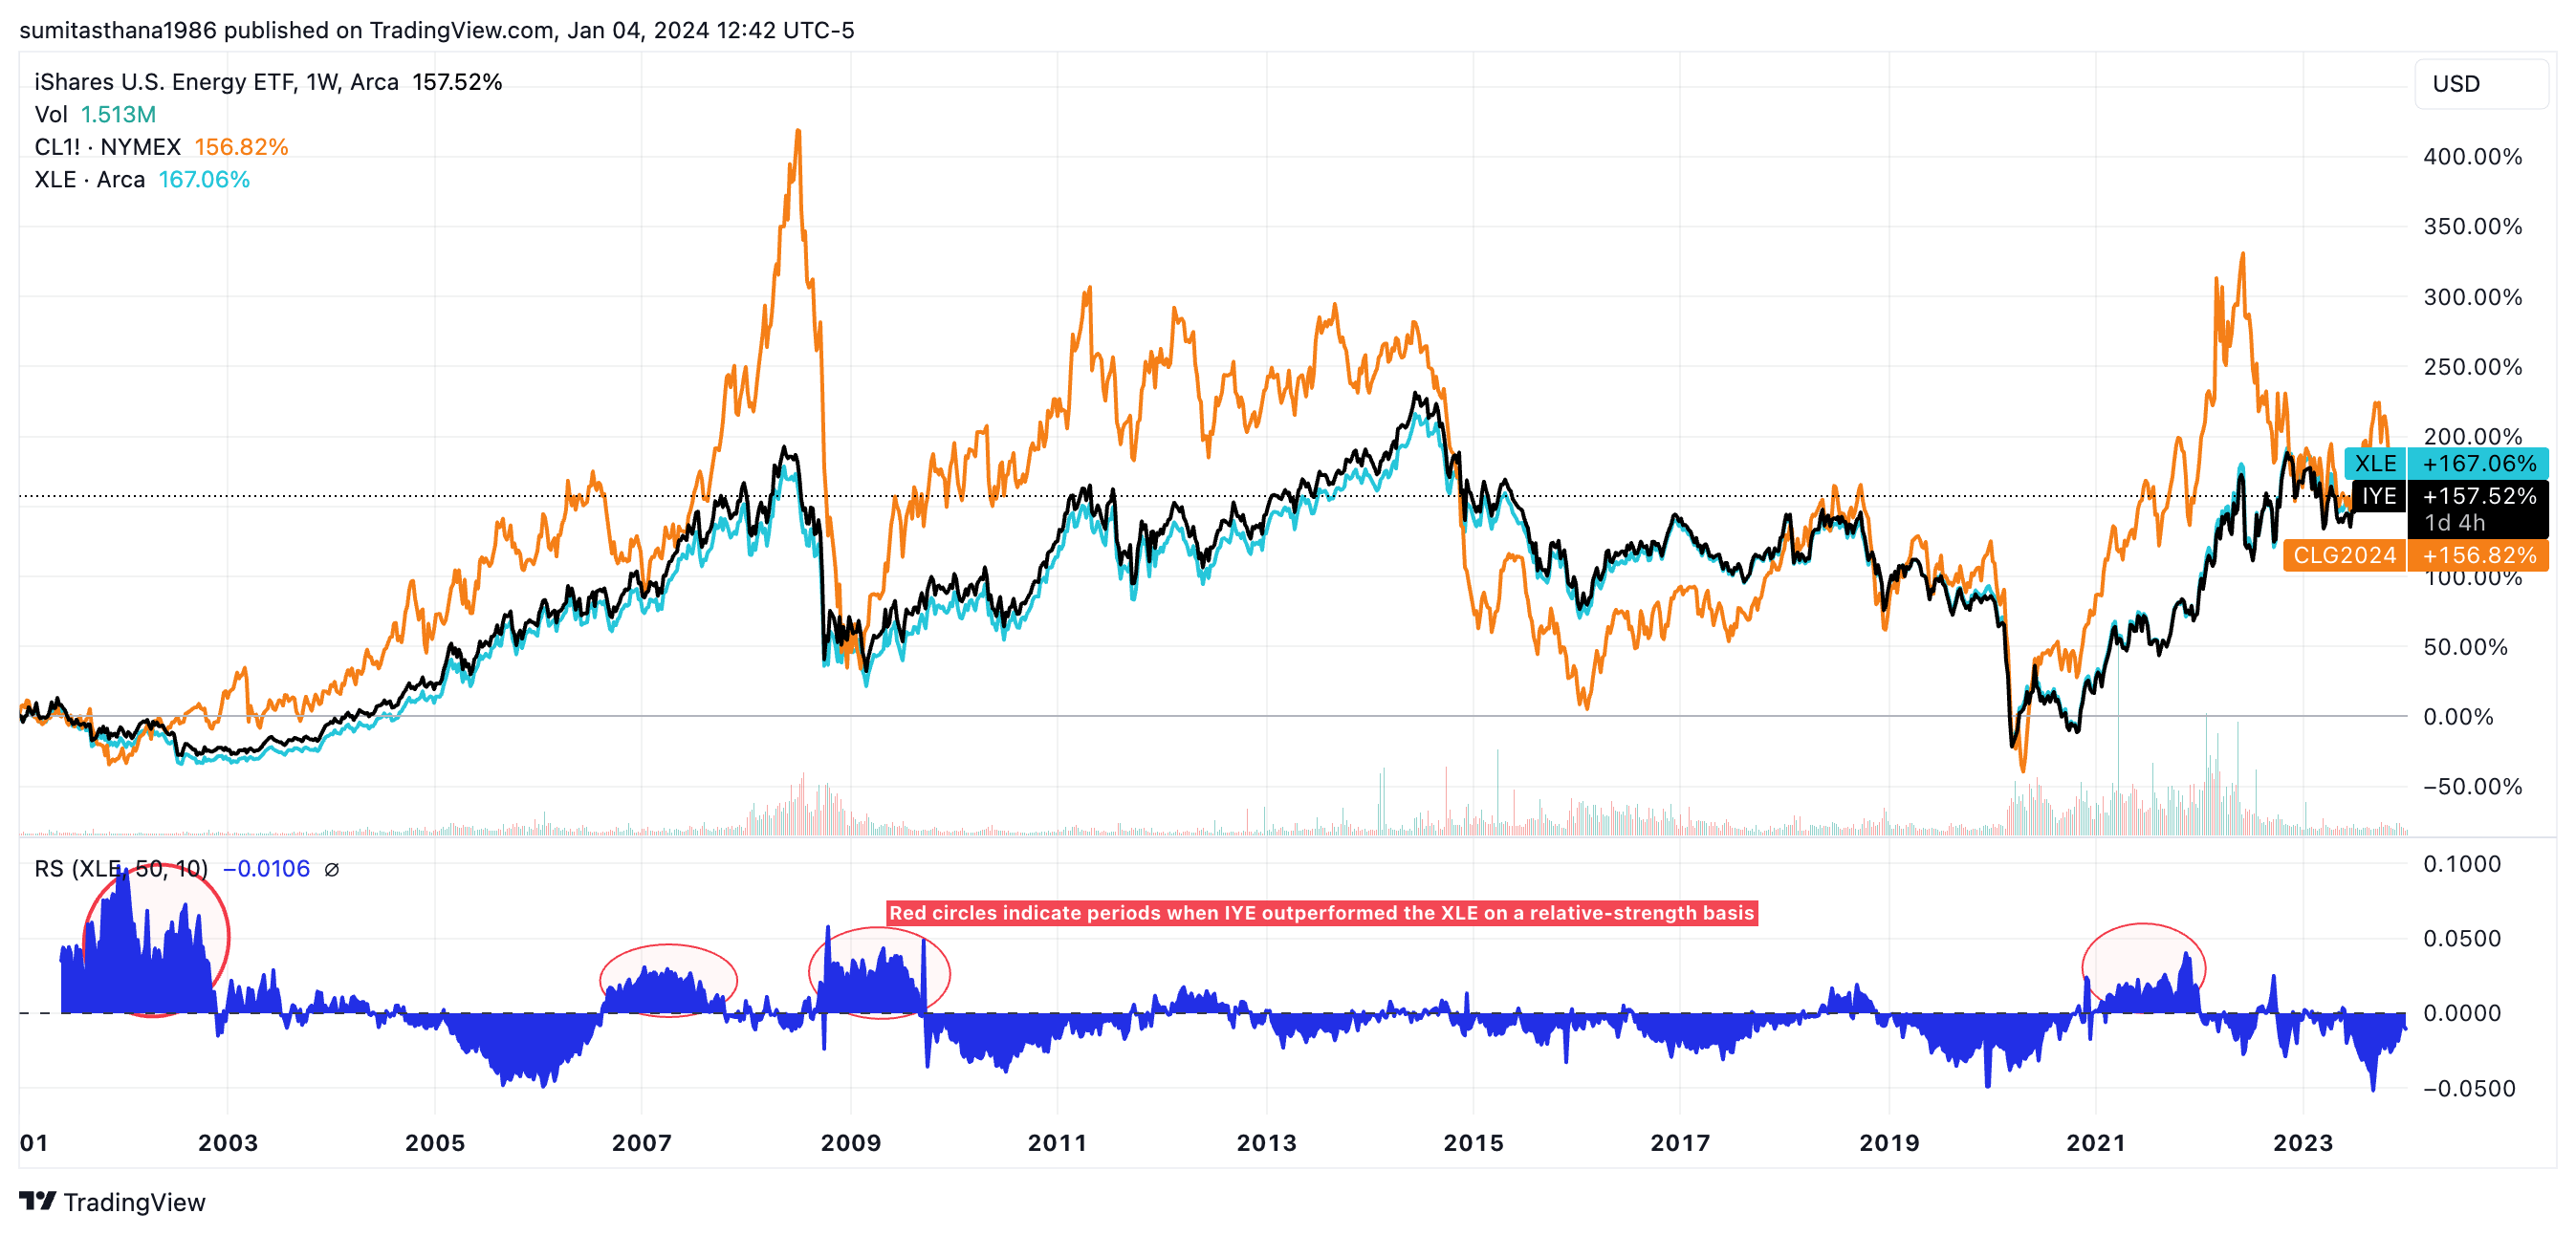
The chart above has two sections. The line chart is a comparison of IYE's historical prices vs. prices of crude oil futures for the next subsequent month's delivery, while the bottom histogram (in blue) is the price movement of the IYE relative to the XLE since the inception of the IYE. The first observation that stands out is that the XLE has beat IYE since January 2001 gaining 167% vs. the IYE which gained 157%. But the real difference in IYE's performance lies in its comparison to the XLE when evaluating the relative strength of IYE vs. XLE, which can be seen in the histogram. I calculated the relative strength by dividing the weekly percentage change of IYE by the percentage change of XLE.
Looking at the histogram, there are only four periods of one year or more when the IYE outperformed the XLE, as outlined in the red circles. This gives me more confidence that the IYE is at best a sectoral-rotation play vs. a secular play. Given my long-term bullish outlook on oil, the risk/reward benefits that XLE offers are far superior to those of IYE.
Fund Flow charts are weaker for IYE vs Peers
Fund flows are essentially investor capital that flows in or out of financial assets over a period of time. Typically, fund flows are looked at to observe where investors are deploying their money or pulling their capital out of financial assets. While it does not necessarily illustrate the performance of the financial asset, I observe fund flows purely as a forward-looking tool to gauge the shifting trends of investor sentiment and observe which financial assets (ETFs in this case) investors are parking their money in. The higher the flow of funds, the higher the rising sentiment for the ETF.
In the case of the IYE, we can see that there has been a relatively higher outflow of funds from the IYE compared to the flows of funds from its peers.
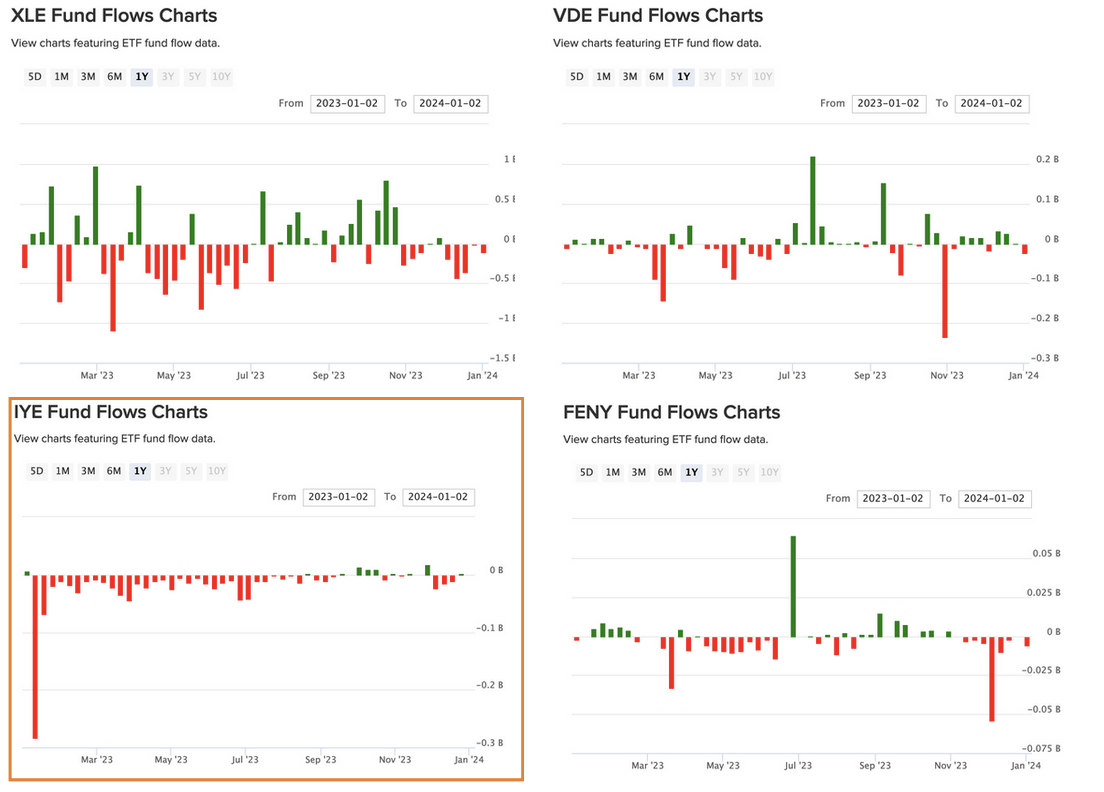
To me, this is another sign that the IYE is out of favor as the preferred ETF for gaining exposure to the U.S. oil and energy sector as compared to its peers.
Risks and other considerations to factor in
As I had previously outlined , my overall outlook for investing in oil remains strong. In the post, I mentioned why USO would be a good ETF if the sole purpose of investing in oil was to track the prices of oil barrels. But ETFs such as IYE and XLE offer investors general exposure to the broader oil and energy sector by investing fund assets in different kinds of oil companies that operate in areas such as oil production, oil services, or horizontally integrated oil companies.
While my macro outlook for oil has not changed and I still see upside, I want to add that changes in global consumption patterns of oil would affect the growth prospects of Big Oil stocks (usually represented by XOM , CVX , MRO , PSX , VLO & COP ) and hence would also affect IYE and XLE. In fact, a forecast by the IEA states that they are further increasing their projections for global oil consumption by 130K barrels per day to 1.1M barrels per day. China is usually another huge factor in the consumption of oil. Despite the weak growth in the Chinese economy last year, the emerging economy was responsible for a 78% increase in oil consumption. If China's economy were to falter again in 2024, this would add severe headwinds to global oil consumption.
Conclusion
After evaluating IYE and comparing it to its peers, such as the XLE, I believe there are better alternatives to gain exposure to the U.S. energy industry. While I am generally bullish on the energy sector, IYE has some disadvantages, particularly in regard to its high expense ratio and lower dividend yield. The direction of its fund outflows last year does not look promising, and the risk/reward offered by its exposure to the energy sector is subpar given the outperformance by its peers. Given these factors, I hold a neutral stance on IYE.
For further details see:
IYE: There Are Better Alternatives To Play The Oil And Gas Sector