OILX - January Non-OPEC Oil Production Drops
2023-05-12 00:05:00 ET
Summary
- January Non-OPEC oil production increased by 583 kb/d to 51,166 kb/d. The largest increase came from the US, 347 kb/d.
- From February 2023 to December 2024, oil production in Non-OPEC countries is expected to increase by 1,374 kb/d.
- The major contributors are expected to be US, Canada, Norway and Guyana. Russia is expected to provide the largest drop.
A guest post by Ovi
Below are a number of Crude plus Condensate (C + C) production charts, usually shortened to “oil”, for Non-OPEC countries. The charts are created from data provided by the EIA’s International Energy Statistics and are updated to January 2023.
This is the latest and most detailed world oil production information available. Information from other sources such as OPEC, the STEO and country-specific sites such as Russia, Brazil, Norway and China is used to provide a short-term outlook for future output and direction for a few of these countries and the world. The US report has an expanded view beyond production by adding rig and frac spread charts.
January Non-OPEC oil production increased by 583 kb/d to 51,166 kb/d. The largest increase came from the US, 347 kb/d.
Using data from the May 2023 STEO, a projection for Non-OPEC oil output was made for the period February 2023 to December 2024. (Red graph). Output is expected to reach 52,683 kb/d in December 2024, which is 282 kb/d higher than the December 2019 peak of 52,401 kb/d.
From February 2023 to December 2024, oil production in Non-OPEC countries is expected to increase by 1,374 kb/d . The major contributors are expected to be US, Canada, Norway and Guyana. Russia is expected to provide the largest drop.
From February 2023 to December 2024, production in Non-OPEC countries w/o the US is expected to increase by 912 kb/d. This implies that 462 kb/d of the output increase seen from February 2023 to December 2024 in the previous chart is expected to come from the US.
Note that December 2024 output exceeds the pre-covid high of 39,537 kb/d in January 2020.
Non-OPEC Oil Production Ranked by Country
Listed above are the World’s 10 largest Non-OPEC producers. The criteria for inclusion in the table is that all of the countries produce more than 1,000 kb/d.
January saw a reversal of the previous month's decrease. The January production increase for these ten Non-OPEC countries was 773 kb/d while as a whole the Non-OPEC countries saw a production increase of 583 kb/d.
The trend change from decreasing supply to increasing supply is largely due to a rebound in US production along with increases from China and Brazil. The US had the largest production increase in January, 347 kb/d.
In December 2022, these 10 countries produced 83.6% of Non-OPEC oil production.
OPEC C + C production dropped by 487 kb/d in January while it increased YoY by 47 7 kb/d. World MoM production increased by 96 kb/d primarily due to a 202 kb/d downward revision of the previous December output from 81,775 kb/d to 81,573 kb/d. YoY output increased by 2,034 kb/d.
Non-OPEC Oil Production Charts
The EIA reported Brazil’s January production increased by 201 kb/d to 3,274 kb/d.
Brazil’s National Petroleum Association (BNPA) reported that February’s output decreased by 12 kb/d and March dropped further by 147 kb/d to 3,115 kb/d, red markers.
Much of Brazil’s upcoming 2023 production growth of close to 100 kb/d will be from the highly productive pre-salt fields. From Jan 2022 to January 2023, production from the pre-salt fields increased by 197 kb/d.
According to the EIA, Canada’s January output increased by 15 kb/d to 4,642 kb/d. Using information from the Canada Energy Regulator, February production is expected to rise by close to 73 kb/d to 4,715 kb/d, red marker. The rebound in March production is related to the extreme cold weather that affected Alberta production in December.
Rail shipments to the US in February decreased by 21 kb/d to 99 kb/d. This is the lowest rate since November 2020.
The EIA reported China’s oil output increased by 195 kb/d to 4,168 kb/d in January . The China National Bureau of Statistics reported that the average production during January and February was 4,228 kb/d, a significant increase over December.
Since the April EIA report shows that January output is 60 kb/d below the average, February’s output has been increased by 60 kb/d to 4,288 kb/d. The China National Bureau of Statistics reported that March production was 4,281 kb/d, red marker, which is consistent with February production.
Kazakhstan’s output decreased by 13 kb/d in January to 1,935 kb/d.
Mexico’s production as reported by the EIA for January was 1,803 kb/d, an increase of 52 kb/d over December.
The February and March estimates, red markers, were obtained by using the Pemex increments over January production and adding those to the EIA’s January output because Pemex reports higher production than the EIA due to a different definition for condensate. March production increased by 5 kb/d over January.
The EIA reported that Norway’s January production decreased by 7 kb/d to 1,790 kb/d.
The Norway Petroleum Directorate ((NPD)) reported that production in February increased by 10 kb/d to 1,800 kb/d and then increased by 49 kb/d to 1,849 kb/d in March. (Red markers).
Now that the entire Johan Sverdrup field is on stream, it will be interesting to see if the December 2021 post-pandemic production high of 1,861 kb/d will be exceeded in the next few months.
According to the NPD , “Oil production in March was 0.1 percent higher than the NPD’s forecast and 1.7 percent lower than the forecast so far this year.”
Oman’s production has risen very consistently since the low of May 2020. However Oman’s November and December production decreased by 38 kb/d to 1,056 kb/d. January may have reversed that falling trend by adding 9 kb/d to 1,065 kb/d.
January’s output was unchanged at 1,322 kb/d. I assume the EIA is not getting monthly updated production information. I also note that the OPEC MOMR shows no change in production.
The EIA reported that Russian output decreased by 25 kb/d in January to 10,327 kb/d.
January Russia Ministry production is shown to be 10,727 kb/d based on previous Ministry data that showed Russian production as reported by Russia Energy Ministry was 400 kb/d higher than reported by the EIA.
Argus Media reported that Russian crude production in March 2023 was 9,700 kb/d, 500 kb/d lower than February. If the typical Russian monthly condensate output of 900 kb/d is added to the crude production, Russian C + C in March would be close to 10,600 kb/d, blue markers. This production level is also being reported by TASS . Note the last line “We had 10.2 mln barrels per day in February,” Novak said.”
The Argus Media May report shows that Russian April production increased by 30 kb/d to 10,630 kb/d, after allowing for 900 kb/d of condensate, blue markers.
The EIA reported UK’s production decreased by 30 kb/d in January to 667 kb/d.
According to this source , February’s production rebounded to 785 kb/d, red marker.
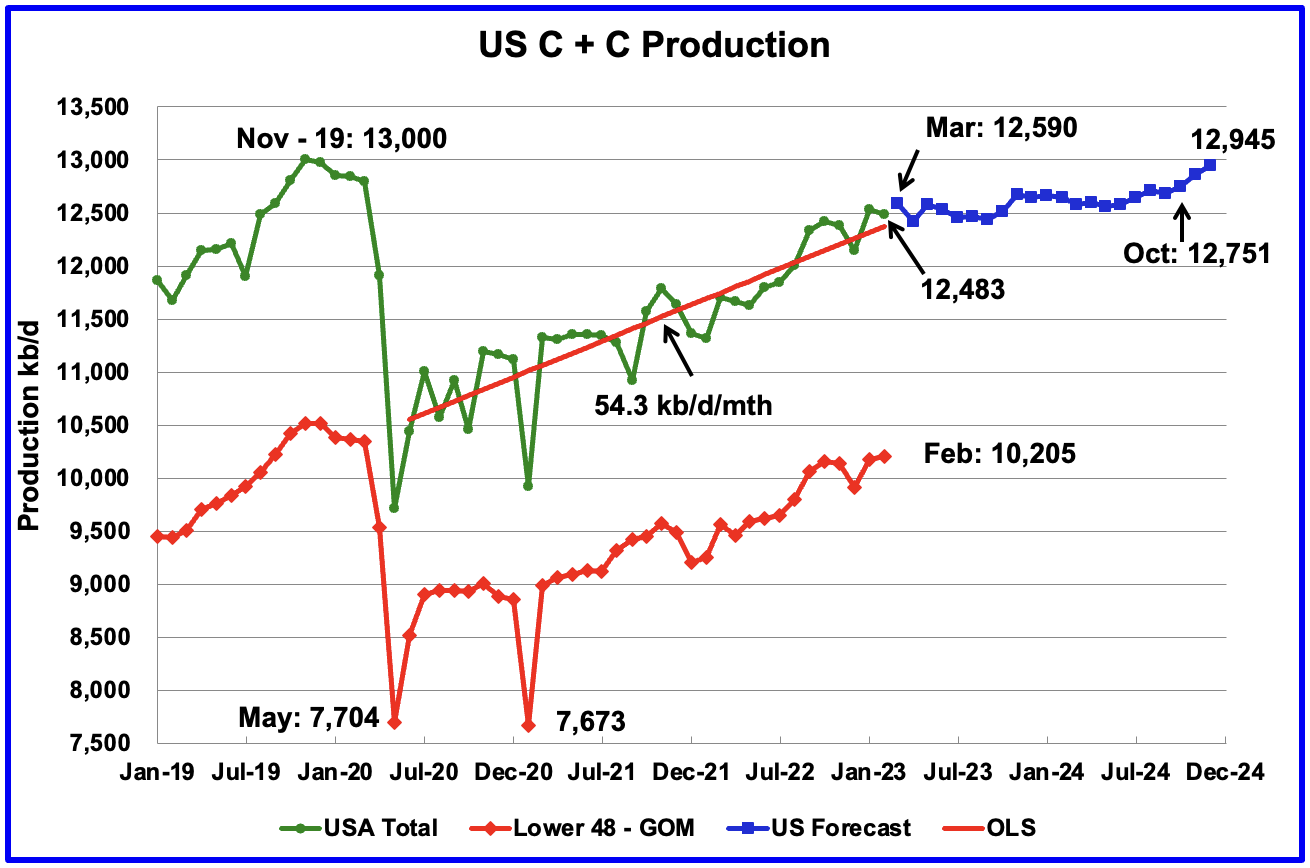
U.S. oil production in February decreased by 53 kb/d to 12,483 kb/d. The 53 kb/d drop, is due to the upward revision of January production from 12,462 kb/d to 12,536 kb/d, an increase of 74 kb/d. Output in December 2024 is expected to reach 12,945 kb/d.
Since the beginning of April 2021 through to the week ending July 29, 2022, the US added horizontal oil rigs at a rate of close to 3.76 rigs/wk, orange OLS line, and peaked at 551 rigs in the week ending July 29. However since then the number of operational rigs has wondered primarily sideways.
A high of 572 rigs was reached in the week ending November 25, 2022. In the week ending May 5, 2023 the number of rigs decreased by 6 to 535 and are down 37 from the recent high of 572.
In the week ending May 5, Permian rigs decreased by 4 to 341 and Texas rigs dropped by 5 to 306. Note that the general trend for rigs in the Permian is a slow increase from September 2022 and is currently 10 higher than the 331 rigs on July 1, 2022.
For frac spreads, the general trend since the week of January 6, 2023 can best be described as recovering from the slowdown associated with the 2022 Thanksgiving and Christmas holidays.
This trend is a repeat of what happened last year. However there is one difference. Last year the recovery took place over 9 weeks while this year it has taken 17 weeks so far and has still not fully recovered to 300 frac spreads.
For the week ending May 5, the Frac count decreased by 5 to 282. Note that these 282 frac spreads include both gas and oil spreads.
This interesting comment appeared in this North Dakota source regarding the availability of Frac crews: “Well completions rose in February and dropped in March due to volatility in the availability of fracking crews, Helms added.” Is this shortage a North Dakota issue or does it also apply in the Permian?
These six countries complete the list of Non-OPEC countries with annual production between 500 kb/d and 1,000 kb/d. Note that the UK has been added to this list since its production has been below 1,000 kb/d since 2020.
Their combined January production was 3,842 kb/d, down 82 kb/d from December.
The overall output from the above six countries has been in a slow steady decline since 2014 and appears to have accelerated after 2019.
Normally, the Non-OPEC post does not track Guyana on a monthly basis because its production is less than 500 kb/d. However in the comments under the first chart, Guyana is mentioned as one country that will contribute to the increase in Non-OPEC production over the next few years.
This chart provides an update on where Guyana’s current oil production is on its expected production goal of 1,200 kb/d by 2027.
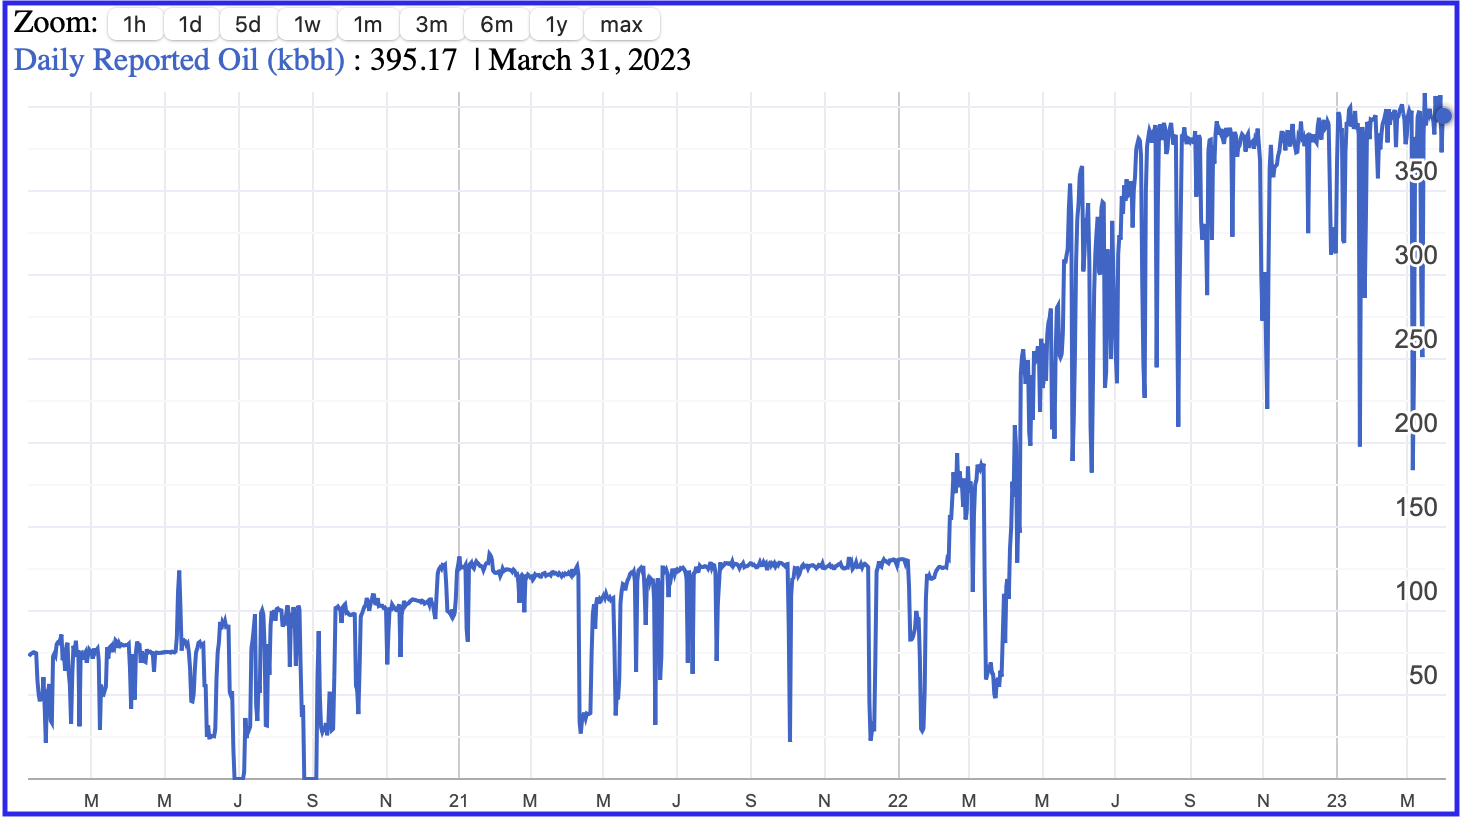
The EIA reports that Guyana was producing 350 kb/d of oil in January 2023 and it has been flat since July 2022. The Guyana Ministry of Natural Resources is reporting that as of March 31, 2023 production had reached a daily rate 395 kb/d; see next chart. This production was coming from two currently operational Floating Production Storage and Offloading (FPSOs) vessels. More FPSOs are being built to increase production.
This is a one year chart from the Guyana Ministry of Natural Resources which shows how oil production has been ramping up since early 2022. Production on March 31 was 395.2 kb/d.
Can someone provide an explanation for what causes the temporary sharp drops in oil production?
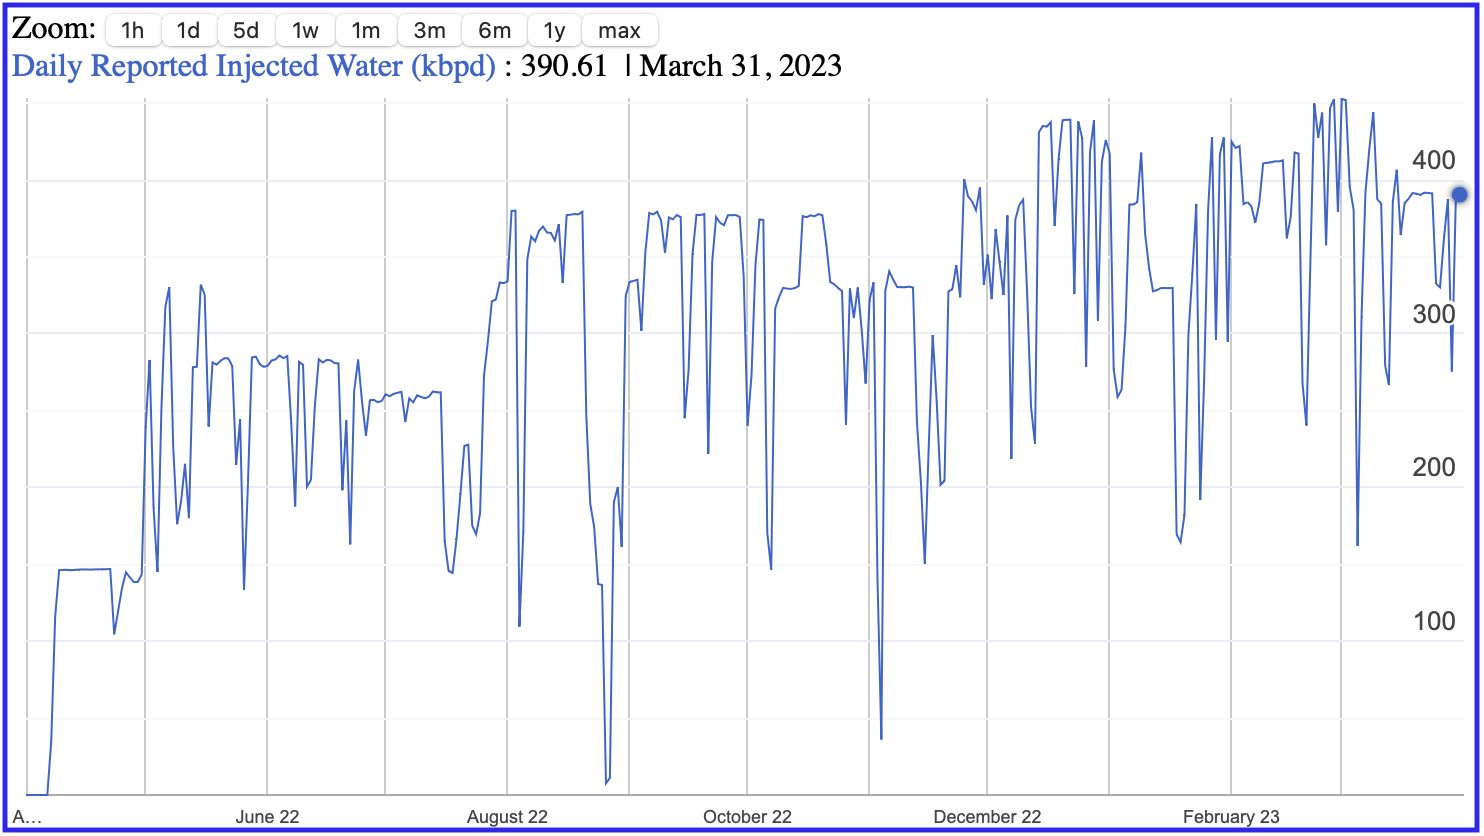
This is a one year chart from the Guyana Ministry of Natural Resources which shows how water injection is being used to pump oil and maintain reservoir pressure. On March 31, 2023, 390.6 kb/d of water were being injected to produce 395.2 kb/d of oil.
World Oil Production Ranked by Country
Above are listed the World’s 12th largest oil producers. In January 2022, these 12 countries produced 76.7% of the world’s oil. On a MoM basis, production increased by 145 kb/d while on a YoY basis, production increased by 1,787 kb/d.
World oil production increased by 96 kb/d in January. The largest increases came from the US, 347 kb/d while China and Brazil added a combined increase of 396 kb/d. These two combined increases of 743 kb/d were offset by Saudi Arabia’s 711 kb/d drop.
World Oil Production Projection
World oil production in January increased by 96 kb/d to 81,669 kb/d according to the EIA (Green graph). However, the increase was primarily due to a 202 kb/d downward revision of the previous December’s output from 81,775 kb/d to 81,573 kb/d. February output is expected to add 160 kb/d to 81,829 kb/d.
This chart also projects World C + C production out to December 2024. It uses the May 2023 STEO report along with the International Energy Statistics to make the projection. (Red markers).
The red graph forecasts that World crude production in December 2024 will be 83,493 kb/d. The Blue graph adds another correction factor into the red forecast.
In Brazil, the months from May to October report high ethanol production, which adds to Brazil’s all liquids output. The blue graph reflects the additional correction factor required to correct for the high ethanol output. As can be seen, the blue graph is projecting additional production of 290 kb/d for February output over the red graph. This will be checked in the next post to see which one is more accurate.
Note that the December 2024 production is getting closer to the November 2018 high of 84,586 kb/d.
Also note the production spike between December 2023 and January 2024 is OPEC’s re-introduction of a production increase of 1,000 kb/d to partially reverse some of the previous production cuts.
The big drop in the blue graph from March to May may be due to the second round of OPEC + cuts.
World without the US oil output in January decreased by 291 kb/d to 69,134 kb/d. February’s output is expected to increase by 212 kb/d to 69,346 kb/d. December 2024 output of 70,548 kb/d is 2,245 kb/d lower than October 2018 output of 72,793 kb/d.
World oil production w/o the U.S. from January 2022 to December 2024 is forecast to increase by a total of 1,202 kb/d. In January 2024, OPEC is expected to add 1,000 kb/d.
Editor's Note: The summary bullets for this article were chosen by Seeking Alpha editors.
For further details see:
January Non-OPEC Oil Production Drops