JPIE - JPIE: Debt ETF With A Hedge Fund Strategy
2023-11-20 15:26:17 ET
Summary
- JPMorgan Income ETF is an actively managed debt fund with a dividend yield of 6.17% and an expense ratio of 0.41%.
- Its hedge-fund-like strategy is extremely flexible and adaptative, which comes with two drawbacks: a lack of transparency and a high turnover.
- The JPIE ETF has performed quite well for 2 years relative to benchmarks and peers, and it has lagged in the last few months with a safer risk profile.
Strategy and portfolio
JPMorgan Income ETF ( JPIE ) is an actively managed debt fund with a dividend yield of 6.17% and an expense ratio of 0.41%. Distributions are paid monthly. This exchange-traded funds, or ETF, has 2 years of existence: it was launched on 10/28/2021.
As described by JPMorgan , the fund seeks to provide income with a secondary objective of capital appreciation. Managers select securities with a high potential of income and low correlations to each other, and the fund seeks to manage distributions so as to reduce monthly dividend variability. JPIE may invest in all regions, including emerging markets. The fund is opportunistic with a few principles:
- Non-dollar denominated securities should not represent more than 10% of assets.
- The average duration should not be more than 10 years.
- At least 35% of assets should be in securities rated as investment grade or equivalent.
However, these are guidelines, not rules: the fund may go beyond these thresholds depending on opportunities and market conditions.
JPIE may invest in all kinds of debt, hybrid assets (including preferred stocks), derivatives (futures, options, swaps, CDS, forward contracts), and cash equivalents. It uses a tactical approach combining strategy rotation and asset rotation based on fundamental, quantitative and technical analysis. The fund may be concentrated in one asset category from time to time. Therefore, the current portfolio composition reflects the vision of management on current market conditions, not structuring rules.
The portfolio turnover rate is very high: 216% in the last fiscal year.
The next chart plots the weights of the different debt sectors in the fund’s asset value. Agency MBS (mortgage-backed securities) come in first position with 24.5%, and the aggregate weight of all MBS is 41.3%.
Industry breakdown (Chart: author; data: JPMorgan)
Regarding credit risk, 58.9% of assets have an investment grade rating (BBB and above) and as much as 39.2% is rated AAA. It is rather a low-risk profile.
Quality breakdown (Chart: author; data: JPMorgan)
The portfolio’s average life is 5.17 years and the average life is 3.09 years.
Asset Life Breakdown (Chart: author; data: JPMorgan)
The portfolio has 1461 constituents. The next table lists the top 10 holdings, which represent 12.7% of assets. They are all Agency Mortgage-Backed Securities (“GNMA” is Ginnie Mae and “UMBS” designates securities issued by Freddie Mac).
| Name |
| Security Identifier |
| Weight |
| GNMA II 6.5% 10/53 |
| 36179YHU1 |
| 3.54% |
| UMBS MORTPASS 6.5% 11/53 |
| 31418EXW5 |
| 1.94% |
| UMBS MORTPASS 6% 11/53 |
| 31418EXV7 |
| 1.91% |
| TBA GNMA2 SINGLE 6% 07/35 |
| 01H0606C2 |
| 1.57% |
| GNMA II 6.5% 09/53 |
| 36179YFN9 |
| 0.69% |
| UMBS MORTPASS 6.5% 10/53 |
| 31418EW55 |
| 0.66% |
| UMBS MORTPASS 6% 07/53 |
| 31418ET75 |
| 0.66% |
| UMBS MORTPASS 5.5% 02/53 |
| 31418EPD6 |
| 0.61% |
| UMBS MORTPASS 6% 01/53 |
| 31418ENL0 |
| 0.59% |
| GNMA II MORTPASS 7% 09/53 |
| 36179YFP4 |
| 0.52% |
Performance relative to the bond market
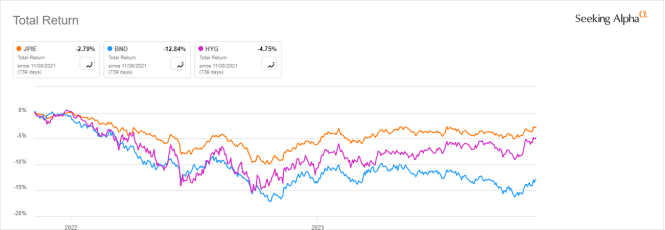
The next chart compares JPIE total return since inception with an aggregate bond index and a high-yield bond index, represented by:
JPIE vs bond benchmarks (Seeking Alpha )
JPIE has outperformed both benchmarks. Nevertheless, the track record is too short to assess the strategy.
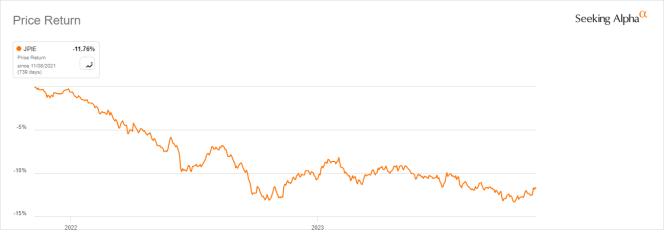
JPIE has lost almost 12% in price since inception (excluding distributions).
JPIE price return (Seeking Alpha)
Performance relative to peers
The next table compares characteristics of JPIE and two actively managed debt ETFs:
| JPIE |
| HYBL |
| HYLS |
| Inception |
| 10/28/2021 |
| 2/16/2022 |
| 2/25/2013 |
| Expense Ratio |
| 0.41% |
| 0.70% |
| 1.27% |
| AUM |
| $818.49M |
| $124.55M |
| $1.42B |
| Avg Daily Volume |
| 6.70M |
| $2.02M |
| $8.76M |
| Yield |
| 6.17% |
| 7.66% |
| 6.24% |
JPIE has the cheapest expense ratio and the lowest yield (yet almost on par with HYLS).
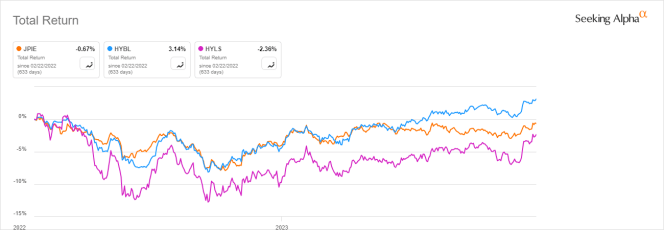
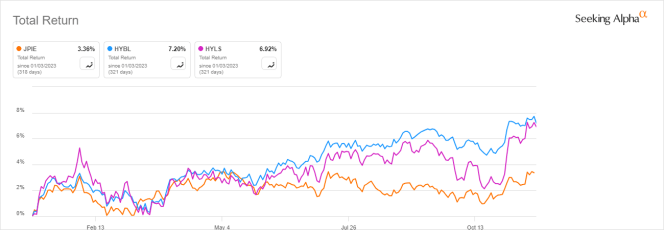
It is the second best performer since HYBL inception regarding total return, behind HYBL. However, it has been lagging both competitors in 2023 to date. This may be explained by the lower risk profile of the current portfolio, which comes with lower rewards, and also a lower volatility. HYBL, reviewed here , and HYLS have respectively 70% and 77% of asset value in debt with a credit rating below BB.
JPIE vs. Competitors since February 2022 (Seeking Alpha)
JPIE vs. Competitors, year-to-date (Seeking Alpha)
Takeaway
JPIE has performed quite well relative to benchmarks and peers for 2 years, but it has lagged in the last few months, by adopting a safer risk-reward profile. Data history is too short to tell how JPIE tactical approach will help navigate market gyrations. JPMorgan Income ETF's strategy is extremely flexible and highly adaptative, but it comes with two drawbacks: a lack of transparency and a high turnover. In fact, JPIE looks like a debt hedge fund with a cheap management fee and the simplicity of an ETF.
For further details see:
JPIE: Debt ETF With A Hedge Fund Strategy