JRI - JRI: Distribution Bump And Diversified 'Real Asset' Exposure
2024-01-12 05:08:27 ET
Summary
- Nuveen Real Asset Income and Growth Fund has increased its monthly distribution, putting it back above where it was early in 2023 before the cut.
- The fund's performance has been lackluster, but expectations for utilities and real estate performance going forward are more promising.
- JRI trades at an attractive discount both on a relative and absolute basis, which could see further potential upside if CEF discounts narrow broadly after widening to historically wide levels.
Written by Nick Ackerman, co-produced by Stanford Chemist.
Nuveen Real Asset Income and Growth Fund (JRI) recently announced an increase in its monthly distribution. The latest increase actually puts it back just above where it was at the start of 2023 when they made a cut to the monthly payout. This increase came despite what was a relatively lackluster performance throughout 2023, so the increase seems a bit unjustified.
On the other hand, expectations for utilities and real estate look more promising going forward than they do in the rearview mirror. For that reason, the argument could be made that an increased distribution makes sense. Regardless, this fund trades at an attractive discount that makes it worth considering.
We last took a look at JRI at the end of August 2023 ; since then, the fund's performance has been fairly respectable. However, it certainly didn't go in a flat direction. Instead, it took a big dive along with the broader equity and fixed-income markets. The fund is diversified with exposure throughout common and preferred stock as well as debt investments.
JRI Performance Since Prior Update (Seeking Alpha)
Due to the fund's discount, JRI remains a 'Buy' candidate today.
JRI Basics
- 1-Year Z-score: 1.23
- Discount: -12.97%
- Distribution Yield: 10.10%
- Expense Ratio: 1.80%
- Leverage: 29.89%
- Managed Assets: $507.452 million
- Structure: Perpetual
JRI seeks "to deliver a high level of current income and long-term capital appreciation by investing in real asset-related companies across the world and the capital structure, including common stocks, preferred securities, and debt." They define real asset-related companies as "those engaged in owning, operating, or developing infrastructure projects, facilities, and services, as well as REITs."
Further, they invest "up to 40% of its assets may be debt securities, all of which may be rated below investment grade, though no more than 10% of its assets may be invested in securities rated CCC+/Caa1 or lower at any time. Non-U.S. exposure represents 25% to 75% of the Fund's managed assets."
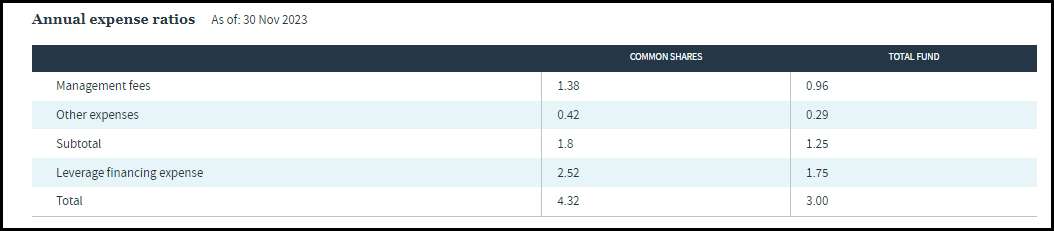
JRI runs a fairly high amount of leverage, but with some preferred and fixed-income exposure, that might make it relatively less volatile than if it were entirely allocated to equities. Still, any leverage adds additional risks due to higher volatility and costs. Looking at those costs increases the fund's total expense ratio to 4.32% to account for the 2.52% interest expense.
With a higher rate environment, those costs naturally ballooned higher. Fortunately for JRI shareholders, the fund also incorporates interest rate swaps to hedge against rising borrowings. Those helped provide capital gains to offset the higher cost of the interest expense.
According to their last semi-annual report , the average notional amount of interest rate swaps was $112.4 million. Against the average outstanding balance of $162.403 million in borrowings through that same period, that meant the entire balance wasn't hedged, but a large majority of it was.
Performance - Discounts Remains Attractive
The fund's focus on energy has meant weaker results over the long term; though 2021 and 2022 provided a significant recovery in that space, it had been the weakest performing sector in 5 of the years from 2014 to 2020. It was the second-worst-performing sector in 2017.
Now, it would seem that the fund's performance was mostly hindered by having exposure to utilities and real estate throughout the last couple of years when rates were increasing rapidly. With allocations to preferred and other debt instruments, it also meant even further interest rate sensitivity. Utilities and REITs are already interest-rate sensitive on their own.
So, there hasn't really been a period that has seen JRI's portfolio firing on all cylinders.
It can be hard to imagine why this would really change with such a history of basically struggling. However, I think the argument going forward is that with interest rates coming down, utilities and REITs can perform well. That also includes their fixed-income exposure, which should also see some pressures ease. That's another area where the interest rate headwinds could turn to tailwinds. We've already seen a significant lift. The wild card here seems to be the energy/pipeline exposure that JRI carries.
In general, a weaker market can drag all sectors down with it to a degree. The main catalyst seems to be that there is a point where interest rates are being cut too aggressively. That would likely be due to a much weaker-than-expected economy and having a 'hard landing' compared to what is looking like a potential 'soft landing.' A soft landing is looking almost achievable from the Fed at this point.
Overall, a weaker economy is not going to help out REITs, utilities or the energy sector. However, in such a scenario, REITs, and especially energy, are likely much more sensitive to economic conditions than utilities. So just like the potentially elusive soft landing of the Fed, JRI also can, under the right scenario, perform much better going forward - but it will take a fairly narrow path to get there.
In looking at JRI's valuation, the fund's deep discount is an appealing aspect of the fund currently. It saw its discount narrow some since our prior update, but it remains attractively valued today on a relative and absolute basis. That can provide a further catalyst of potential upside as CEF discounts have widened materially in the last couple of years.
Distribution - Receives A Bump
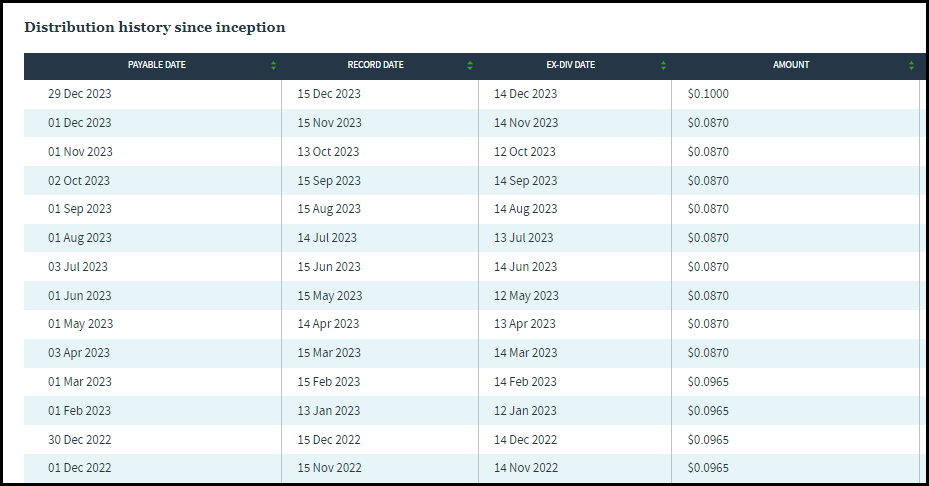
The latest distribution announcement was for a new monthly distribution amount of $0.10. That monthly amount brings it back over just a touch of where it was at the beginning of 2023, prior to when they cut the distribution.
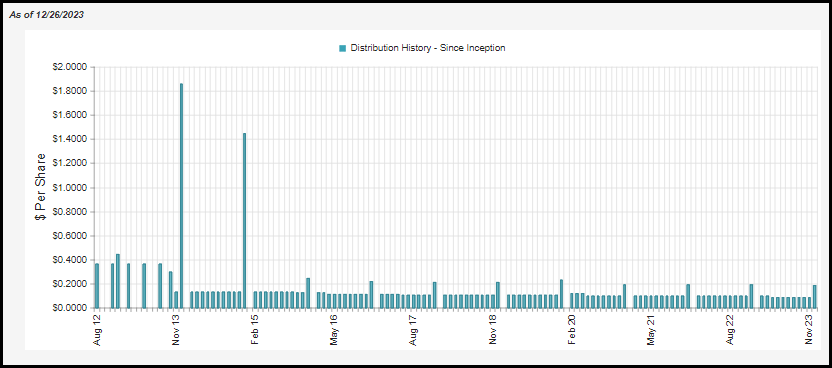
Overall, the general direction of the distribution has been mostly lower since the fund's inception.
So, if one is looking for a growing payout, this wouldn't be it. On the other hand, if one is looking for a decently diversified fund that utilizes a diversified portfolio of "real assets" that has a higher upfront yield, then this could check that box. That latest increase brought the fund's distribution rate to 10.10% with an NAV rate of 8.79%.
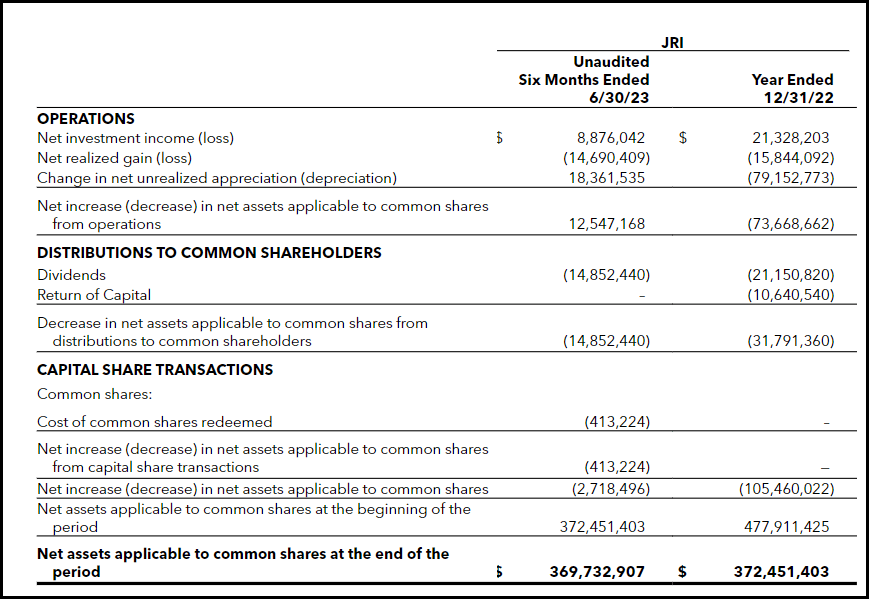
As is naturally the case for equity funds or most hybrid funds, they will require capital gains to fund their distribution. Net investment income, as of their last report, covered around 60% of the distributions paid.
On a per-share basis, for the six-month period, the fund generated an NII of $0.32. Against the new distribution, that would put coverage at around 53%. The rest would have to be made through capital gains. We can see in the report above that the fund hadn't realized gains to cover the payout in those six months, but there were enough unrealized gains to offset that amount.
Going back to the fund's hedging strategy with interest rate swaps, that had contributed positively during the period. That is, if it wasn't for the realized gains from the swaps, the realized losses for the fund would have been worse.
For tax purposes, the fund saw its 2022 distribution have a portion classified as return of capital. In this case, it would be destructive ROC as the fund's NAV declined.
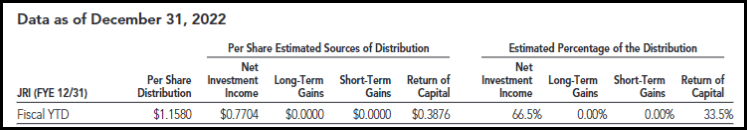
Though there can be some return of capital distributions classified here due to the fund's energy exposure, it primarily has been destructive ROC over the life of the fund as the NAV trend is lower.
JRI's Portfolio
JRI's portfolio has been relatively active, though it has been trending lower in the last year. The fund's annualized turnover rate would have come to 66%, according to their last semi-annual report. That would have been down from the 71% and 73% turnover rates seen in the prior two years. Those turnover rates are down themselves from the 102%, 90% and 92% the fund saw in 2020, 2019 and 2018, respectively.
Given that turnover, we can see some gyrations in the fund's portfolio, but they aren't necessarily material. At least not material in terms of the asset allocation, which has remained fairly static from our prior update. There was a slight change at the top, with infrastructure equity positions now being the largest weighting, but that was just up from the 21.5% previously.
At the same time, the real estate equity positions of the portfolio slipped but were quite similar to the previous 22.4% allocation. Similarly, the overall debt exposure between infrastructure and real estate had also stayed relatively static. The prior weights combined at 23.4% compared to the 24.6% listed now.
JRI Asset Allocation (Nuveen)
Speaking of the debt portfolio, there is a lean toward quality here with investment-grade rated debt. 64% of the fund is invested in BBB or higher debt. This can make the fund more interest rate sensitive, but it should help the fund be relatively more defensive during a downturn. The fund lists the average leverage-adjusted effective duration at 3.12 years. The average coupon comes in at 5.49%.
The fairly minute changes we see above mirror a similar to the fund's top sector allocation. There just haven't been too much in terms of drastic or material changes for the fund.
Even looking at the breakdown from a year ago in another previous article , pipelines and electric utilities were the fund's largest weightings by material amount previously, too. All other changes were small gyrations in percentage allocations for the sectors where JRI has relatively reduced exposure.
JRI Sector Allocation (Nuveen)
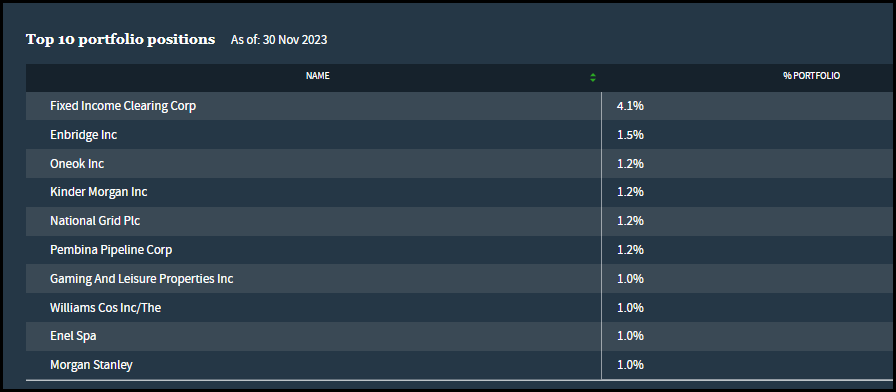
In looking at the names specific to JRI, we can see that the fund also isn't solely invested in U.S. investments. While that accounts for 62.5%, so a good majority of the portfolio, we also see some material exposure to Canada. More specifically, 12.4% of the portfolio was listed as being exposed to Canadian companies.
The rest are split from other countries around the world, but there are two other countries represented in the top ten. One of those is National Grid plc (NGG), a utility name located in the United Kingdom. Then the other name is Enel Spa (ENLAY), an Italian utility company. Both NGG and ENLAY have made their way into other top holdings of infrastructure funds, so they seem fairly popular in the investing world.
Overall, the fund lists 411 holdings. None of the holdings represent an outlandishly large allocation for the fund - aside from their cash equivalent position. This can provide for great diversification beyond the already hybrid approach the fund takes investing across asset classes. This should mean some safety in terms of seeing significant underperformance relative to other real asset funds or a hypothetical blended benchmark. However, it also makes it harder to really drive any alpha relative to benchmarks either.
And touching on the blended benchmark blended it truly is:
JRI Blended Benchmark (through March 31, 2021):Consists of: 1) 28% S&P Global Infrastructure Index (Net), (definedherein), 2) 21% FTSE EPRA/Nareit Developed Index ((NET)) (defined herein), 3) 18% Wells Fargo Hybrid & Preferred Securities REITIndex (defined herein, index was discontinued on April 1, 2021), 4) 18% Bloomberg U.S. Corporate High Yield Bond Index (definedherein), and 5) 15% Bloomberg Global Capital Securities Index (defined herein). Index returns assume reinvestment of distributions, but do not reflect any applicable sales charges or management fees.
JRI Blended Benchmark (effective April 1, 2021): Consists of the previous composition (see above) through March 31,2021, and thereafter: 1) 25% FTSE EPRA/Nareit Developed Index ((NET)) (defined herein), 2) 22% S&P Global Infrastructure Index(Net) (defined herein), 3) 20% ICE Hybrid & Preferred Infrastructure 7% Issuer Constrained Custom Index (defined herein), 4) 20%Bloomberg U.S. Corporate High Yield Bond Index (defined herein), and 5) 13% FTSE Nareit Preferred Stock Index (defined herein).Index returns assume reinvestment of distributions, but do not reflect any applicable sales charges or management fees.
Fortunately, they provide the blended benchmark returns for us, and we don't have to attempt to break it out ourselves. Historically speaking, over the 10-year period, JRI has been able to compete against its blended benchmarks. Shorter periods show that it has been struggling but that also its blended benchmark hasn't really been setting the world on fire either.
Conclusion
JRI provides exposure to "real assets" through a hybrid allocation approach. That sees the fund investing with significant flexibility to put capital to work throughout the capital structure and around the globe. The fund primarily emphasizes infrastructure such as utilities and pipelines as well as carrying REIT exposure. The fund's historical performance hasn't been impressive, but similar to the Fed's soft landing scenario, there is a path where JRI can do well going forward. The fund's discount is attractive on an absolute and relative basis, which could further prove to be a catalyst in the future.
For further details see:
JRI: Distribution Bump And Diversified 'Real Asset' Exposure