JVAL - JVAL: A Healthy Mix Of Inexpensiveness And Profitability Worth Shortlisting
2024-01-04 04:01:24 ET
Summary
- JVAL is a passively managed fund with a focus on inexpensive players, mostly selected from the Russell 1000 index.
- Its past performance was mixed as it beat IWD, yet it was unable to keep pace with the market and a few peers.
- It is worth shortlisting JVAL since for a basket with a tilt toward mega-caps, JVAL has a meaningful earnings yield that comes with a mostly compelling quality story.
As we are moving into 2024, I would like to continue my series of articles discussing value-focused ETF strategies with a note on the JPMorgan U.S. Value Factor ETF ( JVAL ). In short, this is a solid ETF with a quality tilt, so it makes sense to shortlist it. However, there are nuances and disadvantages that weigh on my sentiment, so I believe a Hold rating would be a golden mean.
JVAL's investment strategy basics
Incepted in November 2017, JVAL has amassed a fairly solid AUM of over $809 million. It has more than healthy liquidity and an expense ratio of just 12 bps, one of the lowest in the Large Value sub-class .
Unlike another value-centered fund from JPMorgan, the JPMorgan Active Value ETF ( JAVA ), which I covered twice in the past, with the most recent article published in October 2023, JVAL is managed passively, with the JPMorgan US Value Factor Index being the basis of its strategy. It is rebalanced quarterly. As clarified in the summary prospectus :
Holdings in the Underlying Index are selected primarily from the constituents of the Russell 1000 Index, a larger Russell Index, which is comprised of large- and mid-cap equity securities of companies located in the United States.
Regarding metrics considered, it is said that the index
Targets equity securities with attractive prices relative to their sector peers based on fundamental characteristics of book yield, earnings yield, dividend yield and cash flow yield.
JVAL offers a generally compelling value & quality story
As of December 29, JVAL had 350 common stocks and REITs in its portfolio, with the bulk of the net assets allocated to the GICS information technology sector (26.3%). Overall, as JVAL's underlying index is supposed to mirror the sector weights of the Russell 1000 index (which is at times called a 'sector neutrality' principle), its sector mix unsurprisingly meaningfully differs from the one of the iShares Russell 1000 Value ETF ( IWD ) as shown below.
Created by the author using data from the funds; data as of January 2
For instance, its portfolio is meaningfully lighter in financials and energy, two sectors that value portfolios typically have outsized exposure.
Nevertheless, despite the IT-heavy mix with the weighted-average market capitalization of almost $242 billion, which welcomes the hypothesis that an earnings yield and other value characteristics might disappoint investors who are on the lookout for inexpensive equity baskets, the value story inside this portfolio is mostly compelling. Let me corroborate with the data below.
| Metric |
| Holdings as of December 29 |
| Market Cap |
| $241.7 billion |
| EY |
| 5.98% |
| P/S |
| 3.5 |
| Quant Valuation grade B- or higher |
| 35.7% |
| Quant Valuation grade D+ or lower |
| 38.3% |
Calculated by the author using data from Seeking Alpha and the fund
In defense of a value thesis, we see that the earnings yield of JVAL is significantly higher than the EY of IWB, which is offering approximately 4.3%. It is worth noting that JVAL's EY is principally supported by the GICS financial and consumer discretionary sectors, as they have the largest number of companies with an EY of at least 10%. More specifically, 35 such firms from the former and 17 from the latter can be identified upon closer inspection. If we delve a bit deeper, we will notice that when it comes to the ICB sectors, the most notable contributors to the portfolio-wise EY include banks (20 stocks) and oil, gas, and coal players (9 stocks). Besides, we see a significant share of stocks with a Seeking Alpha Quant Valuation grade of B- or higher.
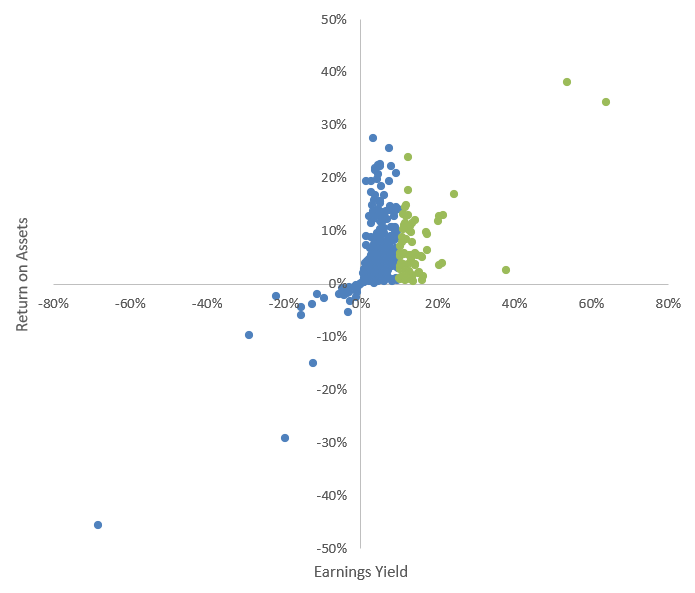
Next, for a better context, I have prepared the following scatter plot to illustrate the fund's exposure to companies with an EY of over 10% (highlighted in green).
Created by the author using data from Seeking Alpha and the fund; financial data as of January 2
Turning to quality, the chart also shows that just a few companies have the Return on Assets below zero, while there is a substantial presence of those with that metric at 10% or higher. Overall, the weighted average figure stands at 8%, which is a healthy level, though I would still prefer it above 10% like in the case of one of the strongest value ETFs in the cohort I cover, the Distillate U.S. Fundamental Stability & Value ETF ( DSTL ).
| Metric |
| 29-Dec |
| ROE |
| 61.07% |
| ROA |
| 8.04% |
| Quant Profitability grade B- or higher |
| 88.9% |
| Quant Profitability grade D+ or lower |
| 1.49% |
Calculated by the author using data from Seeking Alpha and the fund
As for the weighted average Return on Equity, I would not put much trust in that metric here as it is heavily distorted by the contributions from the following stocks that have four-digit Debt/Equity and thus a completely unreliable ROE.
| Stock |
| Weight |
| Sector |
| ROE |
| Debt/Equity |
| Oracle ( ORCL ) |
| 0.83% |
| Information Technology |
| 3367.8% |
| 2028.1% |
| Home Depot ( HD ) |
| 0.86% |
| Consumer Discretionary |
| 1151.3% |
| 3444.4% |
Data from Seeking Alpha and the fund
With their impact removed, the weighted average ROE would drop to just 23%. A more reliable figure here is the median ROE for the portfolio, which stands at 15%; this is an acceptable level.
Ultimately, I believe the best quality indicator here is the share of stocks with a B- Quant Profitability grade or higher. On that front, JVAL offers a lot, with the share at almost 89%. Still, it lags DSTL a bit, as the latter had over 97% of its net assets allocated to companies with an at least B- rating as of December 22.
Insufficient growth exposure might be a drag into 2024
The market has seen a solid run in the final months of 2023, as bulls have been betting heavily on the Fed starting to cut interest rates in 2024, with lower inflation expectations also contributing. In this environment, it is worth considering portfolios that have growth characteristics more pronounced than JVAL's. The fund has less than 31% of its net assets allocated to companies with a B- Quant Growth grade or higher, while close to 46% have a D+ grade or worse. So its fairly subdued weighted-average growth rates are hardly coincidental.
| Metric |
| 29-Dec |
| EPS Fwd |
| 4.16% |
| Revenue Fwd |
| 4.79% |
Calculated by the author using data from Seeking Alpha and the fund
Performance: beating IWD with ease, lagging IVV and a few peers
Over the December 2017-December 2023 period, JVAL easily beat IWD, delivering an about 2.6% stronger annualized total return, though with a higher standard deviation of 20%. Its risk-adjusted returns (Sharpe and Sortino ratios) were also stronger than IWD's.
| Portfolio |
| JVAL |
| IVV |
| IWD |
| IWB |
| Initial Balance |
| $10,000 |
| $10,000 |
| $10,000 |
| $10,000 |
| Final Balance |
| $17,905 |
| $20,001 |
| $15,473 |
| $19,668 |
| CAGR |
| 10.05% |
| 12.07% |
| 7.44% |
| 11.76% |
| Stdev |
| 20.03% |
| 17.91% |
| 18.10% |
| 18.21% |
| Best Year |
| 31.30% |
| 31.25% |
| 26.13% |
| 31.06% |
| Worst Year |
| -11.59% |
| -18.16% |
| -8.42% |
| -19.19% |
| Max. Drawdown |
| -29.33% |
| -23.93% |
| -26.73% |
| -24.57% |
| Sharpe Ratio |
| 0.49 |
| 0.62 |
| 0.38 |
| 0.6 |
| Sortino Ratio |
| 0.73 |
| 0.95 |
| 0.56 |
| 0.91 |
| Market Correlation |
| 0.95 |
| 1 |
| 0.95 |
| 1 |
Data from Portfolio Visualizer
Unfortunately, it was unable to outmaneuver either IVV or IWB. Its max drawdown also turned out to be the deepest in this group.
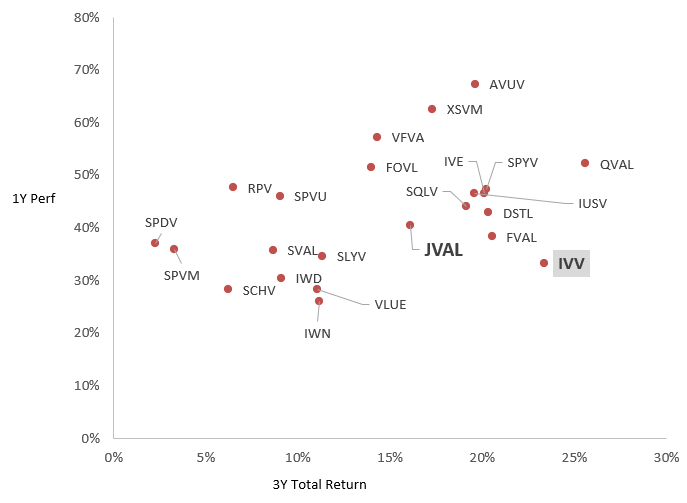
Next, I have prepared the scatter plot with the one-year performance and 3-year total returns of a few value-focused funds I cover, including the following:
| ETF |
| Avantis U.S. Small Cap Value Fund ( AVUV ) |
| Distillate Fundamental Stability & Value ETF ( DSTL ) |
| iShares Focused Value Factor ETF ( FOVL ) |
| Fidelity Value Factor ETF ( FVAL ) |
| iShares Core S&P U.S. Value ETF ( IUSV ) |
| iShares S&P 500 Value ETF ( IVE ) |
| iShares Russell 1000 Value ETF ( IWD ) |
| iShares Russell 2000 Value ETF ( IWN ) |
| Alpha Architect U.S. Quantitative Value ETF ( QVAL ) |
| Invesco S&P 500 Pure Value ETF ( RPV ) |
| Schwab U.S. Large-Cap Value ETF ( SCHV ) |
| SPDR S&P 600 Small Cap Value ETF ( SLYV ) |
| AAM S&P 500 High Dividend Value ETF ( SPDV ) |
| Invesco S&P 500 Value with Momentum ETF ( SPVM ) |
| Invesco S&P 500 Enhanced Value ETF ( SPVU ) |
| SPDR Portfolio S&P 500 Value ETF ( SPYV ) |
| Royce Quant Small-Cap Quality Value ETF ( SQLV ) |
| iShares US Small Cap Value Factor ETF ( SVAL ) |
| Vanguard U.S. Value Factor ETF ( VFVA ) |
| iShares MSCI USA Value Factor ETF ( VLUE ) |
| Invesco S&P SmallCap Value with Momentum ETF ( XSVM ) |
IVV was added for better context.
Created using data from Seeking Alpha. Returns as of January 3
As can be seen, JVAL is not the best one, but it still outperformed such vehicles as IWN, SCHV, and VLUE. Next, the median one-year price return in the group is 14.2%, which JVAL has beaten easily, delivering 16.1%; however, its 3-year total return was bleaker as it lagged the median by around 2.5%.
Investor takeaway
In sum, I have no strong bull case for JVAL, though I believe it is worth shortlisting this fund since for a basket with a tilt toward mega-caps, JVAL has a meaningful earnings yield and a rather modest weighted-average Price/Sales that come with a mostly compelling quality story.
For further details see:
JVAL: A Healthy Mix Of Inexpensiveness And Profitability, Worth Shortlisting