XLF - KBWD: This 11% Yield Is Not Worth The Risk
2023-07-12 13:45:50 ET
Summary
- This fund's total expense ratio is very high.
- A large part of the portfolio is in leveraged debt.
- The share price has lost 35% since inception and is very volatile.
- Distributions are down by about 20% in 10 years.
- Bonus: How to manage capital decay in high-yield securities.
This article series aims at evaluating ETFs (exchange-traded funds) regarding past performance and portfolio metrics. Reviews with updated data are posted when necessary.
Since my last article on KBWD, its total return is -1.7%, while the S&P 500 is up 7.6%. This post renews my sell rating.
KBWD strategy and portfolio
Invesco KBW High Dividend Yield Financial ETF (KBWD) started investing operations on 12/02/2010 and tracks the KBW Nasdaq Financial Sector Dividend Yield Index. It has 40 holdings and a 12-month distribution yield of 11.18%. Management fees are 0.35%, but the total expense ratio, including holding expenses, is 3.84%, one of the most expensive among ETFs. Distributions are paid monthly.
As described in the prospectus by Invesco , the underlying index “ is a modified-dividend yield-weighted index of companies principally engaged in the business of providing financial services and products (…) which may include business development companies and real estate investment trusts ”.
The fund invests exclusively in U.S.-based companies, mostly in small and micro caps (about 95% of asset value). The heaviest industries in the portfolio are mortgage REITs and capital markets, with over 40% of assets in each category. The latter includes a number of BDCs (business development companies). It means a very large part of the portfolio (mortgage REITs and BDCs) is in leveraged debt. The next table lists the top ten holdings with their weights and dividend yields. The portfolio is quite concentrated: their aggregate weight is about 38% in 7 mortgage REITs and 3 BDCs. However, risks related to individual companies are moderate: the maximum exposure to a single constituent is 5%.
| Ticker |
| Name |
| % of Assets |
| Category |
| IAD Yield % |
| Chimera Investment Corporation |
| 4.62 |
| mortgage REIT |
| 12.74 |
| Two Harbors Investment Corp. |
| 4.21 |
| mortgage REIT |
| 13.78 |
| ARMOUR Residential REIT, Inc. |
| 4.12 |
| mortgage REIT |
| 18.79 |
| Orchid Island Capital, Inc. |
| 4.09 |
| mortgage REIT |
| 19.14 |
| TPG RE Finance Trust, Inc. |
| 3.6 |
| mortgage REIT |
| 13.21 |
| Trinity Capital Inc. |
| 3.57 |
| BDC |
| 13.54 |
| AGNC Investment Corp. |
| 3.56 |
| mortgage REIT |
| 14.47 |
| CION Investment Corporation |
| 3.41 |
| BDC |
| 15.29 |
| PennyMac Mortgage Investment Trust |
| 3.38 |
| mortgage REIT |
| 11.54 |
| TriplePoint Venture Growth BDC Corp. |
| 3.31 |
| BDC |
| 12.90 |
Performance
Since 1/1/2011, KBWD has lagged the sector benchmark Financial Select Sector SPDR Fund ( XLF ) by 4.2 percentage points in annualized return. Moreover, it shows a higher risk in maximum drawdown and volatility (standard deviation of monthly returns).
| Total Return |
| Annual.Return |
| Drawdown |
| Sharpe ratio |
| Volatility |
| KBWD |
| 100.15% |
| 5.70% |
| -58.63% |
| 0.34 |
| 22.22% |
| XLF |
| 226.60% |
| 9.91% |
| -42.86% |
| 0.54 |
| 19.21% |
Data calculated with Portfolio123
In the last 5 years, the fund has underperformed both XLF and a high-yield equity benchmark: the SPDR Portfolio S&P 500 High Dividend ETF ( SPYD ).
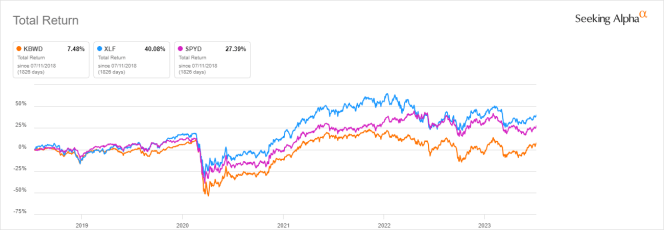
The share price history, plotted below, shows that KBWD has suffered a total capital decay of 35% since inception. To make it worse, the cumulative inflation has been 39% in the same time, based on CPI.
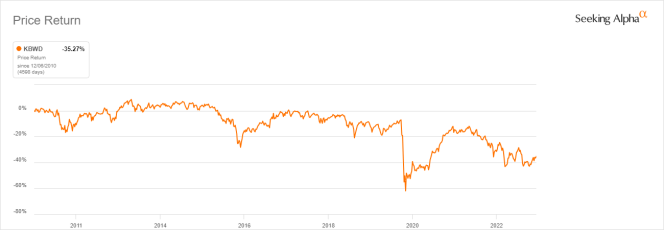
The annual sum of monthly distributions went down from $2.09 in 2012 to $1.68 in 2022. It represents an income loss of 20% in 10 years for shareholders.
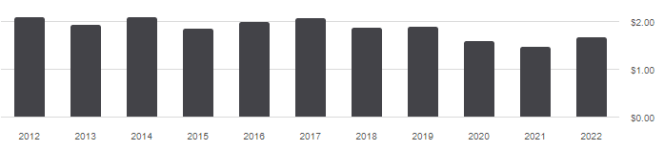
Capital and distribution decay is not specific to KBWD: securities with yields above 6% suffer from decay on average (there are rare exceptions).
My dividend ETF reviews usually report aggregate value and quality metrics. It is possible to calculate them for KBWD, but it makes little sense. Usual ratios are unreliable in the financial sector, especially for mortgage REITs and BDCs.
Takeaway
Invesco KBW High Dividend Yield Financial ETF holds 40 stocks of high-yield financial companies, mostly mREITs and BDCs. Distributions and aggregate valuation ratios look attractive, but expense ratio, historical volatility, capital decay, and distribution decay are strong warning signals.
Bonus: How to manage capital decay in high-yield securities
Capital and income decay is an issue in many closed-end funds, like in high-yield ETFs. However, it may be avoided or mitigated by rotational strategies. I designed a 5-factor ranking system in 2016, and monitored its performance during several years. I started publishing the eight best ranked CEFs in Quantitative Risk & Value (QRV) after the March 2020 meltdown. The list is updated every week. It isn’t a model portfolio: trading the list every week is too costly in spreads and slippage. Its purpose is helping investors find funds with a good entry point. In the table below, I give the hypothetical example of starting a portfolio on 3/25/2020 with my initial “Best 8 Ranked CEFs” list and updating it every 3 months, ignoring intermediate updates. Return is calculated with holdings in equal weight and reinvesting dividends at the beginning of every 3-month period.
| Since 3/25/2020 |
| Total Return |
| Annual.Return |
| Drawdown |
| Sharpe ratio |
| Volatility |
| Best 8 CEFs quarterly |
| 128.65% |
| 28.52% |
| -20.60% |
| 1.22 |
| 19.99% |
| KBWD |
| 100.32% |
| 23.46% |
| -30.74% |
| 0.86 |
| 27.12% |
This simulation is not a real portfolio and not a guarantee of future return
Of course, past performance (real or simulated) is not representative of future return. However, I think a time-tested rotational strategy in CEFs has a much better chance to protect both capital and income stream against erosion and inflation than a high-yield ETF.
For further details see:
KBWD: This 11% Yield Is Not Worth The Risk