SDY - KNGZ: Is First Trust's New Dividend Aristocrats ETF Better Than NOBL?
2023-12-16 03:07:14 ET
Summary
- KNGZ recently reorganized to become a Defensive Dividend Aristocrat ETF. The ETF mains to mirror the sector exposures of the S&P 500 Index, and is expected to yield 3.00%.
- This article evaluates whether this new strategy is good enough to take on NOBL, the leading Dividend Aristocrat ETF with nearly $12 billion in assets under management.
- Though NOBL has its fair share of faults, they're minor compared to KNGZ. KNGZ has weaker dividend consistency and safety scores, no EPS growth, and a high 0.50% expense ratio.
- I expect NOBL to carry on, continuing to attract conservative investors with long time horizons and modest income needs. On the other hand, KNGZ is not competitive, and I can't see the ETF surviving for long.
Investment Thesis
The First Trust S&P 500 Diversified Dividend Aristocrats ETF (KNGZ) changed investment strategies on October 3, 2023, and now focuses on large-cap stocks with at least 15 consecutive years of stable or increasing dividend payments. However, this screen is a target, not a rule, and KNGZ's relaxed methodology in pursuit of yield and diversification will not work. In this article, I will contrast KNGZ with the ProShares S&P 500 Dividend Aristocrats ETF (NOBL) and two other dividend ETFs worth consideration. I ask readers to refrain from being swayed by First Trust's reboot of the US Equity Dividend Select ETF, and I look forward to explaining why in further detail below.
Overview
KNGZ vs. NOBL: Strategy Comparison
KNGZ tracks the S&P 500 Sector-Neutral Dividend Aristocrats Index, selecting 100 securities that meet the following criteria:
1. Securities with stable or increasing annual dividend per share payments for at least 15 consecutive years are eligible.
2. Securities are ranked by sector by indicated dividend yield. In cases where not enough securities qualify per sector, rule #1 is relaxed to 5 years.
3. For each sector, securities are added until the number of securities is equal to 20% of the number of securities comprising the sector in the S&P 500.
4. The Index is yield-weighted, rebalances quarterly, and reconstitutes annually. Weights are constrained between 0.25% and 4.00%, and the Index's sector allocation targets mirror the S&P 500.
The selection process is complex compared to NOBL's, which equal-weights S&P 500 securities with 25+ consecutive years of increasing dividends. Obviously, NOBL is more exclusive, but it's crucial investors understand the impact of the second point above. According to data provided by Seeking Alpha, 48 of KNGZ's holdings have less than 15 years of consecutive dividend increases, and although that doesn't count stable dividend-payers, these securities' combined 54.64% exposure means the 15-year old requirement is mostly for show. In addition, since 23.20% of the fund by weight has less than five consecutive years of dividend increases, KNGZ's claim of holding "Defensive Dividend Aristocrats" is questionable.
KNGZ vs. NOBL: Sector Exposures
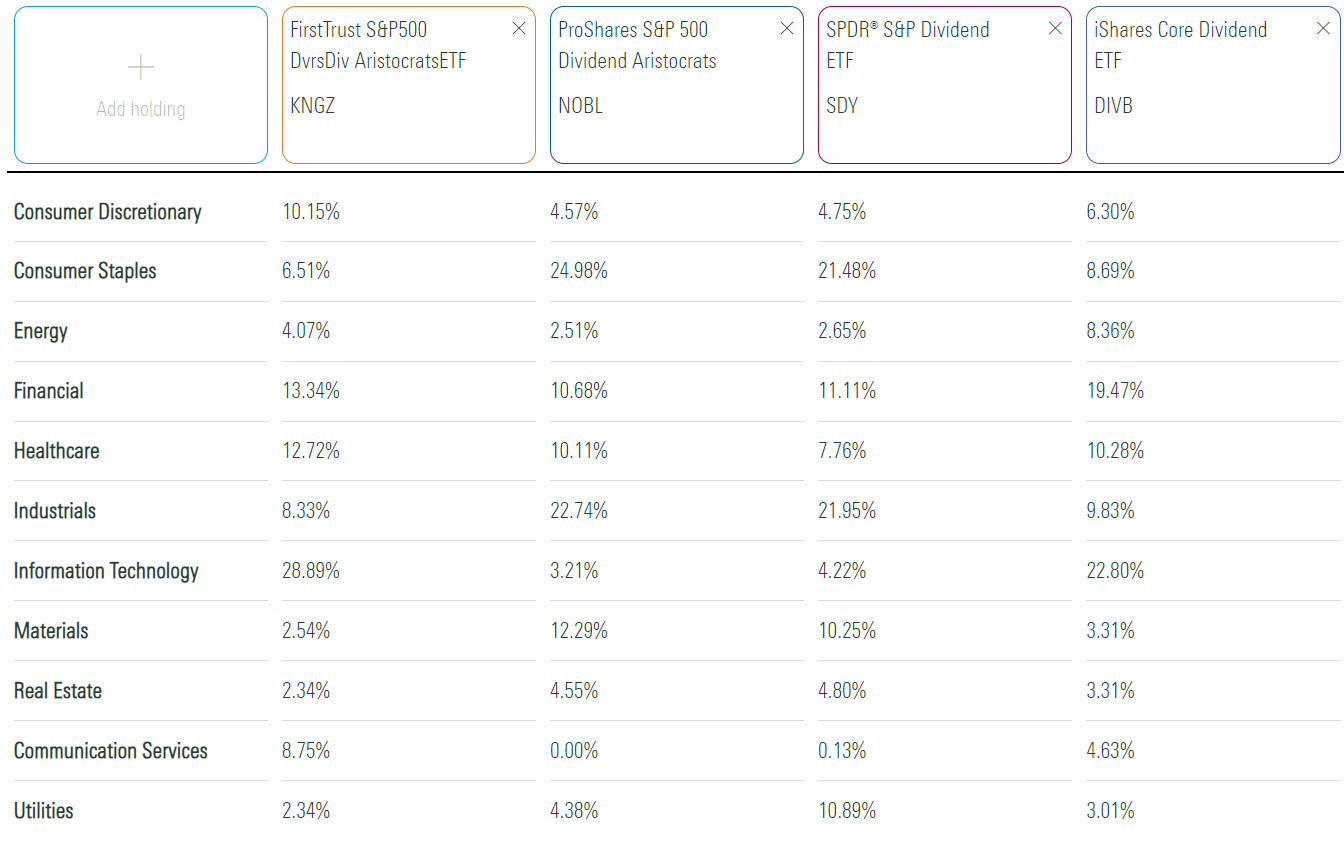
Sector exposures for KNGZ and NOBL are below. I've also listed the SPDR S&P Dividend ETF (SDY) and the iShares Core Dividend ETF (DIVB) as comparators. SDY is a large/mid-cap Dividend Aristocrats ETF requiring 20 consecutive years of dividend increases, while DIVB is a low-cost, high-yielding dividend ETF with a relatively high exposure to Technology stocks (22.80%), similar to KNGZ.
Based on these sector exposures, I think NOBL and SDY fall in the same category, while KNGZ and DIVB offer more "market-like" exposure while featuring a higher dividend yield. However, if this is KNGZ's purpose, its 0.50% is a significant drag on shareholder's net distributions, while DIVB's 0.05% expense ratio is much more reasonable.
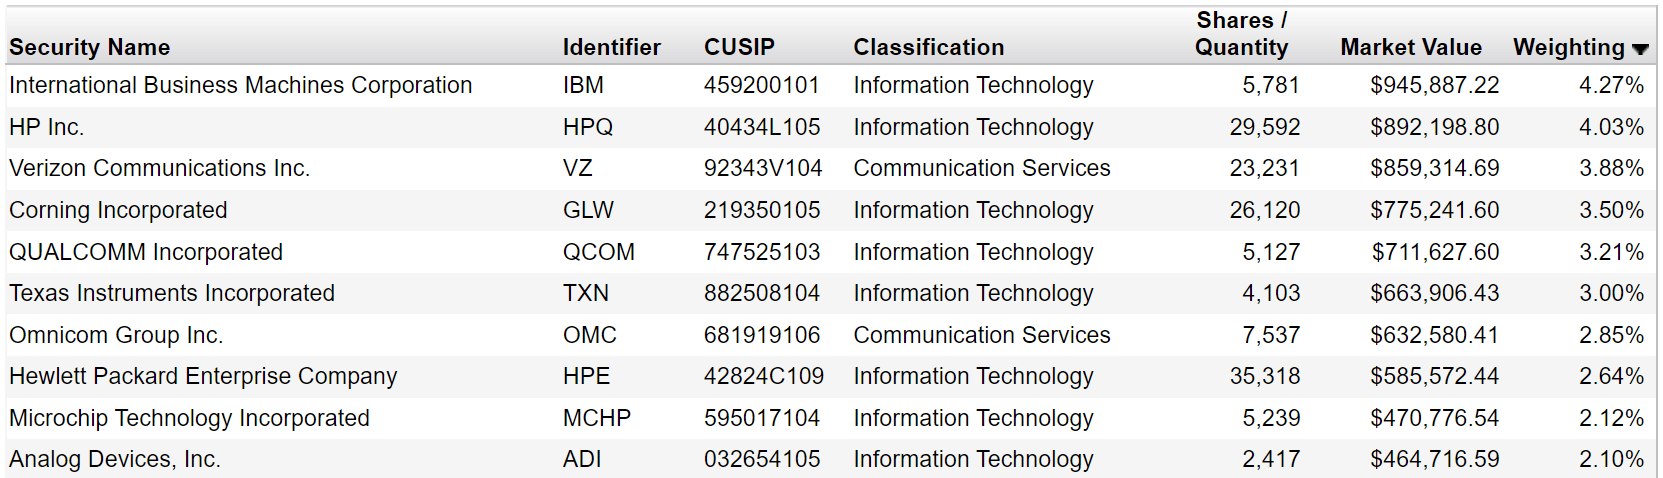
KNGZ vs. NOBL: Top Holdings
KNGZ's top ten holdings, totaling 31.60% of the portfolio, are listed below. Surprisingly, Technology stocks are prominent. Several cheap stocks are held, including International Business Machines ( IBM ) and HP ( HPQ ), which trade at 17.12x and 8.76x forward earnings and yield 4.97% and 3.18%, respectively. Verizon Communications ( VZ ) is the highest-yielding stock at 7.19%, behind Walgreens Boots Alliance ( WBA ), which yields 7.80% and is #32 on the holdings list.
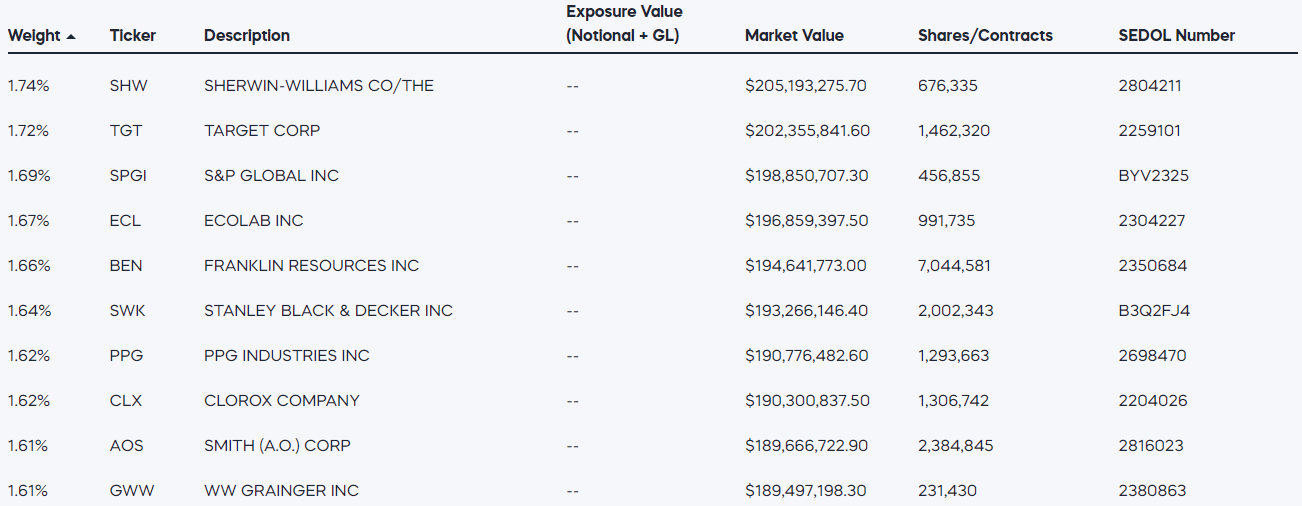
Due to its equal-weighting scheme, NOBL's top ten holdings list is less revealing. At any point, its top ten holdings merely represent the best performers since the last quarterly rebalancing. Today, that's Sherwin-Williams ( SHW ) and Target ( TGT ), but the two are having vastly different years. SHW is up 29.10%, but TGT has declined by 4.15%. In short, there are better ways to judge the fund than analyzing NOBL's top ten holdings. A more comprehensive analysis is required because of the weighting scheme.
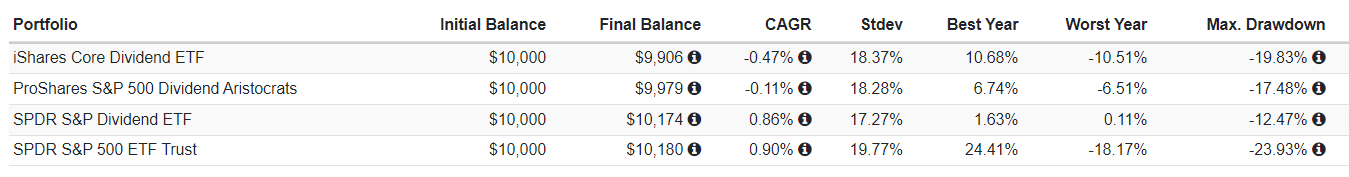
KNGZ vs. NOBL: Performance
KNGZ does not have any meaningful track record, and DIVB also changed strategies in December 2022 . Along with SDY, all three have nearly matched the returns of SPY since January 2022, featuring less of a drawdown last year but substantially underperforming in 2023. It's a short measurement period, but at least it's a positive one from a risk management perspective.
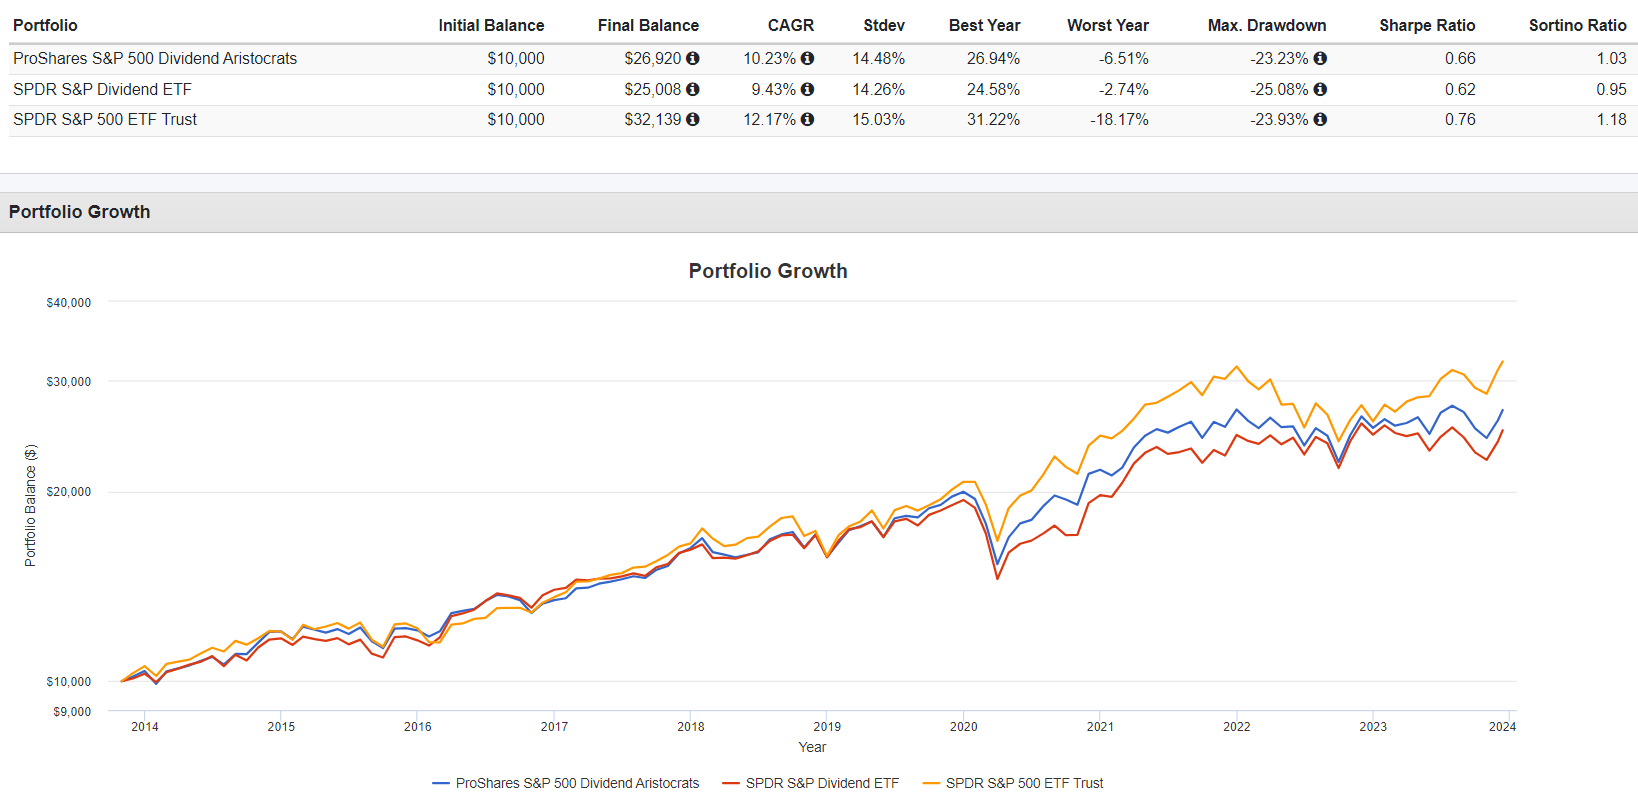
Since November 2013, NOBL has proved superior over SDY, featuring stronger annualized returns (10.23% vs. 9.43%) and risk-adjusted returns, as measured by the Sharpe and Sortino Ratios. However, both have lagged SPY in four of the last five years.
Fundamental Analysis
KNGZ Fundamentals By Sub-Industry
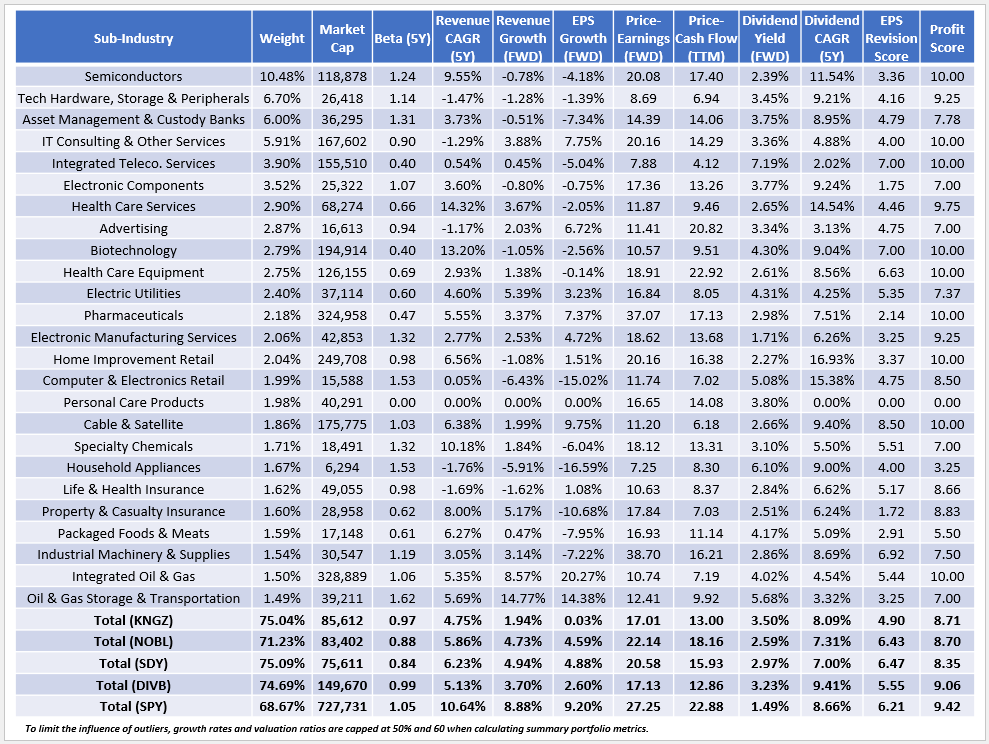
The following table highlights selected fundamental metrics for KNGZ's top 25 sub-industries, totaling 75.04% of the portfolio. There are some serious red flags to consider.
1. KNGZ doesn't seem very defensive despite the ETF's name. Its five-year beta is 0.97, indicating only marginally less volatility than the broader market. A backtest of the current portfolio to November 2015 suggests it was more volatile than SPY and offered weaker returns and risk-adjusted returns.
2. KNGZ has weak estimated growth: 1.94% for sales and 0.03% for earnings per share. Semiconductors, which is KNGZ's largest sub-industry at 10.48% of the fund, has a -4.48% estimated EPS growth rate, and with falling interest rates, negative earnings growth is also expected for most financial stocks. I've written this several times lately regarding many value-oriented funds, but without sufficient earnings growth, expecting any meaningful dividend growth is unreasonable. KNGZ's constituents have grown dividends by 8.09% over the last five years, but there's no reason to believe that will continue.
3. KNGZ's constituents yield 3.50%, but after deducting the 0.50% expense ratio, a 3.00% yield is expected. It's pretty good, but DIVB offers 3.23% (3.18% net), a more robust historical five-year dividend growth (9.41% vs. 8.09%), and better estimated sales and earnings growth. It's also a higher quality ETF, as indicated by a superior profit score (9.06/10 vs. 8.71/10), and trades at a similar valuation (17x forward earnings and 13x trailing cash flow).
NOBL Fundamentals By Sub-Industry
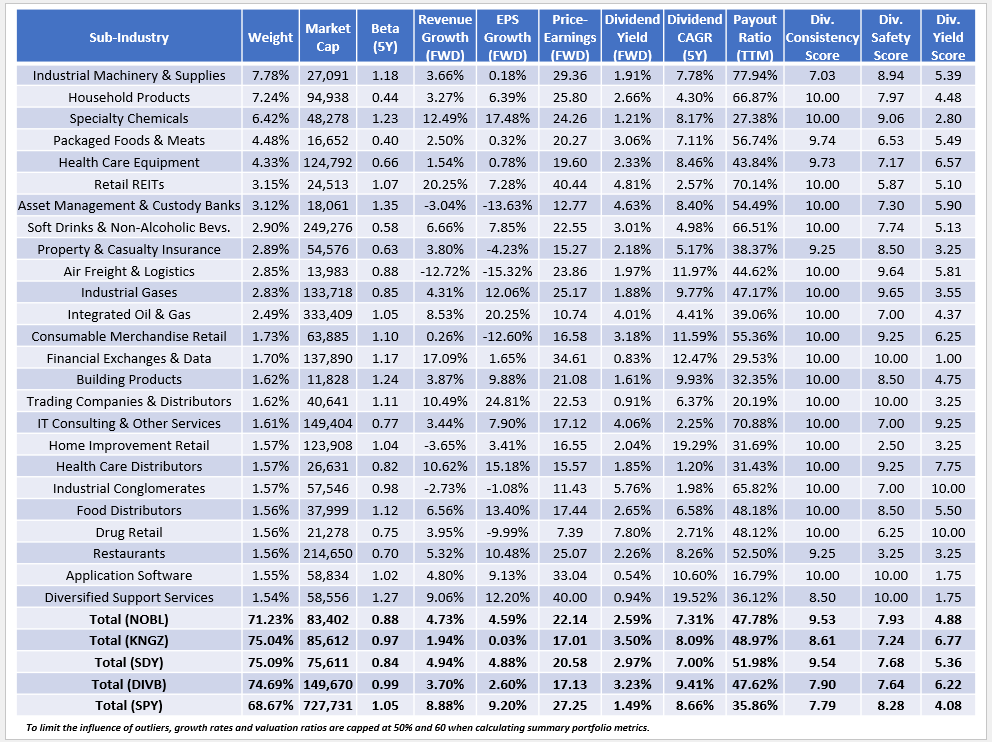
The table below highlights selected fundamentals for NOBL's top 25 sub-industries and includes additional dividend metrics.
1. The dividend consistency, safety, and yield scores were calculated using individual Seeking Alpha Factor Grades and revealed that NOBL and SDY are the most consistent. This finding is not surprising, given the Dividend Aristocrat strategy. Next is KNGZ, followed by DIVB and SPY. NOBL is also the safest of the four dividend ETFs, as measured by its 7.93/10 Dividend Safety Score, but its yield score is the weakest. NOBL's constituents have a 2.59% gross dividend yield, and after deducting its 0.35% expense ratio, the net yield is only 2.34%. Many dividend investors will find this starting yield too low.
2. NOBL trades at 22.14x forward earnings, and considering its 4.59% estimated EPS growth rate, it seems too expensive. Valuation is an area where ETFs like KNGZ and DIVB are far better choices. The Schwab U.S. Dividend Equity ETF ( SCHD ) may be a good compromise, offering 3% estimated EPS growth and trading at about 19x forward earnings.
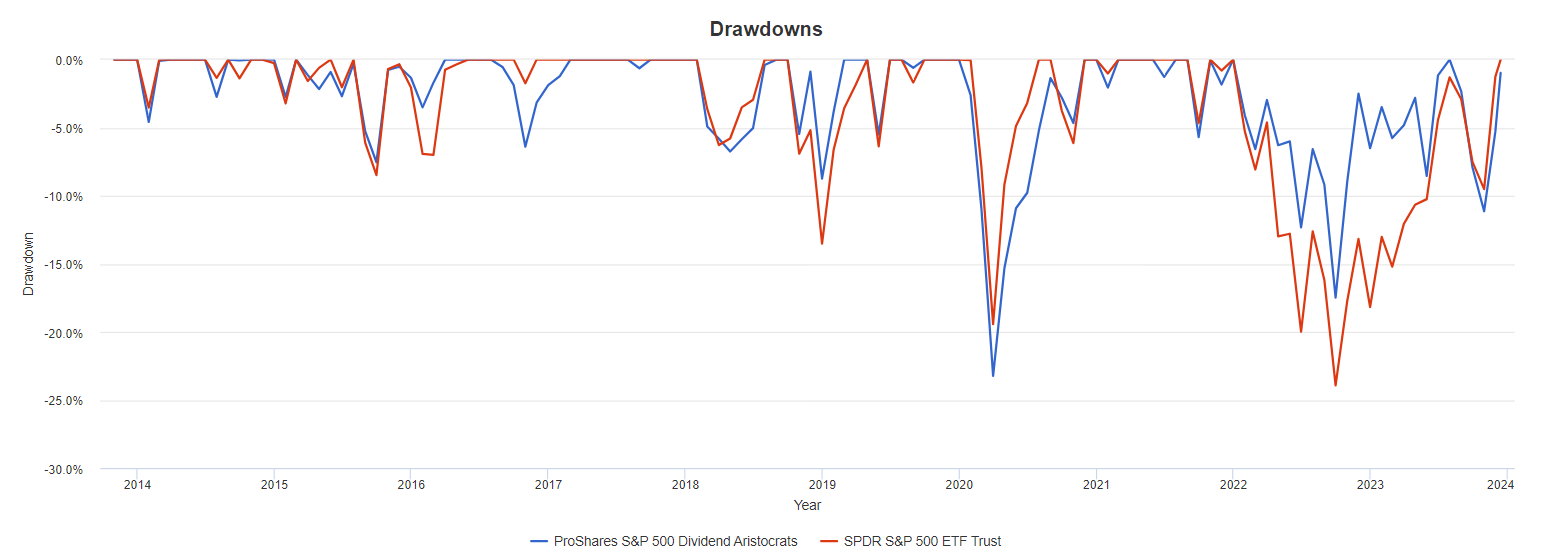
3. NOBL is better diversified at the sub-industry level than KNGZ, with 71.23% of assets in its top 25. Its five-year beta is also lower at 0.88 and has the track record to back it up (see earlier performance graph). NOBL also has a history of providing downside protection, as highlighted below.
The main exception was in Q1 2020 when Technology stocks were safe havens. However, I don't expect that to be the norm moving forward, and there is some value to diversifying away from that sector now. NOBL can efficiently reduce your Technology sector exposure, while KNGZ does not solve that problem.
Investment Recommendation
KNGZ calls itself a "Defensive Dividend Aristocrats" ETF, but my findings reveal a portfolio that is much weaker on dividend consistency compared to true Dividend Aristocrat ETFs like NOBL and SDY. The Index methodology states constituents should have a minimum of 15 years of stable or increasing dividend payments, but the rule is relaxed to allow nearly one-quarter of the portfolio to be allocated to companies with less than five years of increasing dividend payments. Its high 0.50% expense ratio, flat estimated earnings per share growth, and poor dividend safety score seal the deal for me. I don't recommend readers buy KNGZ and have assigned a "sell" rating.
NOBL also has its fair share of faults. Its 0.35% expense ratio drives its forward yield down to just 2.34%, and its 22.14x forward earnings ratio is hard to justify, given how many high-quality dividend and value alternatives trade below 20x. That said, it's a well-established fund with a clear investment strategy and no relaxation rules. As a result, its dividend safety and consistency scores are the best of the four dividend ETFs analyzed, and its higher sales and earnings growth rates suggest it has a better chance of maintaining solid dividend growth moving forward. Therefore, I've assigned a "hold" rating to NOBL. Thank you for reading, and I look forward to your comments below.
For further details see:
KNGZ: Is First Trust's New Dividend Aristocrats ETF Better Than NOBL?