AIVL - Linking Value Stocks To Yield Curve Inversions
2023-04-07 09:34:00 ET
Summary
- Over the 47-year period since 1975, value stocks with high ROE ratios outperformed the value universe of stocks for the one-year period after the curve first inverts by an average of 4.8%.
- When spreads are narrow and begin to widen, we are in the Broad Value regime. When spreads are extremely wide and begin to narrow, we start the Deep Value regime.
- We found that typically, after an inversion, the yield curve generally steepens and eventually un-inverts toward the end of Broad Value regimes while stocks with high ROE continue to outperform.
By Michael J. Fleisher
Previously, we discussed the market’s recent shift to a Broad Value regime in which value stocks that are profitable should soon outperform based on narrow valuation spreads that are poised to widen. Now, the U.S. Treasury yield curve, after inverting in November amid the Federal Reserve’s (Fed’s) aggressive rate hike cycle, is flashing recession signals. To better understand the current, increasingly complicated environment and its potential impact on value stocks, our latest research analyzes factor performance during and soon after yield curve inversions going back to 1975 and then combines the findings with our valuation spread analysis. Specifically, our hypothesis proposes that stocks with high profitability and fundamental quality should outperform during yield curve inversions. For this analysis, we use high return on equity (ROE) as a proxy for representing profitability and quality.
Profitability Matters During Yield Curve Inversions
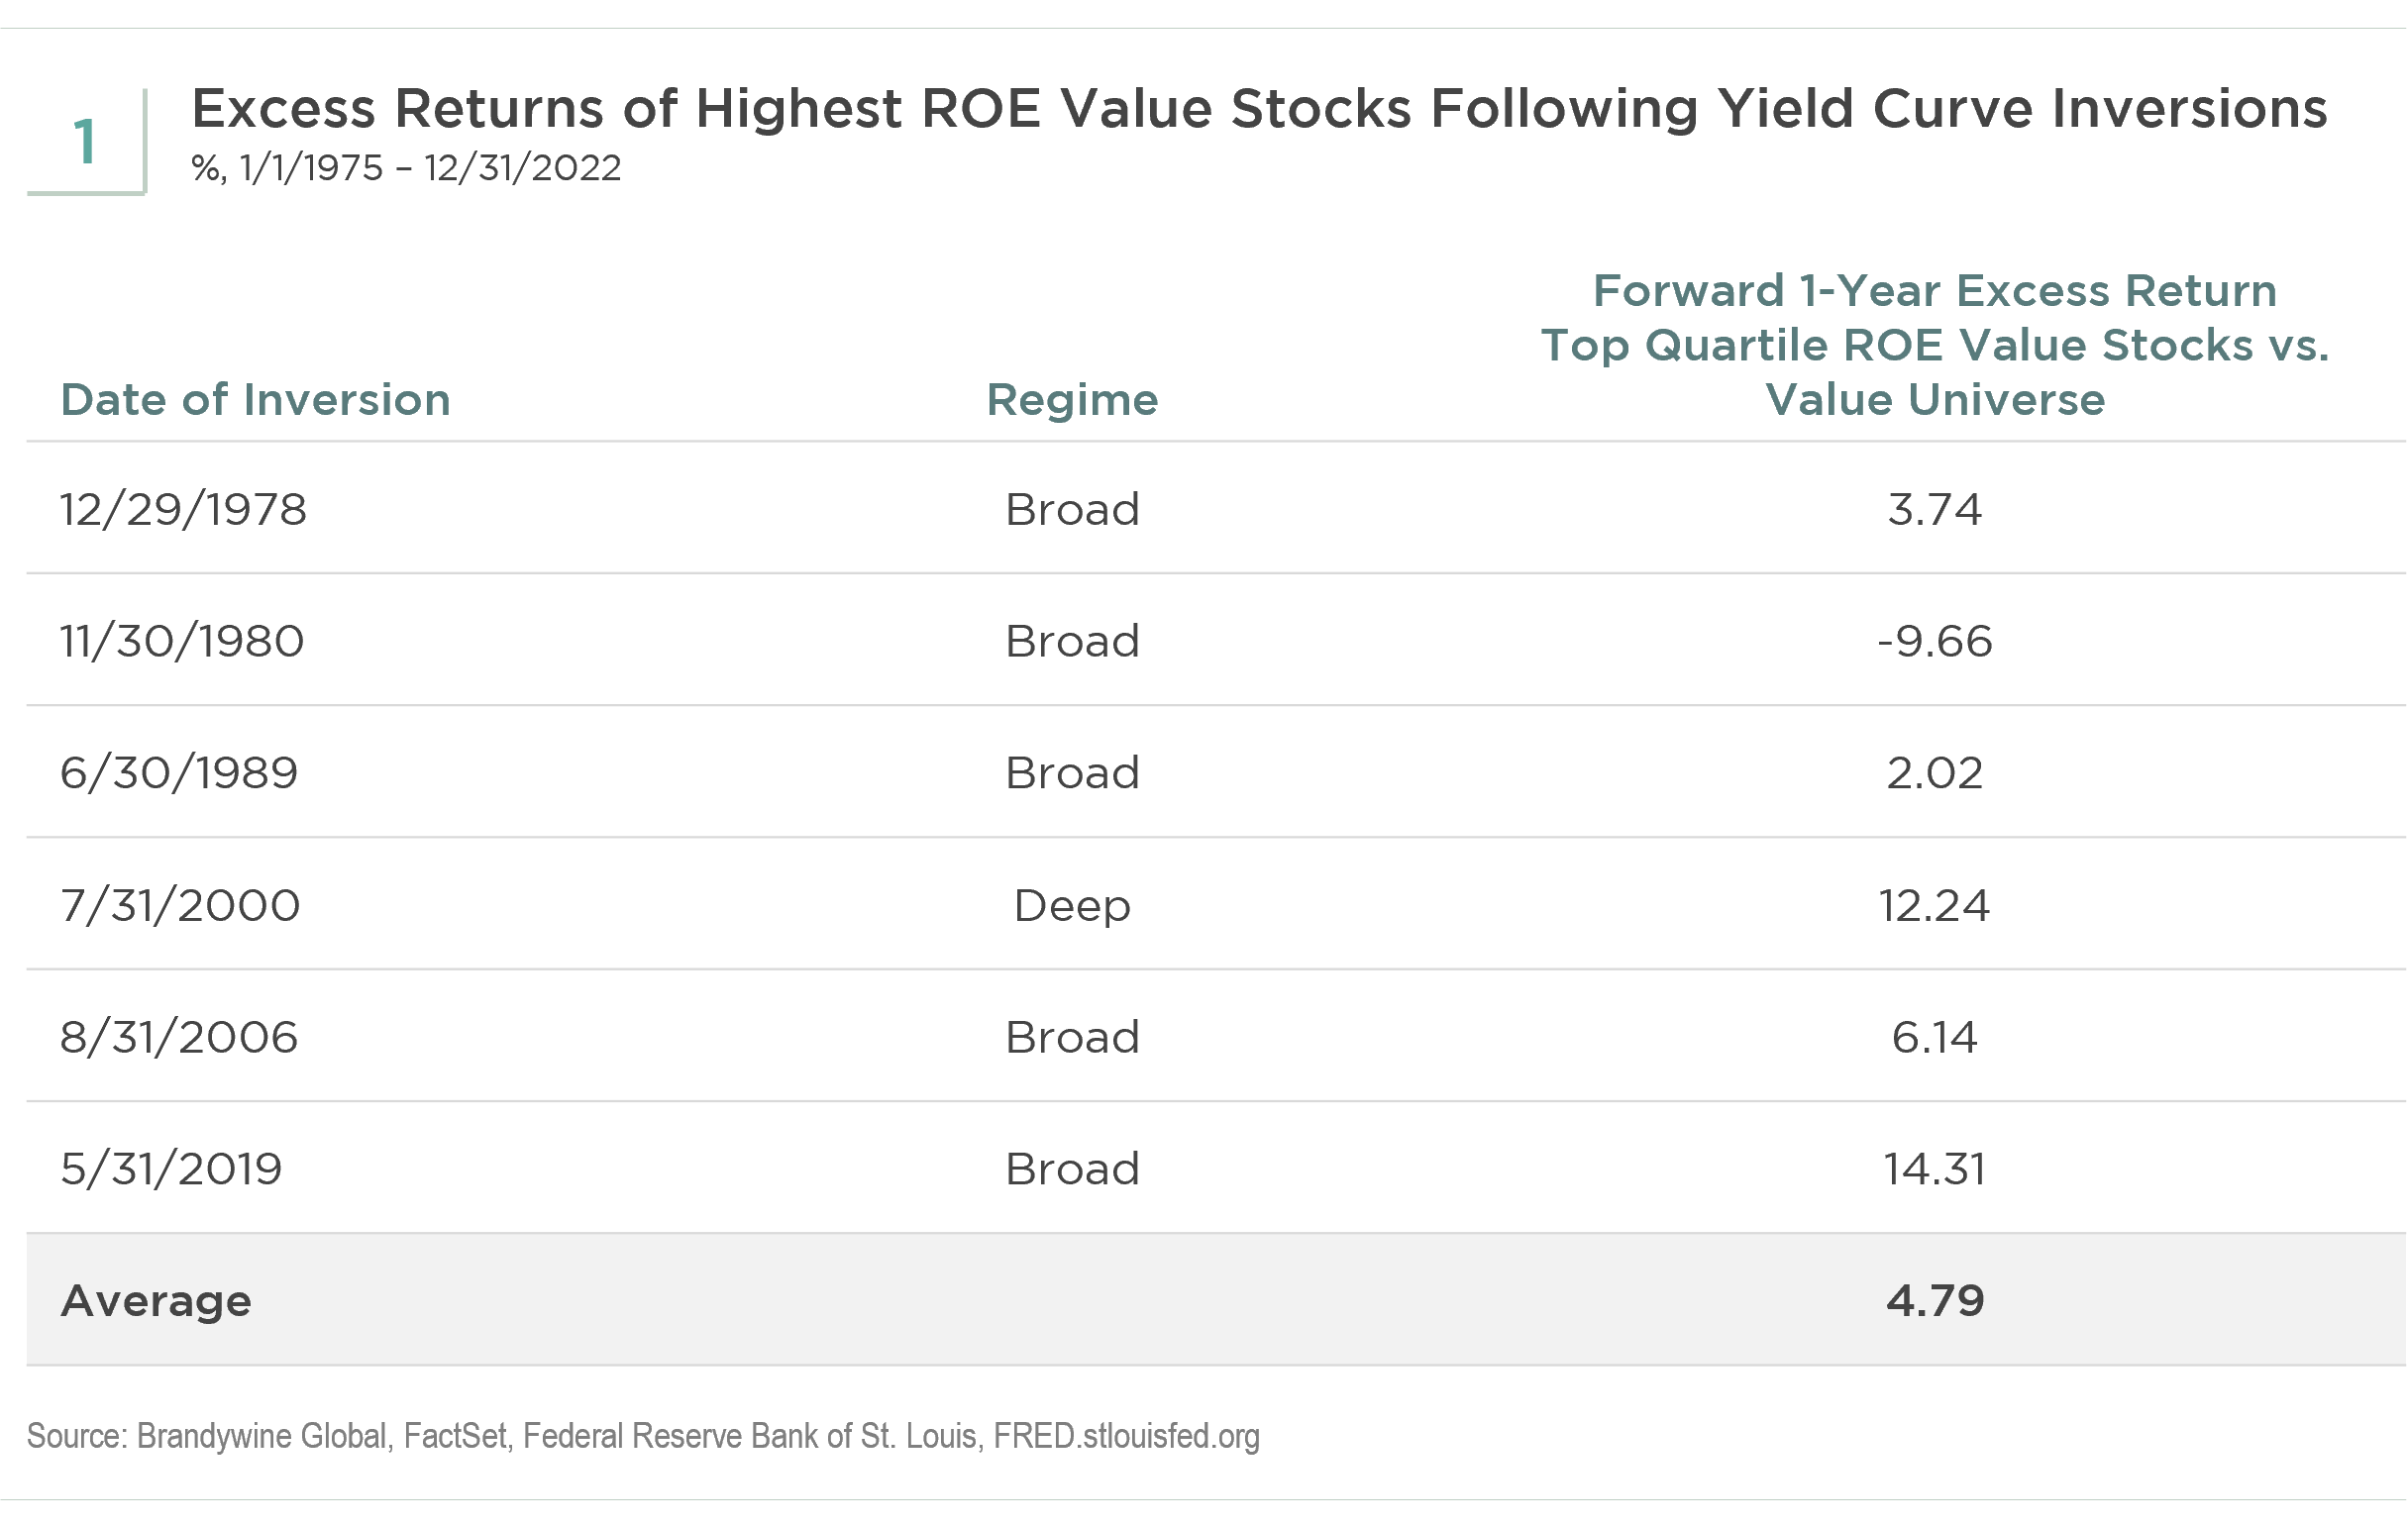
To start, we identified the top quartile of stocks based on ROE within our value universe. This universe is comprised of the cheapest 35%, based on either price-to-earnings or price-to-book ratios, of the 1,000 largest U.S. equities by market capitalization. Looking back to 1975, we then identified each instance of a Treasury yield curve inversion, using monthly averages of the 10-year Treasury constant maturity minus the 3-month Treasury constant maturity from St. Louis Federal Reserve FRED data as a proxy for long-term rates minus short-term rates. An inversion is defined as when the average on a month end becomes negative from a previous positive monthly average, and no inversion occurred in the previous 12 months. Beginning from the month end during which the curve first inverts, we calculated the forward one-year excess return for the highest ROE stocks and compared it to the value universe (see Figure 1).
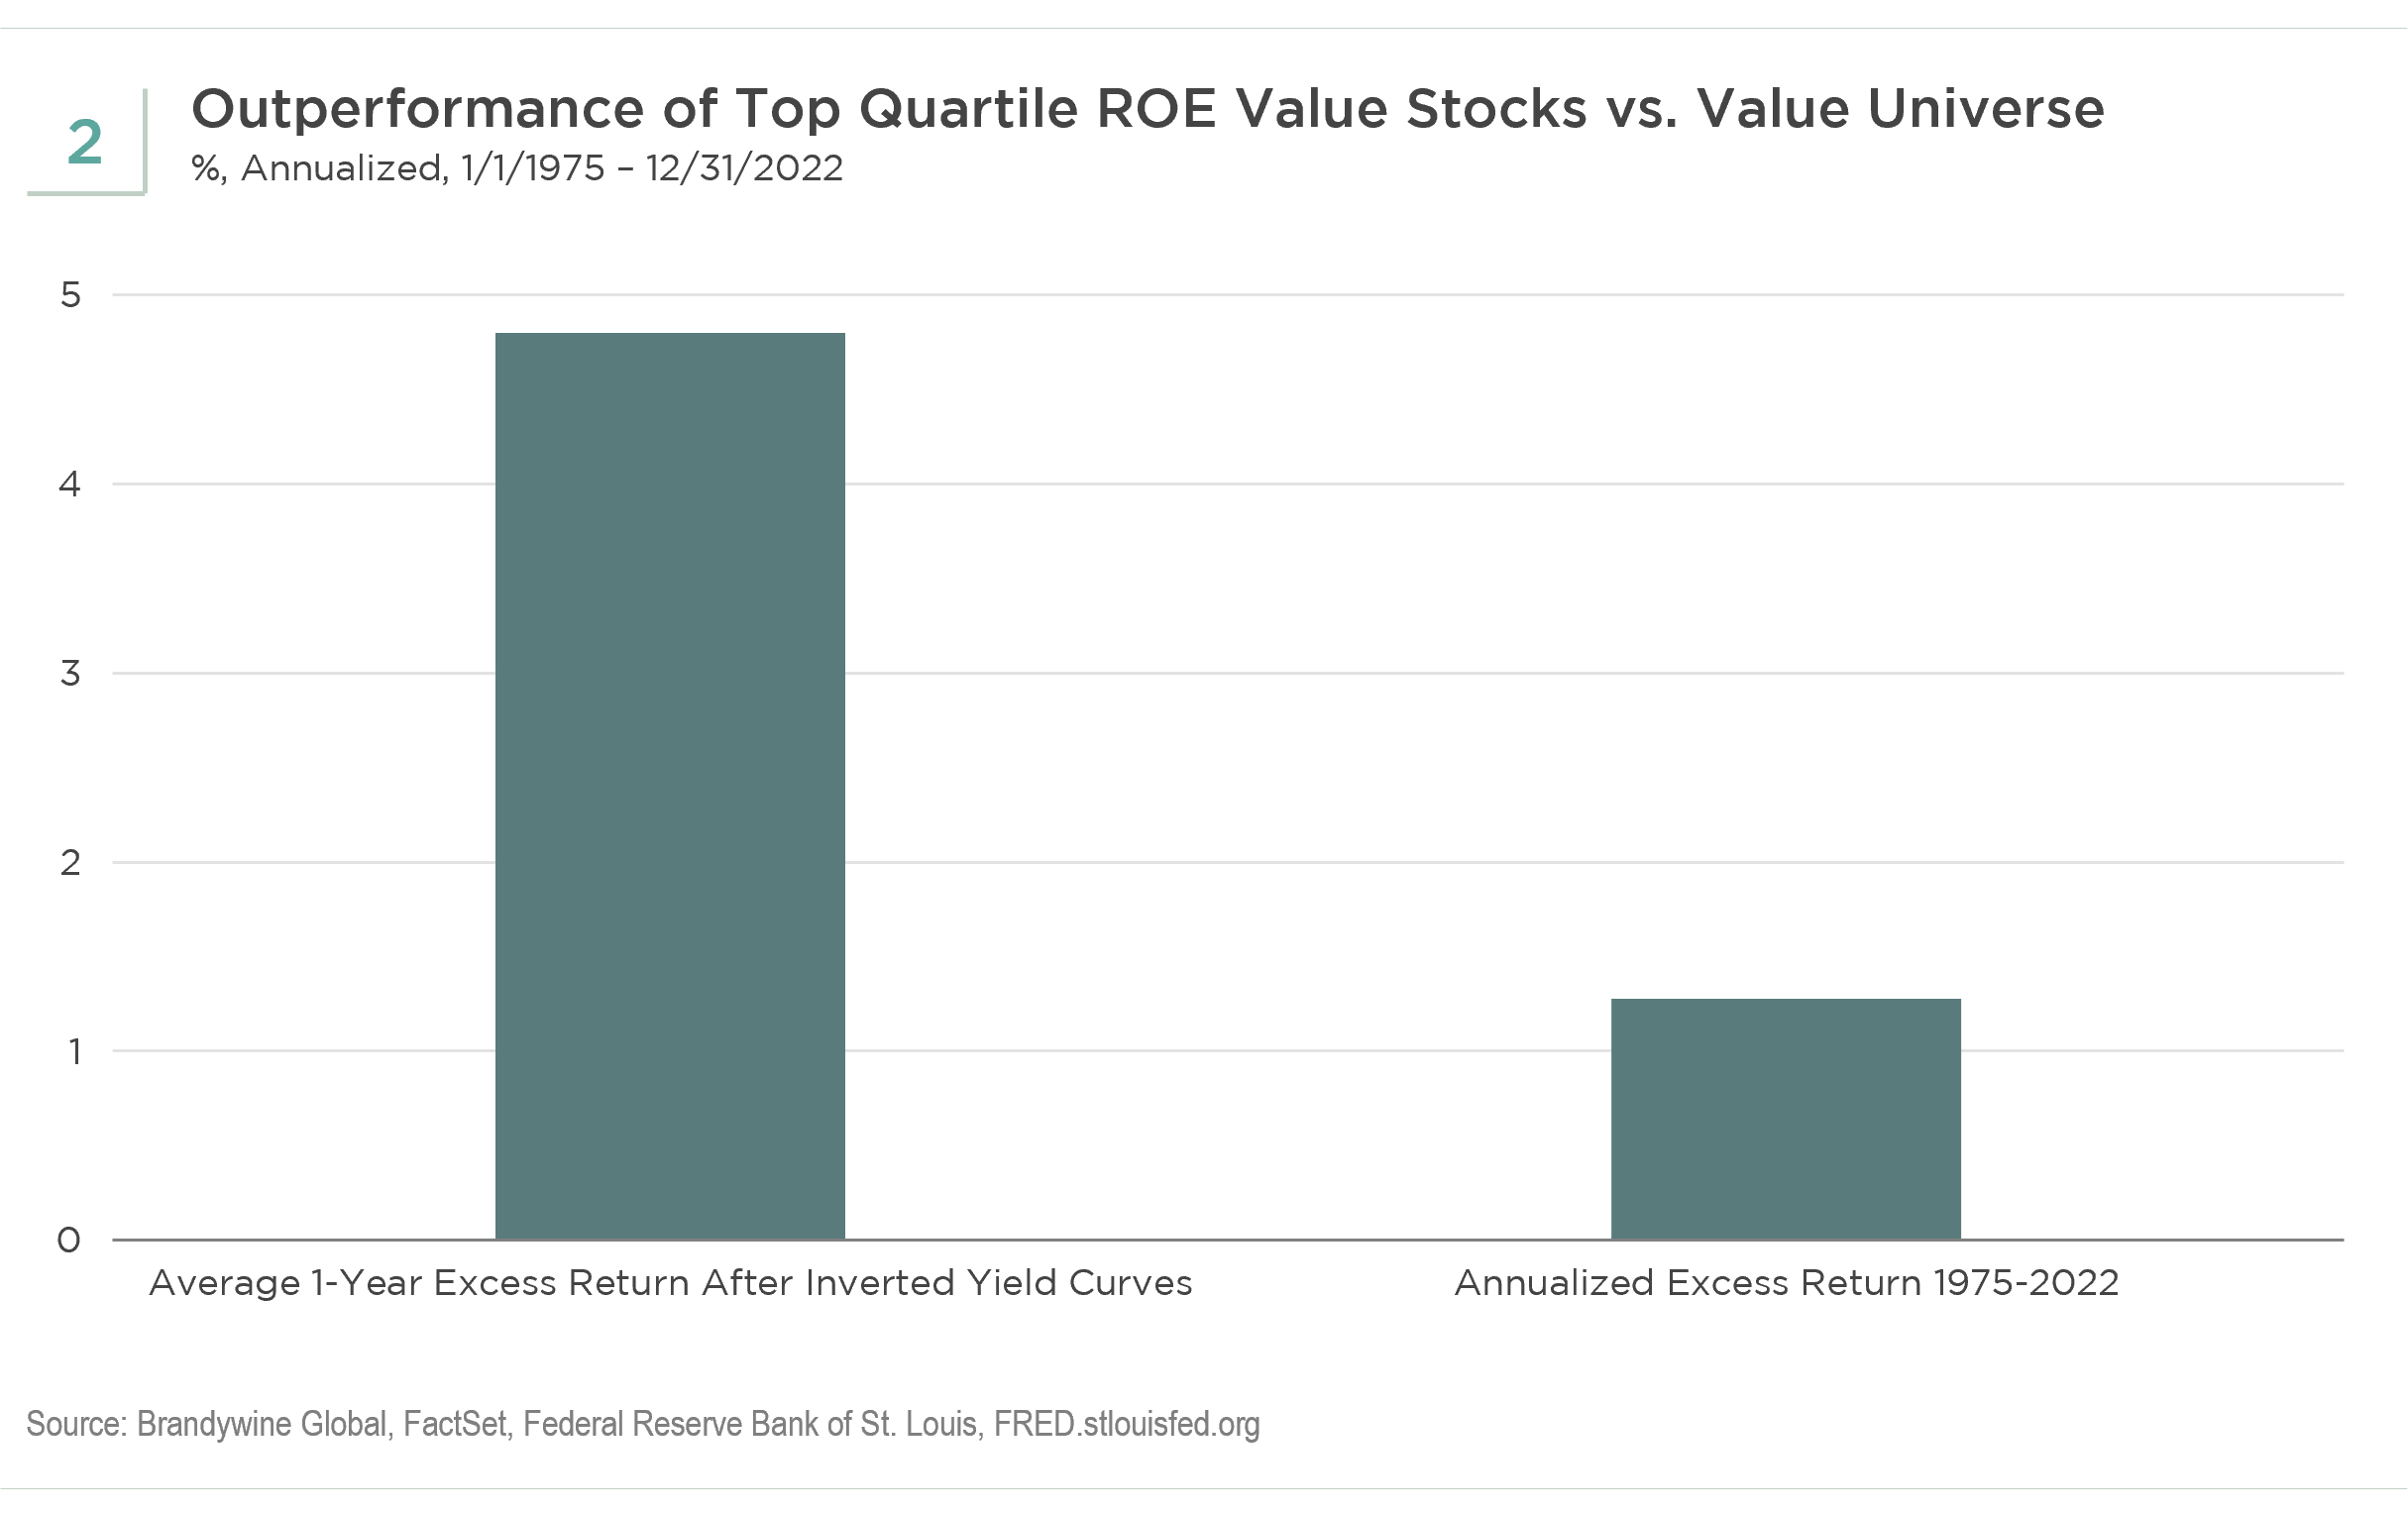
Over the 47-year period since 1975, value stocks with high ROE ratios outperformed the value universe of stocks for the one-year period after the curve first inverts by an average of 4.8%. This result is much higher than the roughly 1.3% annualized outperformance high ROE stocks averaged relative to the value universe for the full time period, not just following yield curve inversions (see Figure 2). These profitable companies also outperformed in five of the last six occurrences of yield curve inversion since 1975. Historically, the inversion of the curve has been considered a predictor of recessions and often triggers a flight to quality by investors. Generally, there is uncertainty in the marketplace. Therefore, it makes intuitive sense that metrics based on fundamentals, like earnings, would outperform deeper-valued stocks based on price-to-book ratios, which can rely heavily on intangibles and can also be more speculative at times.
Broad Value Regimes Boost High ROE Value Stocks
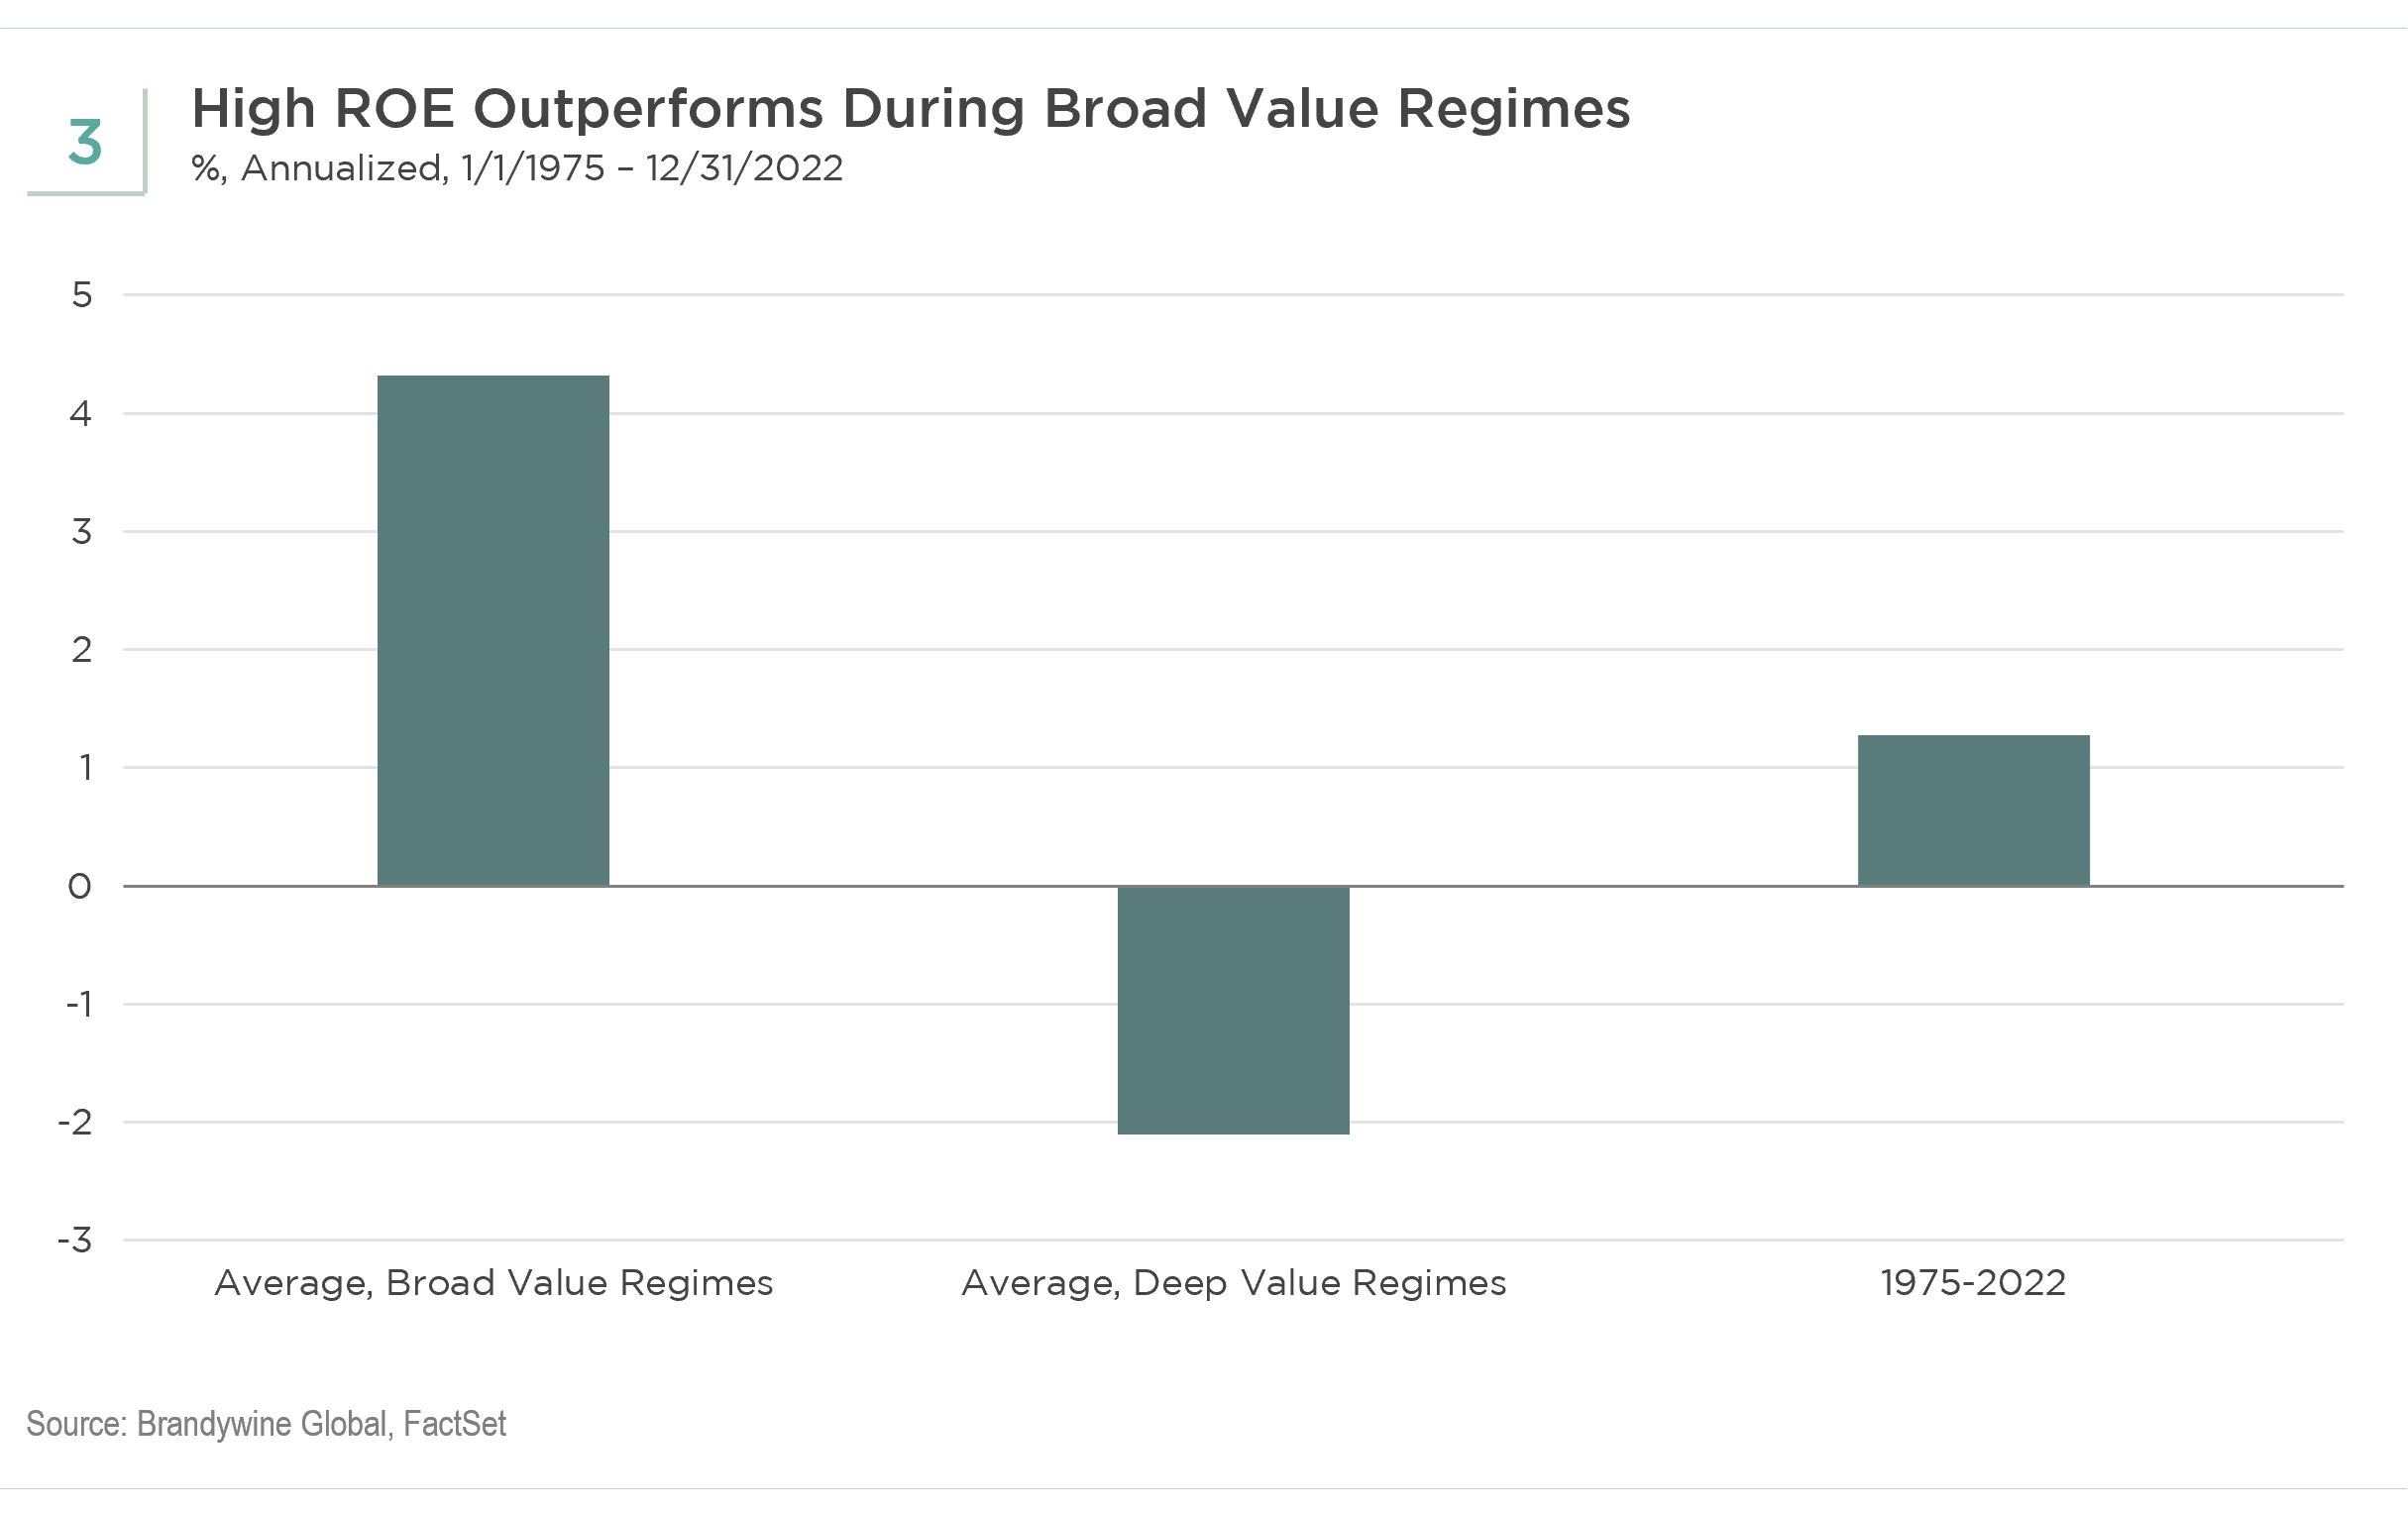
Our research based on valuation spreads has shown that high ROE stocks also tend to outperform during Broad Value regimes, such as the current broad value market environment and underperform during Deep Value regimes (see Figure 3). When spreads are narrow and begin to widen, we are in the Broad Value regime. When spreads are extremely wide and begin to narrow, we start the Deep Value regime.
Combining Yield Curve Inversion and Valuation Spread Analysis
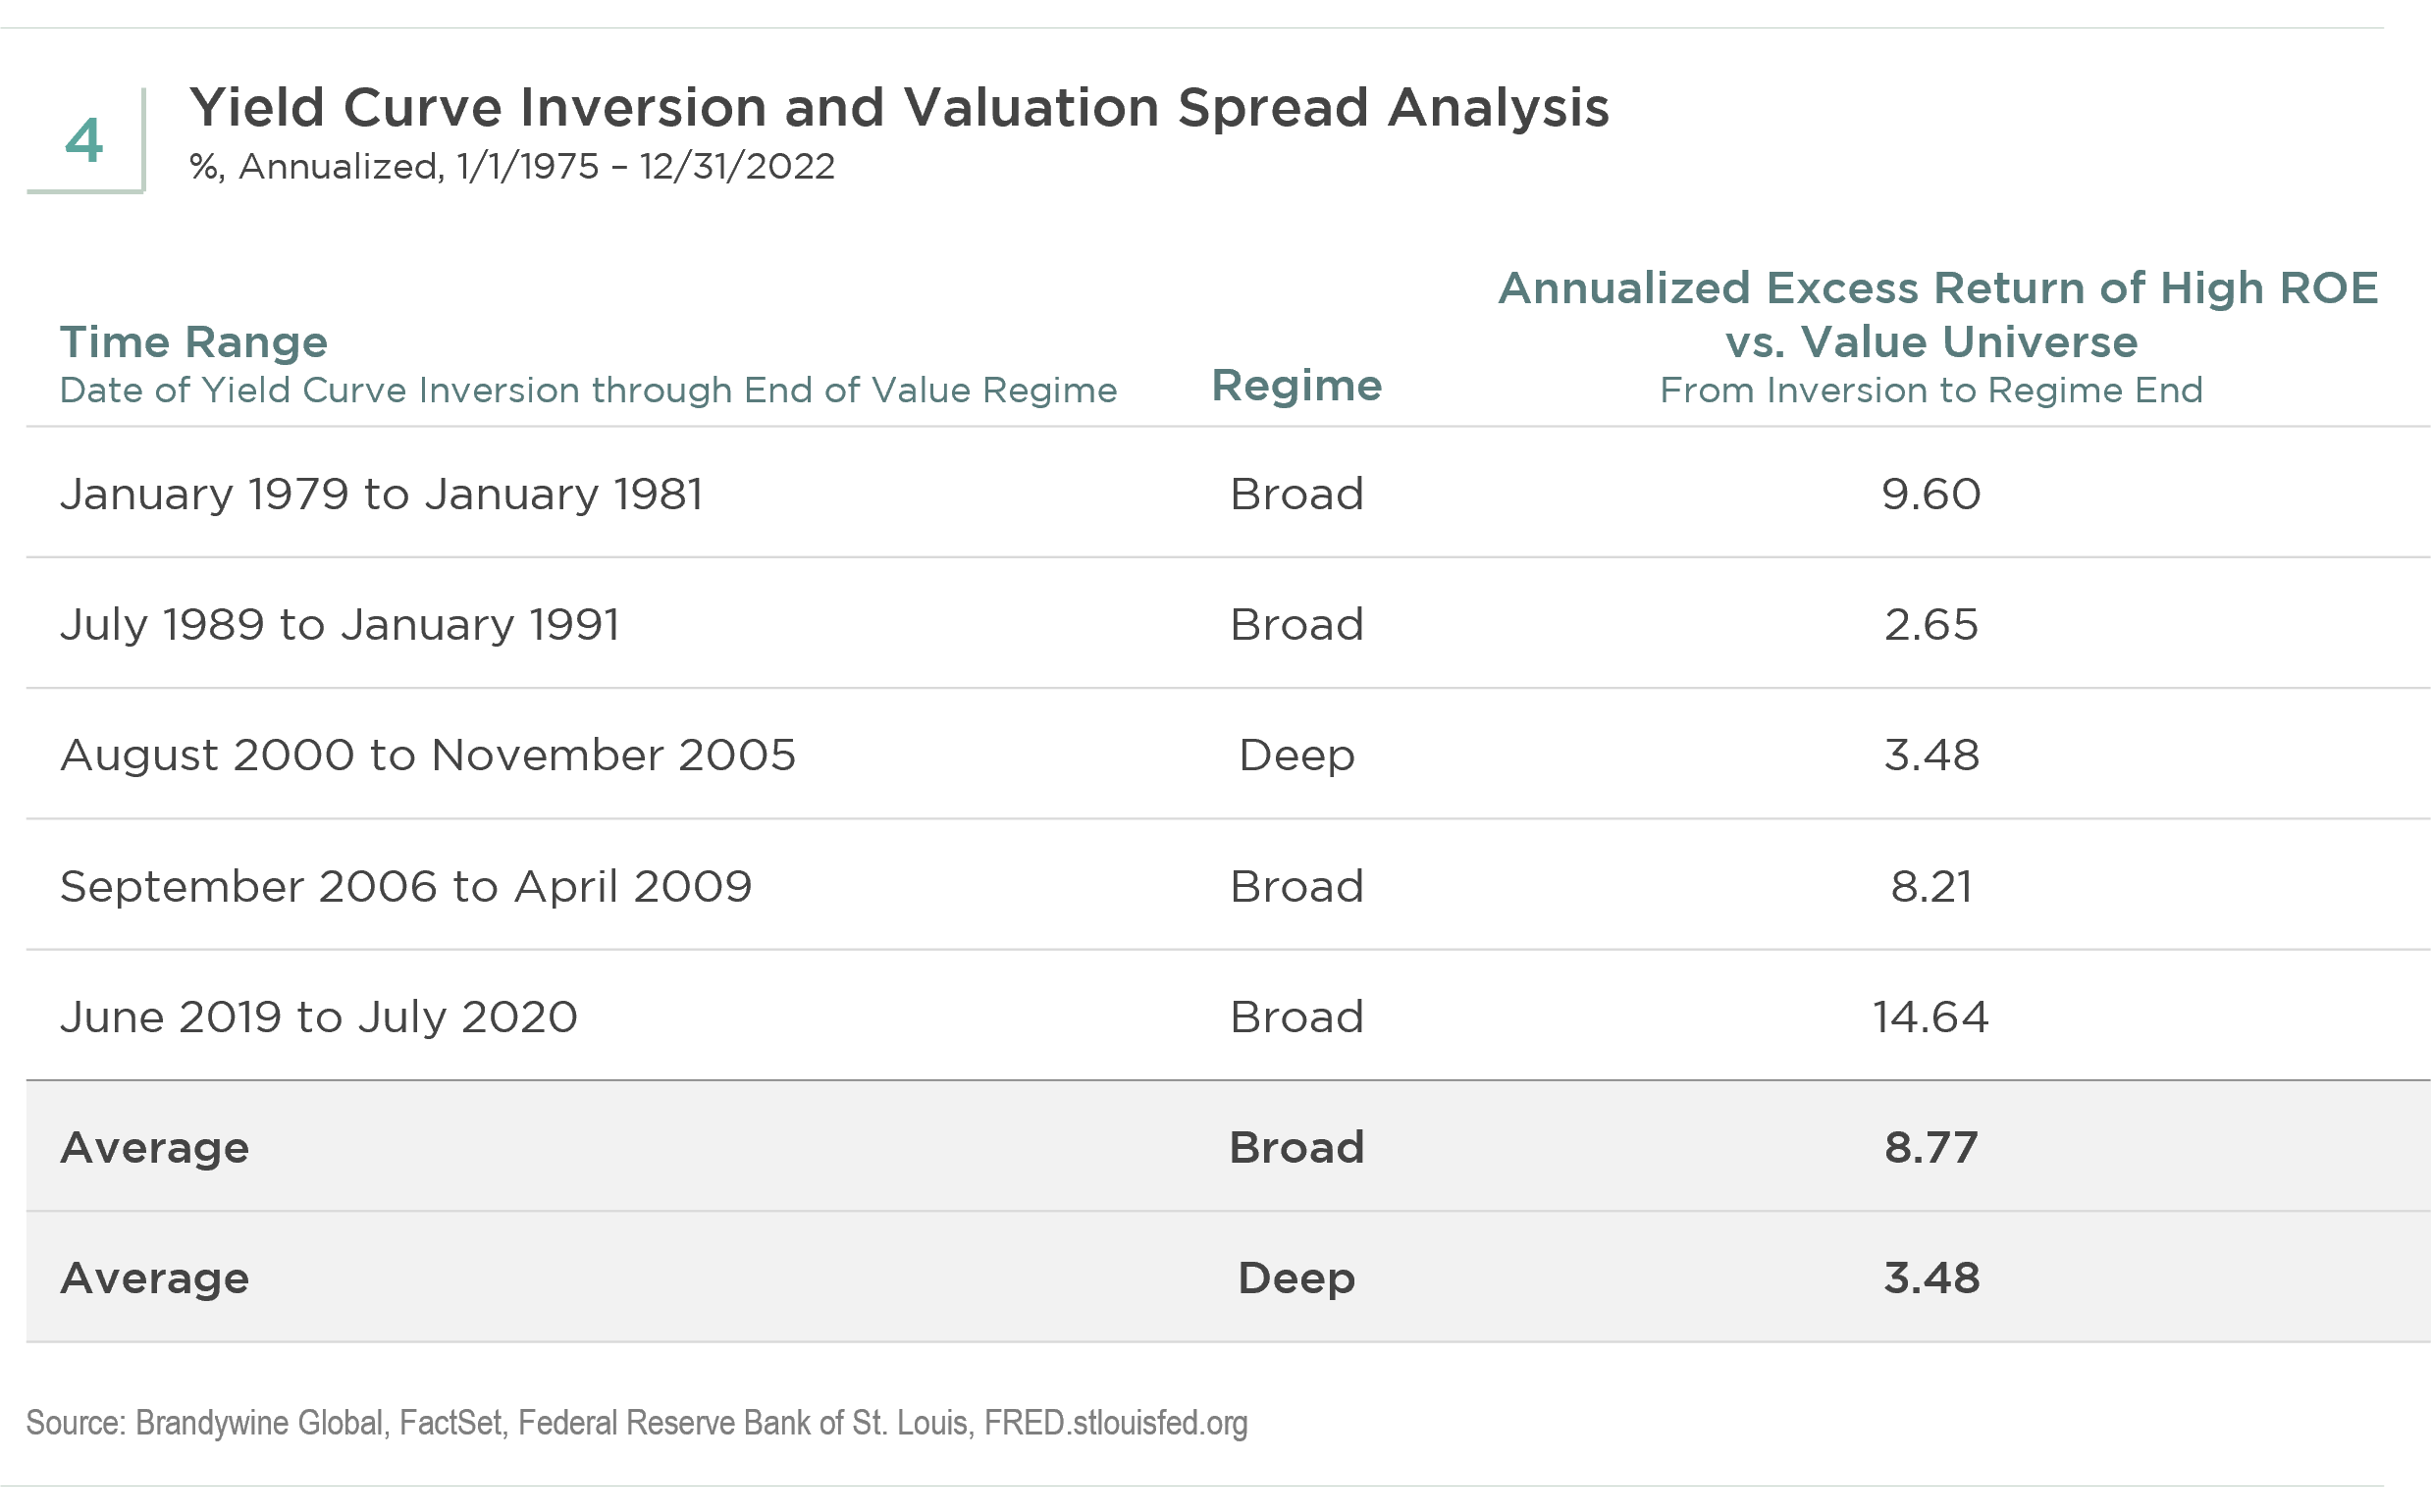
Next, we looked at how profitable companies perform after the yield curve first inverts until the end of the specific value regime, Broad or Deep, during which the inversion occurs. Not only do high ROE stocks have an even greater excess return when the yield curve inverts during a Broad Value regime, but also most of the inversions occur in Broad Value regimes (see Figure 4).
Investment Implications for Value Stocks
We found that typically, after an inversion, the yield curve generally steepens and eventually un-inverts toward the end of Broad Value regimes while stocks with high ROE continue to outperform. This behavior in the yield curve may be worth monitoring to determine if we are early or late in the Broad Value cycle. On average, there were about 14 months left in the Broad Value cycle after the curve inverted (see Figure 5).
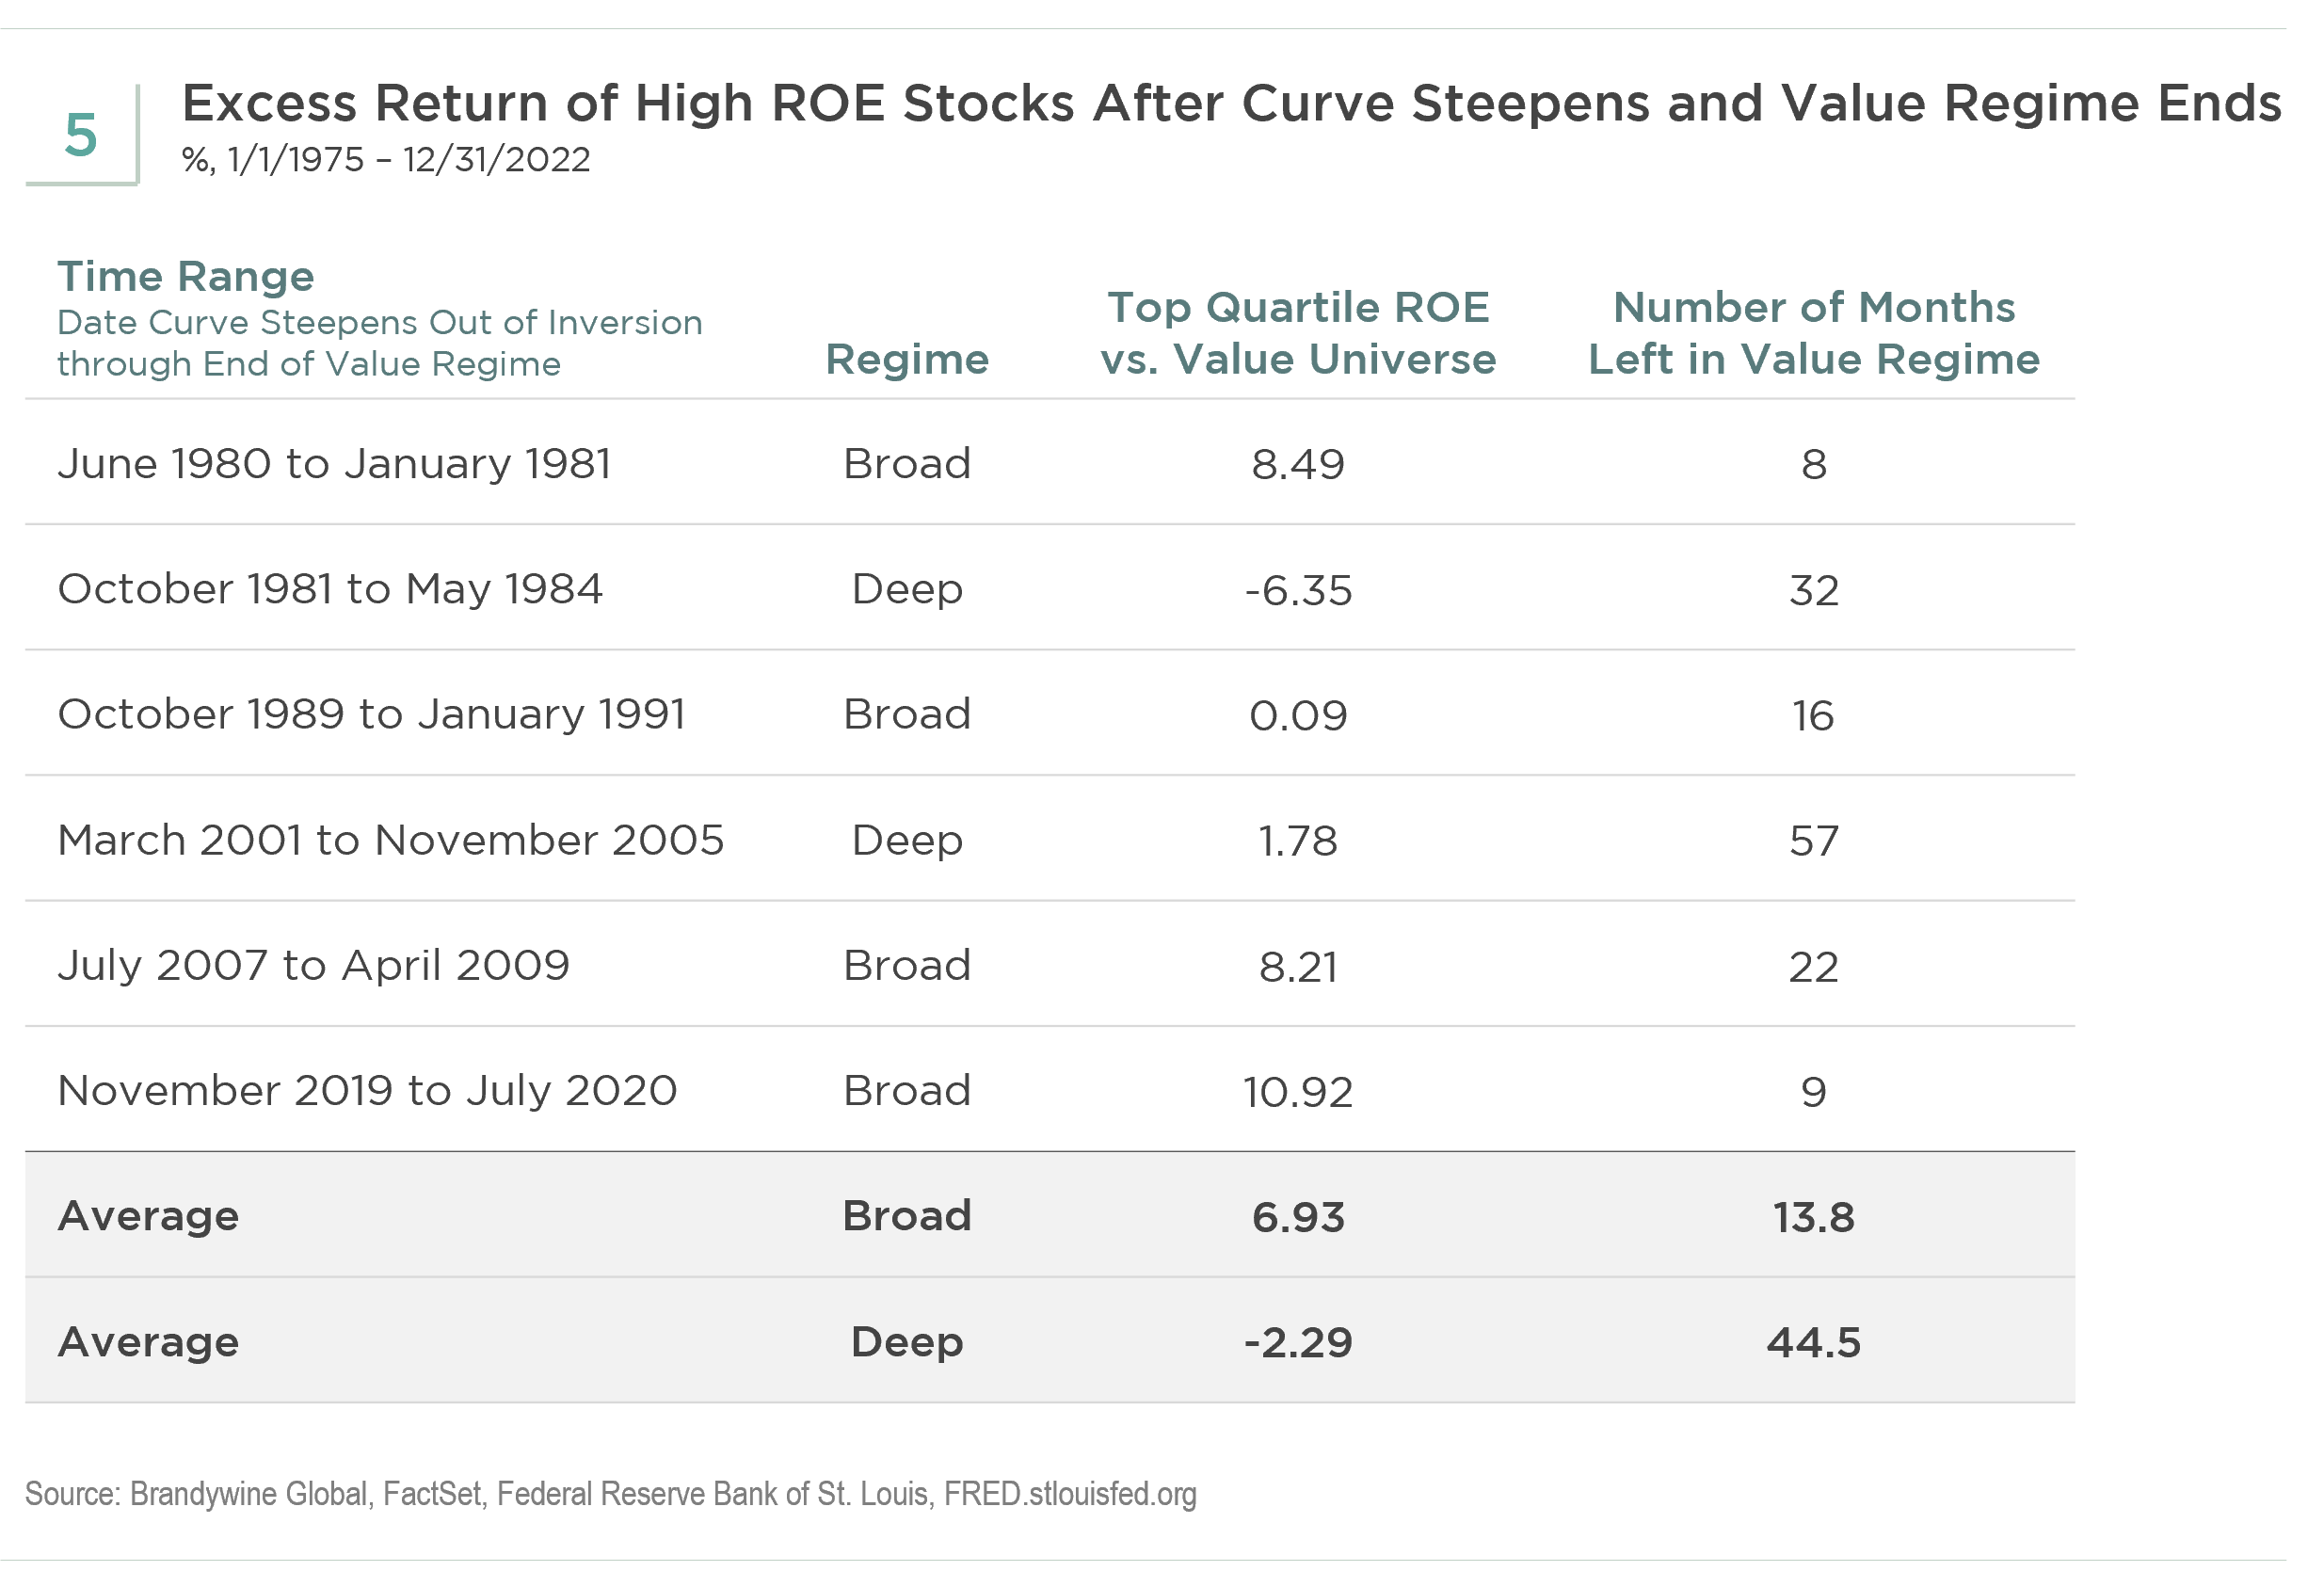
The yield curve steepening from negative to positive territory occurs as the Fed begins to significantly lower rates, signaling more imminent economic trouble. As the yield curve steepens, valuation spreads become very wide, and a Deep Value regime soon begins. After the Treasury curve becomes positive, the overall large-cap universe often enters lower-return environments. The chart below shows the absolute returns of the large-cap market during different phases in the yield curve and value cycles (see Figure 6). While the market was lowest during the inversion of the curve in a Deep Value regime, that was the only occurrence based on our methodology for yield curve inversion. The last three Broad Value regimes had lower return periods after inversion of the curve.
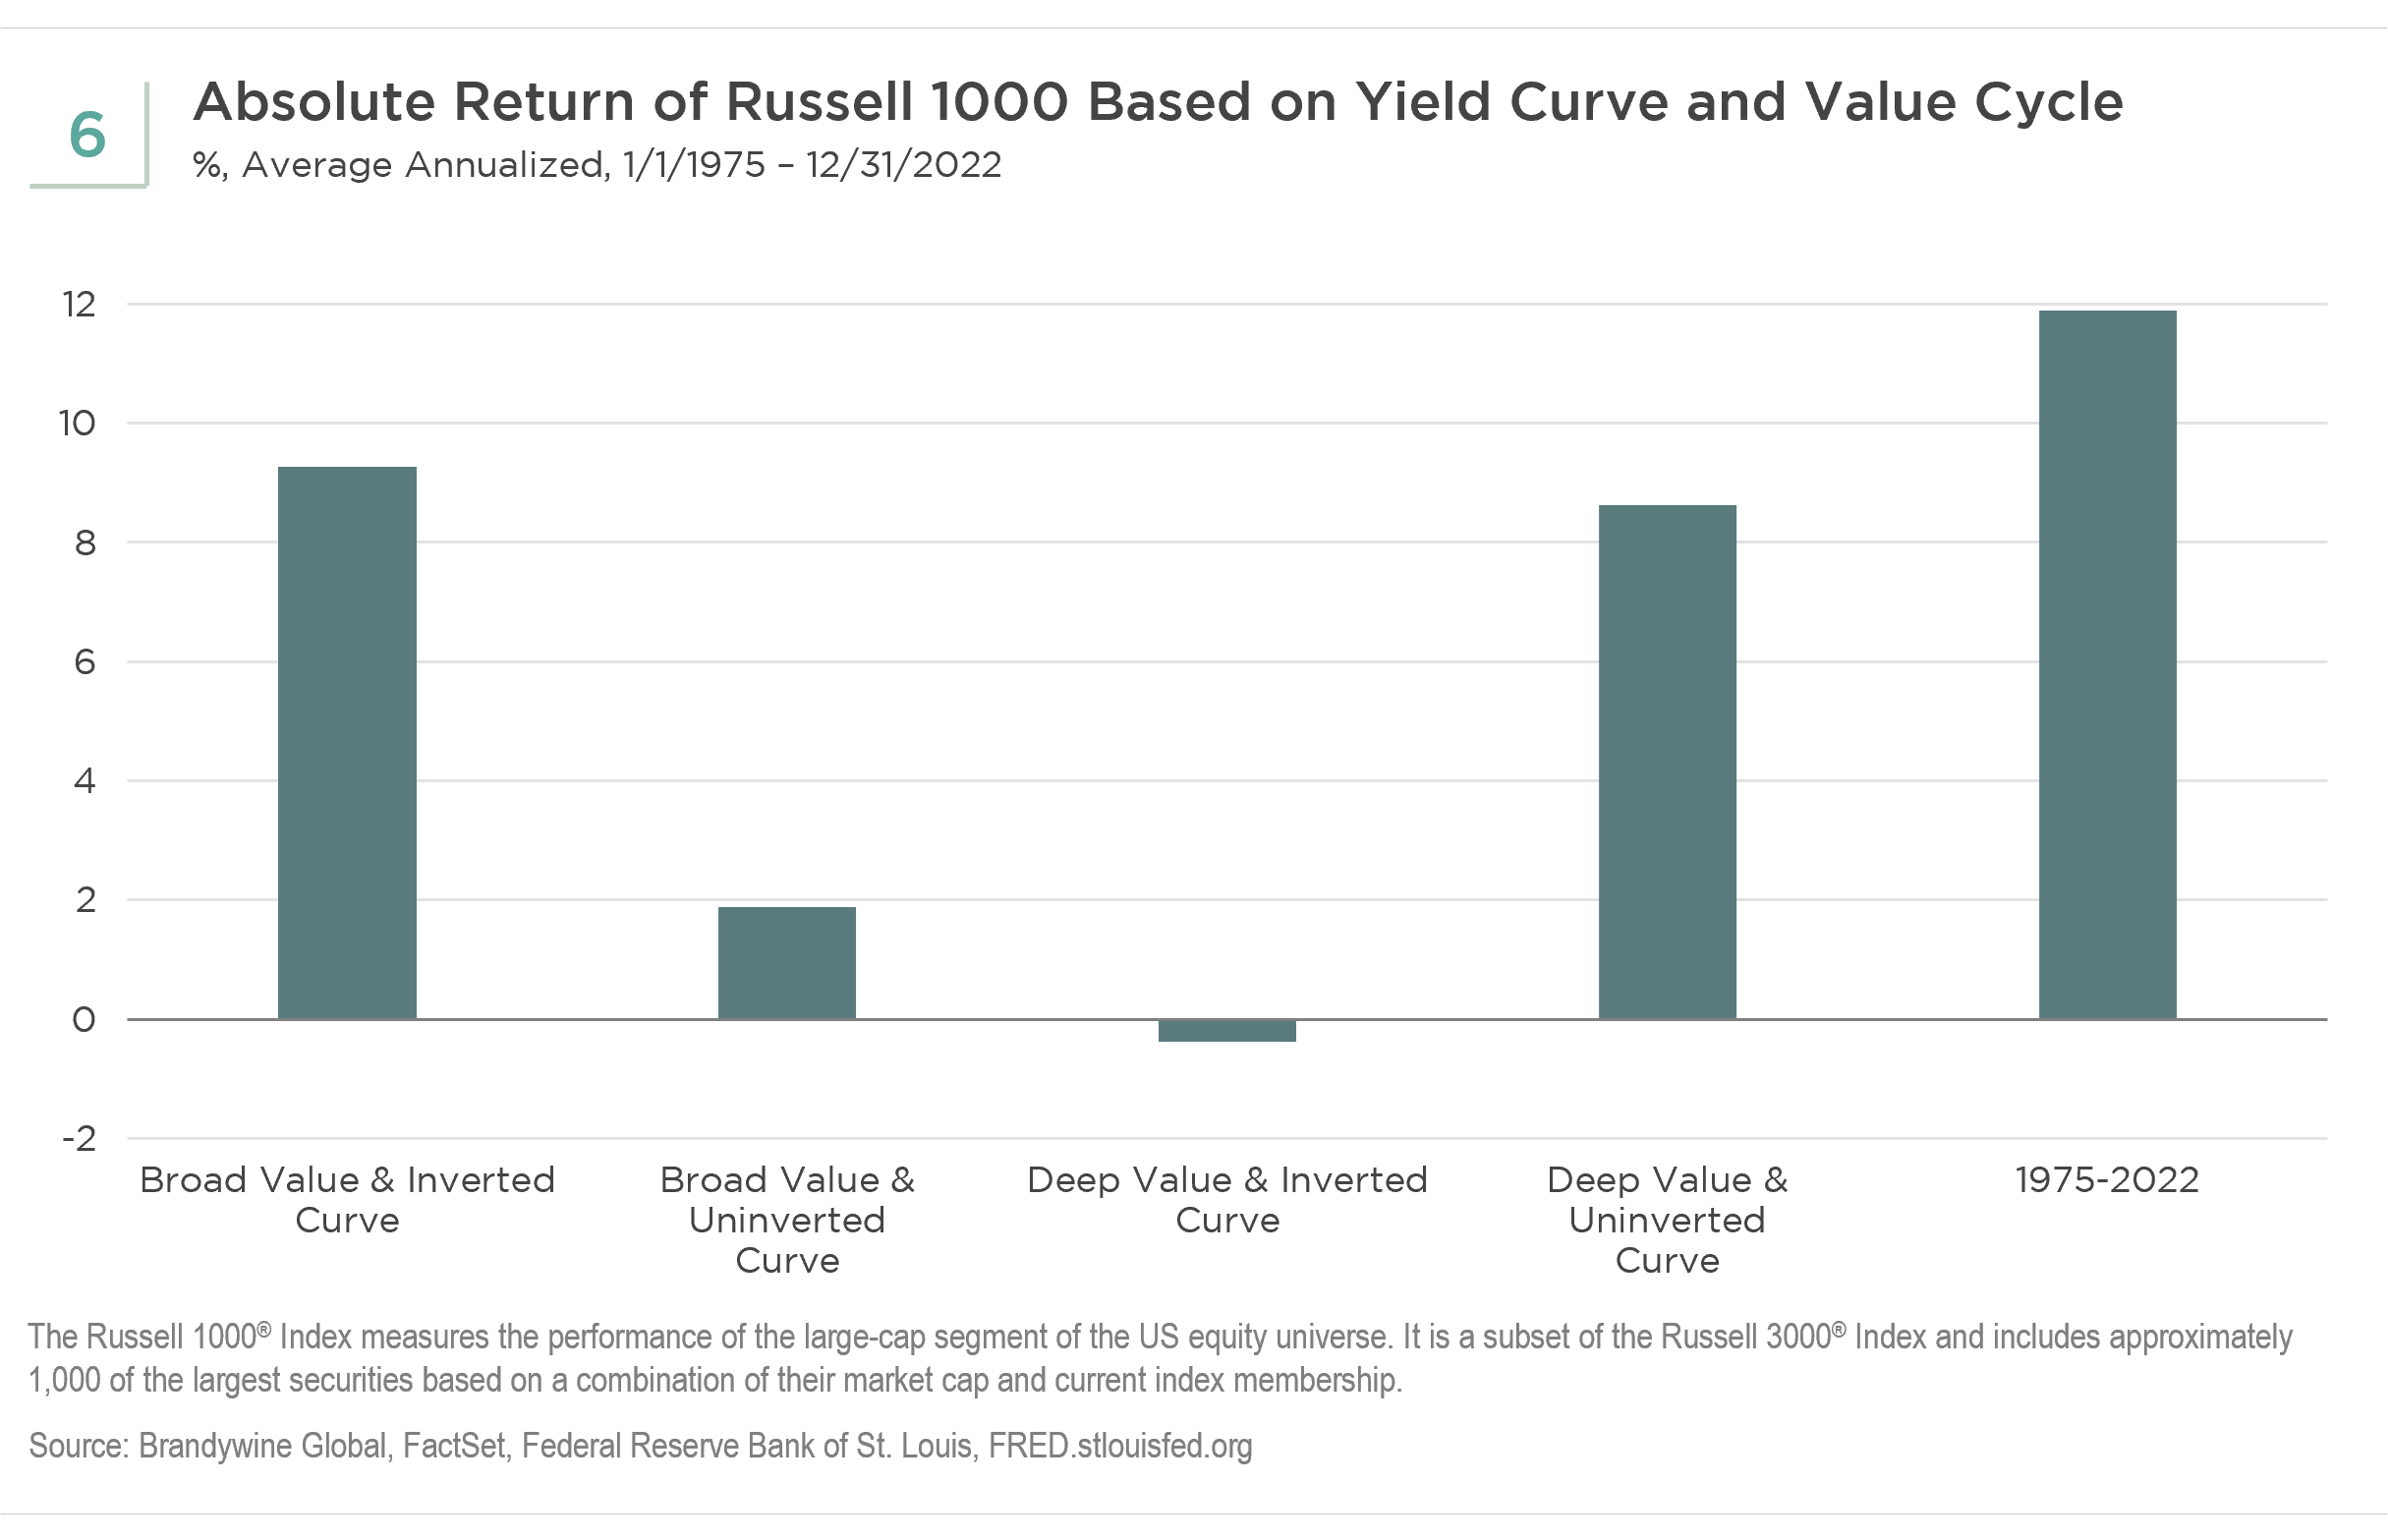
Key Takeaway: Valuation Spreads Combined with Yield Curve Changes Improve Analysis of Value Cycles and Factor Behavior
Currently, we are in a Broad Value regime concurrent with an inverted Treasury yield curve, which signals to us that profitable value companies, measured by top-quartile ROE, should begin to outperform deeper-valued companies. We do not expect to be in the later phase of the Broad Value regime until the Fed at least pauses and leans toward lowering rates as the yield curve remains wide versus history. While valuation spreads do an excellent job of timing both value and profitability factors, the change in the yield curve increases our understanding of value regimes, factor behavior, and possible market downturns while adding more detail to the timing between Broad and Deep Value. This research also suggests that now—as the Broad Value regime and tightening cycle advance—may be a good time to increase allocations to higher quality and away from deeper value and often more speculative equity investments.
Editor's Note: The summary bullets for this article were chosen by Seeking Alpha editors.
For further details see:
Linking Value Stocks To Yield Curve Inversions