SOJE - LVHD: Valuation And Quality Look Good Performance Is Disappointing
2024-01-07 02:40:05 ET
Summary
- Franklin U.S. Low Volatility High Dividend ETF implements a strategy based on yield, profitability, price volatility and earnings volatility.
- The portfolio is heavily invested in two defensive sectors: utilities and consumer staples.
- Valuation and quality metrics look good, but performance is underwhelming relative to the benchmark and popular dividend ETFs.
This article series aims at evaluating ETFs (exchange-traded funds) regarding the relative past performance of their strategies and metrics of their current portfolios. Reviews with updated data are posted when necessary.
LVHD strategy
Franklin U.S. Low Volatility High Dividend ETF ( LVHD ) started investing operations on 12/28/2015 and tracks the Franklin Low Volatility High Dividend Index. As of writing this, LVHD has 126 holdings, a 12-month distribution yield of 3.54% and a net expense rate of 0.27%. Distributions are paid quarterly.
As described in the prospectus by Franklin Templeton , eligible stocks must be in the 3000 largest capitalizations of the U.S. market and...
... have demonstrated profitability over the last four fiscal quarters as a whole. Stocks whose yields are not supported by earnings are excluded from the Underlying Index. The methodology calculates a composite "stable yield" score, with the yield of stocks with relatively higher price volatility and earnings volatility adjusted downward and the yield of stocks with relatively lower price volatility and earnings volatility adjusted upward. Franklin Advisers anticipates that the number of component securities in the Underlying Index will range from 50 to 100. At the time of each reconstitution, no individual component of the Underlying Index will exceed 2.5% of the Underlying Index, no individual sector will exceed 25% of the Underlying Index, and real estate investment trust ("REIT") components as a whole will not exceed 15% of the Underlying Index. The Underlying Index's components are reconstituted annually and rebalanced quarterly.
The portfolio had a turnover rate of 52% in the most recent fiscal year and 14% in the previous year. This article will use as a benchmark the Russell 3000 index, represented by the iShares Russell 3000 ETF ( IWV ).
LVHD portfolio
The fund invests almost exclusively in U.S. companies (99% of asset value), mostly in the small and mid-cap segments (63% of assets according to Fidelity classification). The heaviest sectors are utilities (21.9%), consumer staples (21.4%) and real estate (14.7%). Other sectors are below 12%. Compared to the Russell 3000, LVHD massively overweights these top three sectors. It greatly underweights technology, consumer discretionary, healthcare, materials and almost ignores energy.
Sector breakdown (chart: author; data: Franklin Templeton, iShares)
The top 10 holdings, listed in the next table with some fundamental ratios, represent 26.4% of asset value. All constituent weights are under 3%, so risks related to individual stocks are low.
| Ticker |
| Name |
| Weight% |
| EPS growth %TTM |
| P/E TTM |
| P/E fwd |
| Yield% |
| Verizon Communications Inc. |
| 2.96 |
| 7.88 |
| 8.10 |
| 8.54 |
| 6.62 |
| U.S. Bancorp |
| 2.95 |
| -19.99 |
| 13.06 |
| 12.36 |
| 4.47 |
| The Kraft Heinz Co. |
| 2.7 |
| 146.21 |
| 15.67 |
| 12.80 |
| 4.22 |
| Realty Income Corp. |
| 2.62 |
| 23.09 |
| 44.00 |
| 44.39 |
| 5.31 |
| The Southern Co. |
| 2.62 |
| -12.45 |
| 25.92 |
| 19.88 |
| 3.91 |
| Johnson & Johnson |
| 2.59 |
| -27.07 |
| 30.75 |
| 16.25 |
| 2.95 |
| Keurig Dr Pepper Inc. |
| 2.55 |
| 7.40 |
| 23.30 |
| 17.95 |
| 2.69 |
| The Coca-Cola Co. |
| 2.51 |
| 8.73 |
| 24.06 |
| 22.23 |
| 3.08 |
| Philip Morris International Inc. |
| 2.48 |
| -8.34 |
| 18.52 |
| 15.58 |
| 5.46 |
| American Electric Power Co., Inc. |
| 2.46 |
| -9.68 |
| 19.32 |
| 15.93 |
| 4.19 |
Historical performance
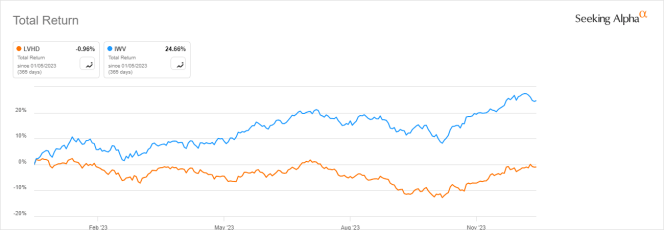
Since inception, LVHD has underperformed IWV by 4% in annualized return, with a lower volatility (measured in the next table as standard deviation of monthly returns), but a slightly deeper drawdown.
| Total Return |
| Annual Return |
| Drawdown |
| Sharpe ratio |
| Volatility |
| LVHD |
| 92.49% |
| 8.52% |
| -37.32% |
| 0.53 |
| 14.30% |
| IWV |
| 157.71% |
| 12.55% |
| -35.22% |
| 0.76 |
| 16.52% |
The gap is over 25% in the last 12 months, as plotted below:
LVHD vs Russell 3000, 12-month total return (Seeking Alpha)
The sum of annualized distribution has increased from $0.71 per share in 2016 to $1.29 in 2023. The 7-year dividend growth rate of 81.7% is far ahead the cumulative inflation (about 27% in the same period, based on CPI).
LVHD distribution history (Seeking Alpha)
Valuation and quality
LVHD is materially cheaper than the benchmark regarding the usual valuation ratios, as reported in the next table.
| LVHD |
| IWV |
| Price / Earnings TTM |
| 15.42 |
| 21.33 |
| Price / Book |
| 1.85 |
| 3.56 |
| Price / Sales |
| 2.16 |
| 2.29 |
| Price / Cash Flow |
| 10.79 |
| 14.8 |
In previous articles, I have shown how three factors may help cut the risk in a dividend portfolio: Return on Assets , Piotroski F-score , Altman Z-score . My core portfolio holds 14 stocks selected using these quality metrics (more info at the end of this post). I consider that risky stocks are companies with at least 2 red flags among: bad Piotroski score, negative ROA, unsustainable payout ratio, bad or dubious Altman Z-score, excluding financials and real estate where these metrics are unreliable. With these assumptions, 7 stocks are risky among the current holdings of LVHD. They weigh only 6.4% of asset value, which is a good point.
Based on my calculation, the aggregate Piotroski F-score and return on assets are above the values of IWV. These metrics point to a portfolio quality slightly superior to the benchmark.
| LVHD |
| IWV |
| Piotroski F-score |
| 5.71 |
| 5.13 |
| ROA % TTM |
| 5.82 |
| 3.74 |
Competitors
The next table compares characteristics of LVHD and the three largest dividend-oriented ETFs (in assets):
- Dividend Appreciation Index Fund ( VIG )
- Schwab U.S. Dividend Equity ETF ( SCHD )
- Vanguard High Dividend Yield Index ETF ( VYM )
| LVHD |
| SCHD |
| VIG |
| VYM |
| Inception |
| 12/28/2015 |
| 10/20/2011 |
| 4/21/2006 |
| 11/10/2006 |
| Expense Ratio |
| 0.27% |
| 0.06% |
| 0.06% |
| 0.06% |
| AUM |
| $875.96M |
| $52.09B |
| $73.03B |
| $50.97B |
| Avg Daily Volume |
| $5.02M |
| $295.73M |
| $262.67M |
| $149.54M |
| Yield TTM |
| 3.54% |
| 3.48% |
| 1.90% |
| 3.11% |
| Dividend Growth 5 Yr (annualized) |
| 3.33% |
| 13.05% |
| 9.50% |
| 5.59% |
LVHD has the highest fee of this group. It also has the highest yield, but the lowest 5-year dividend growth.
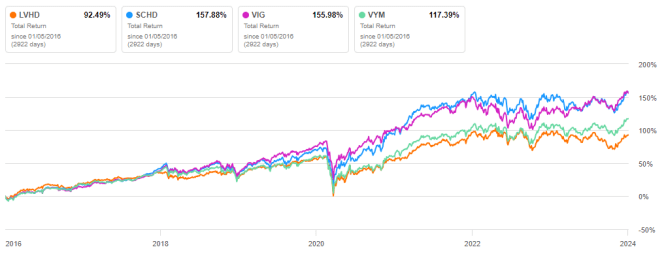
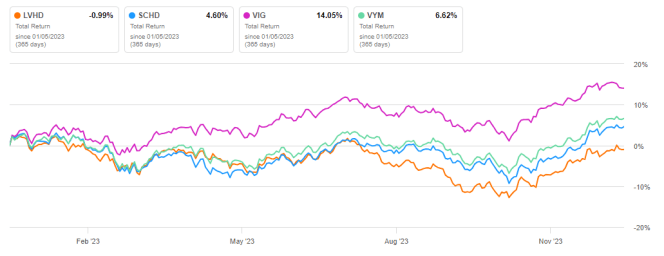
As reported on the next charts, it has steadily underperformed since its inception, especially in the last 12 months.
LVHD vs competitors, 8-year total return (Seeking Alpha) LVHD vs competitors, 12-month total return (Seeking Alpha)
Takeaway
Franklin U.S. Low Volatility High Dividend ETF ( LVHD ) holds about 120 dividend stocks of profitable U.S. companies, selected based on yield, price volatility and earnings volatility. About 43% of asset value is in two defensive sectors: utilities and consumer staples. Valuation and quality metrics are better than the benchmark, but performance since inception is underwhelming compared to the Russell 3000 and to SCHD, which has a similar yield. Nevertheless, 8 years of data mostly in a strong bull market are not enough to assess the strategy's potential on a full market cycle.
For further details see:
LVHD: Valuation And Quality Look Good, Performance Is Disappointing