CHDRF - LVMH/Christian Dior: All Things Luxury Showing A Buy Setup
2023-09-05 13:13:17 ET
Summary
- Have you ever seen the luxury goods sector cheap? Not often.
- But we share a setup that can help us define risk vs. reward.
- We also share how we derive the risk vs. reward.
by Levi at Elliott Wave Trader; produced with Avi Gilburt.
There are moments when the market will present a setup in rather clear fashion. Of course, we must always use proper risk management. But, when the chart shows us a proper structure, then the risk can be distinctly defined and give us a better chance at success. The luxury goods sector is doing just that.
Christian Dior, Fendi, Givenchy, TAG Heuer, Bulgari… and many more. In fact, the two tickers mentioned here, LVMH Moët Hennessy (LVMHF) and Christian Dior SE (CHDRF) aka DIOR, represent more than 75 different well-known luxury brands. Also, remember that DIOR holds 42.36% shares and 59.01% of voting rights within LVMH. That's why their current respective setups are so synonymous with each other.
Let's look at the Fundamental snapshot first.
The Fundamentals Of Luxury
Here are some recent comments from our lead fundamental analyst, Lyn Alden:
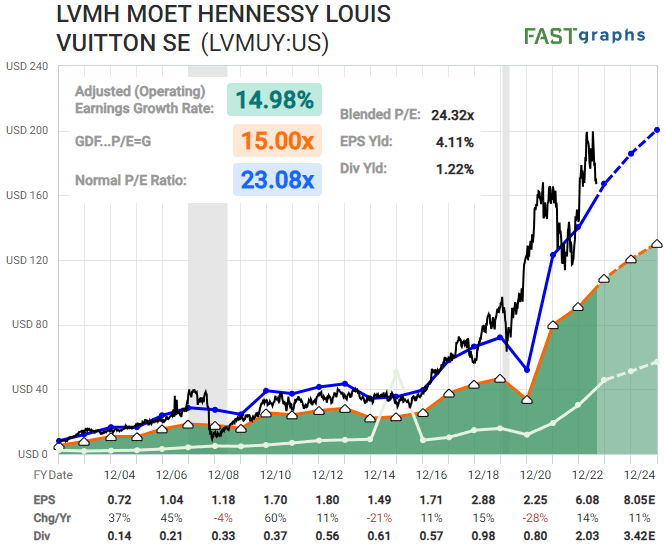
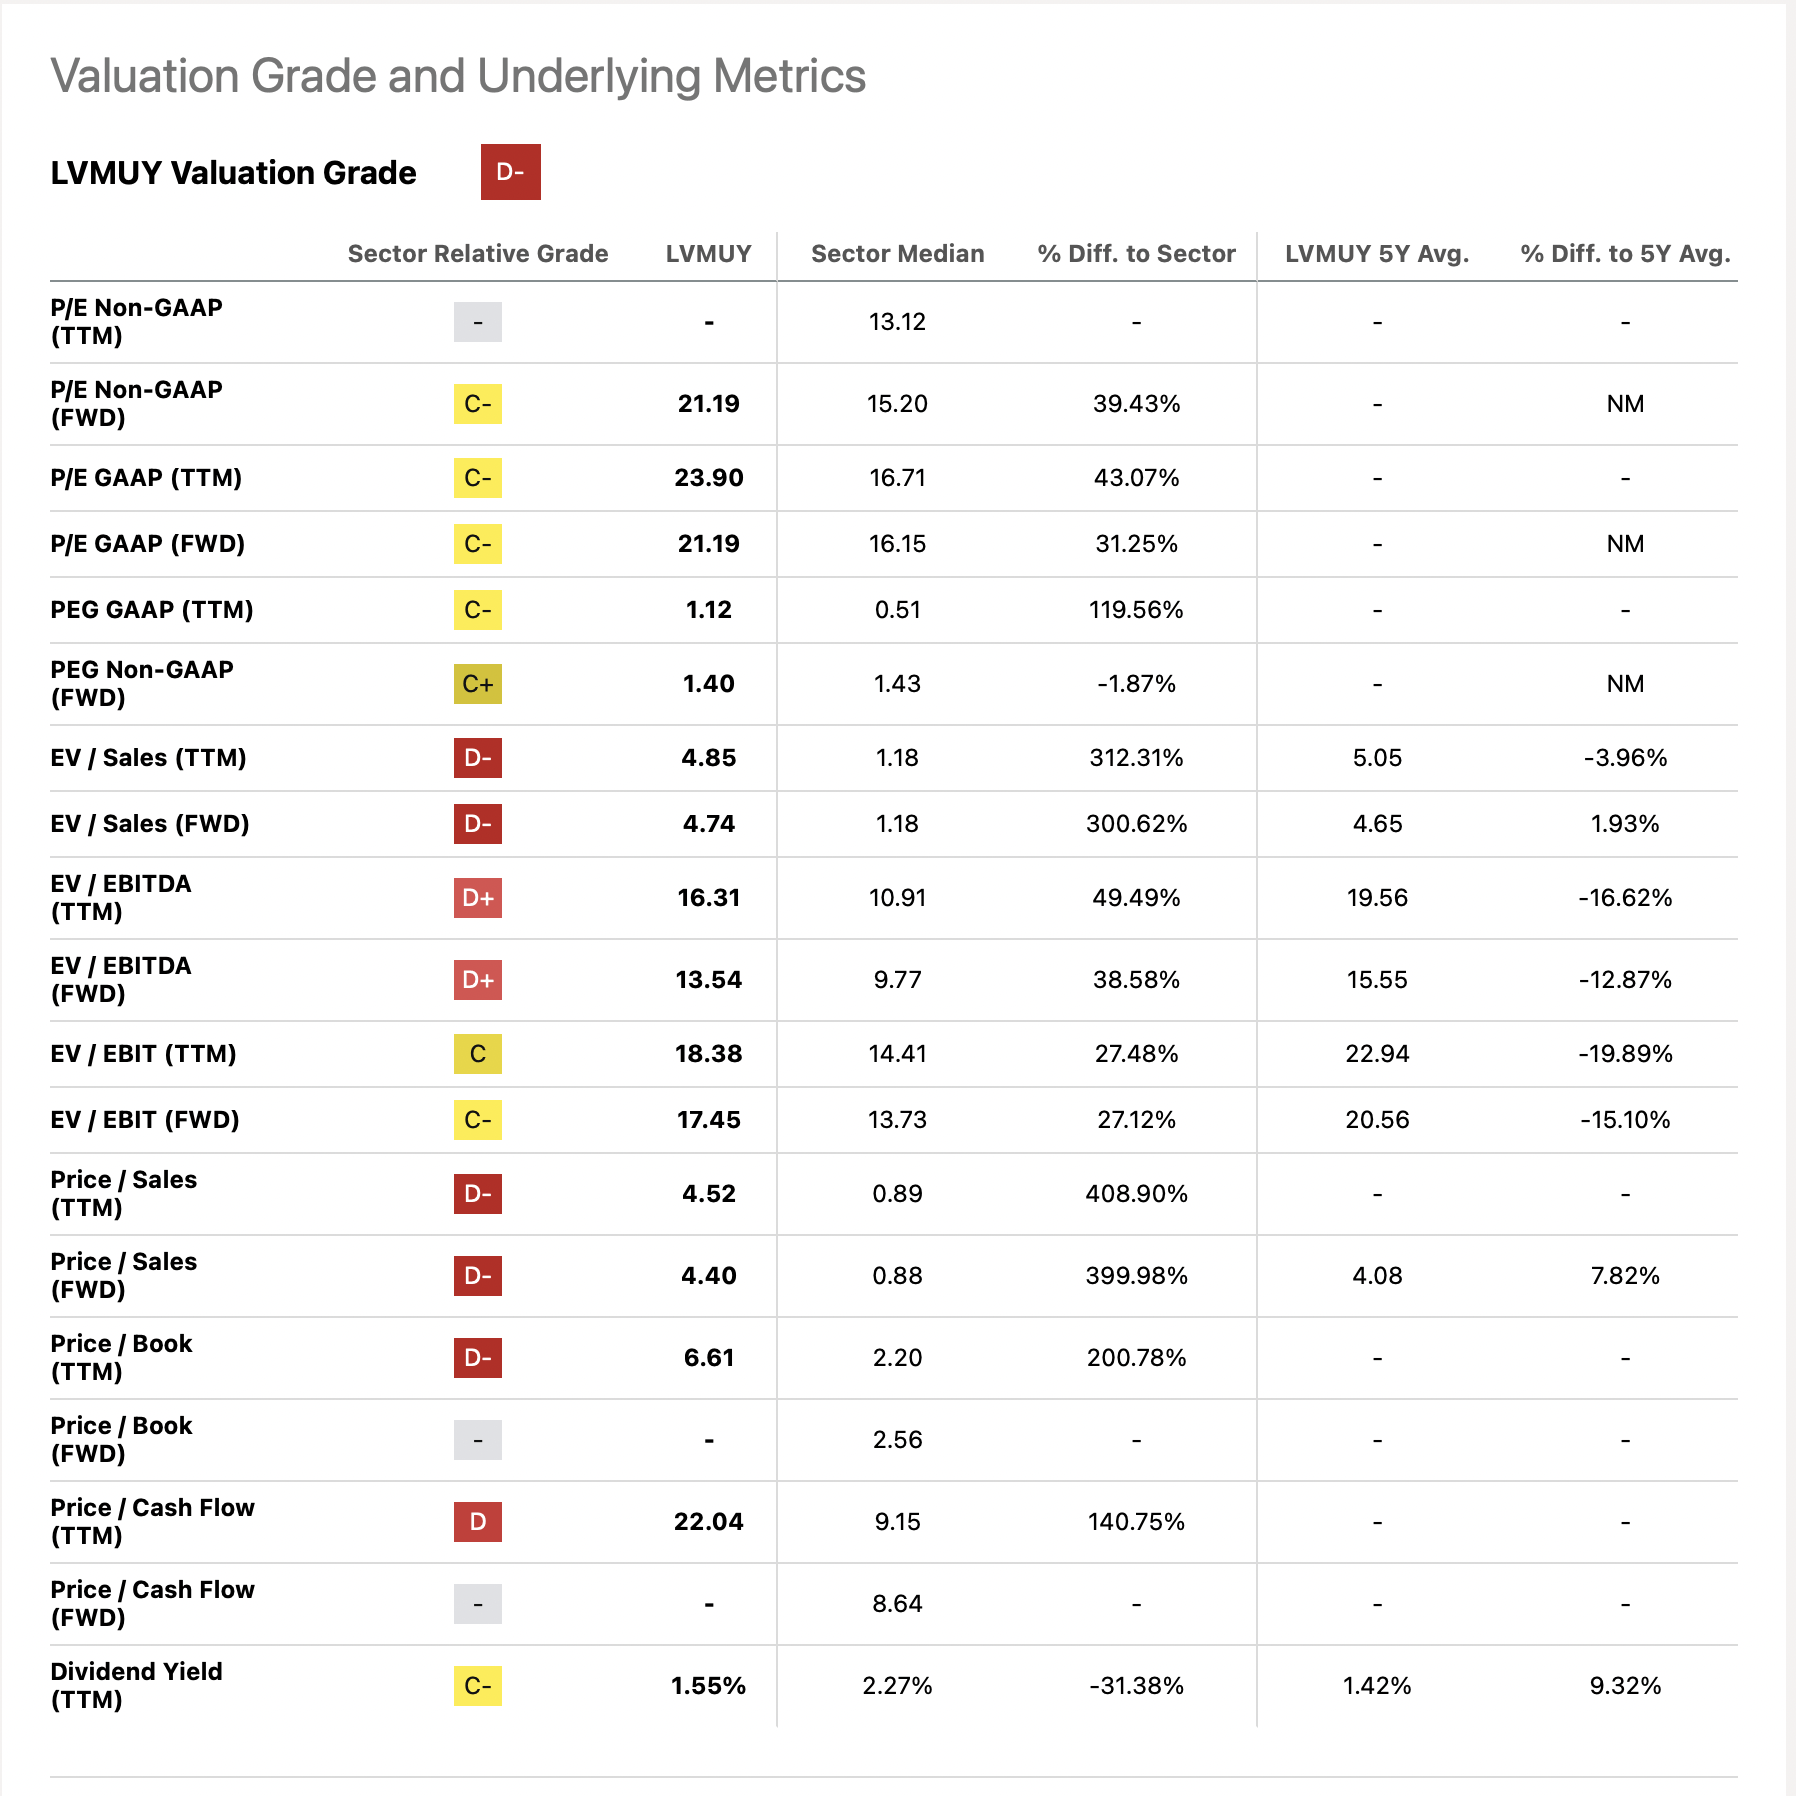
"LVMH is currently on the expensive side, so from a risk/reward perspective I would be more bullish if it were to correct a bit lower and then start forming a bottom. The company is very high quality with a strong balance sheet and a lot of diversified branding power, but investors are paying full price for it at this time."
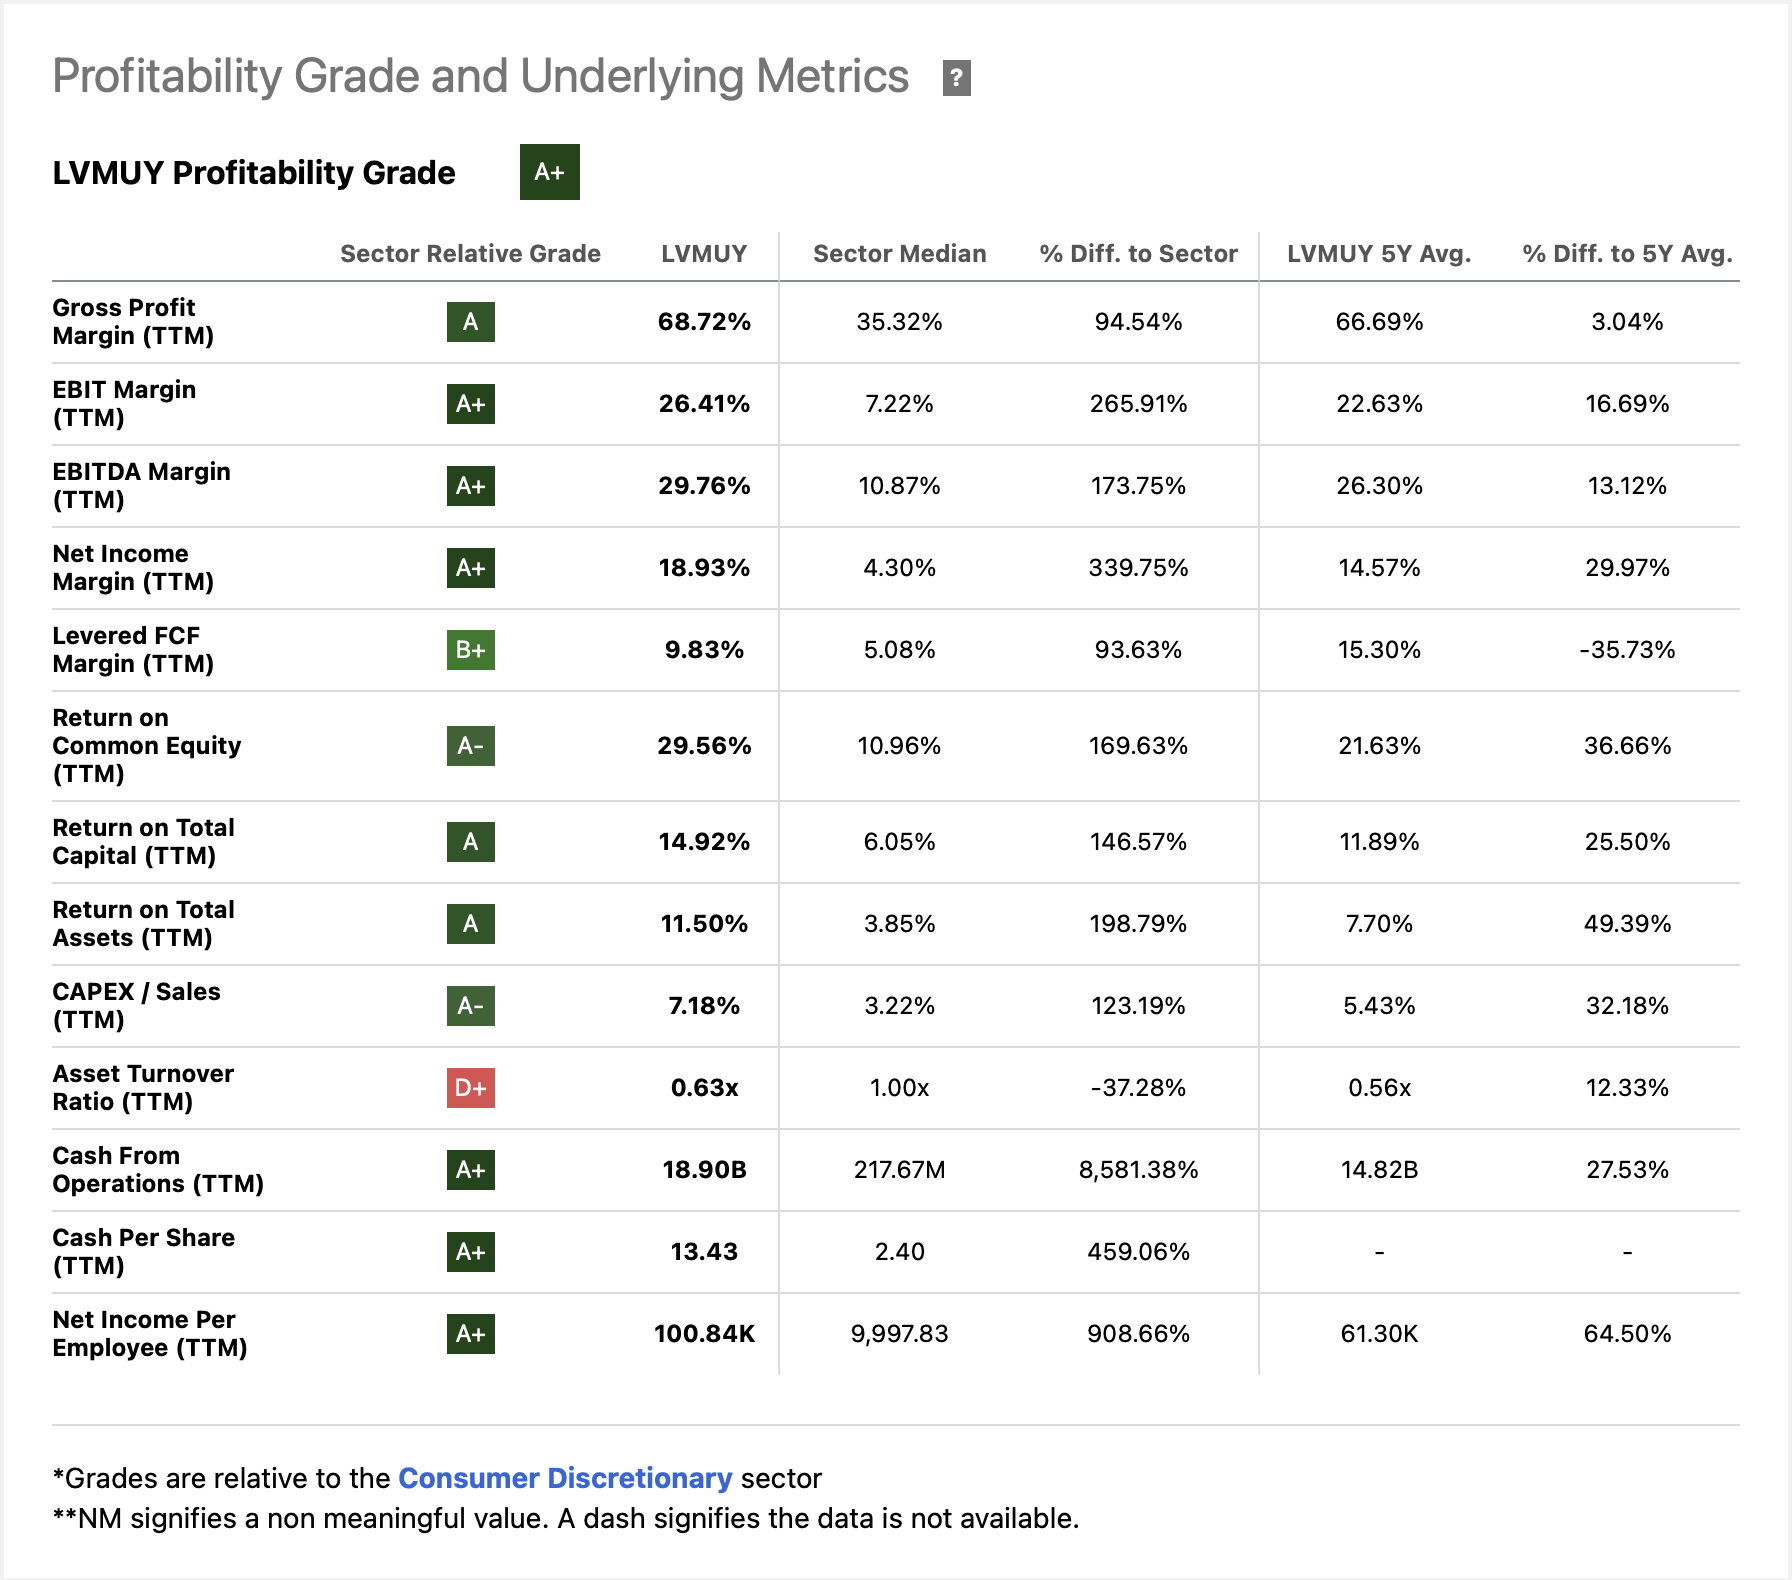
We can also see from the attached charts below that, while luxury is certainly not cheap, the profit margins are still wide.
Luxury Cheap?
Not often. Perhaps there will be a time in the future when these very luxury goods are priced at a lower valuation. However, the charts are not showing that to be the current case. So, with the supposition in hand that the luxury goods sector will strike a higher price over the next several months, what is the setup, and how can we define our risk vs. reward?
The Technicals With Garrett Patten
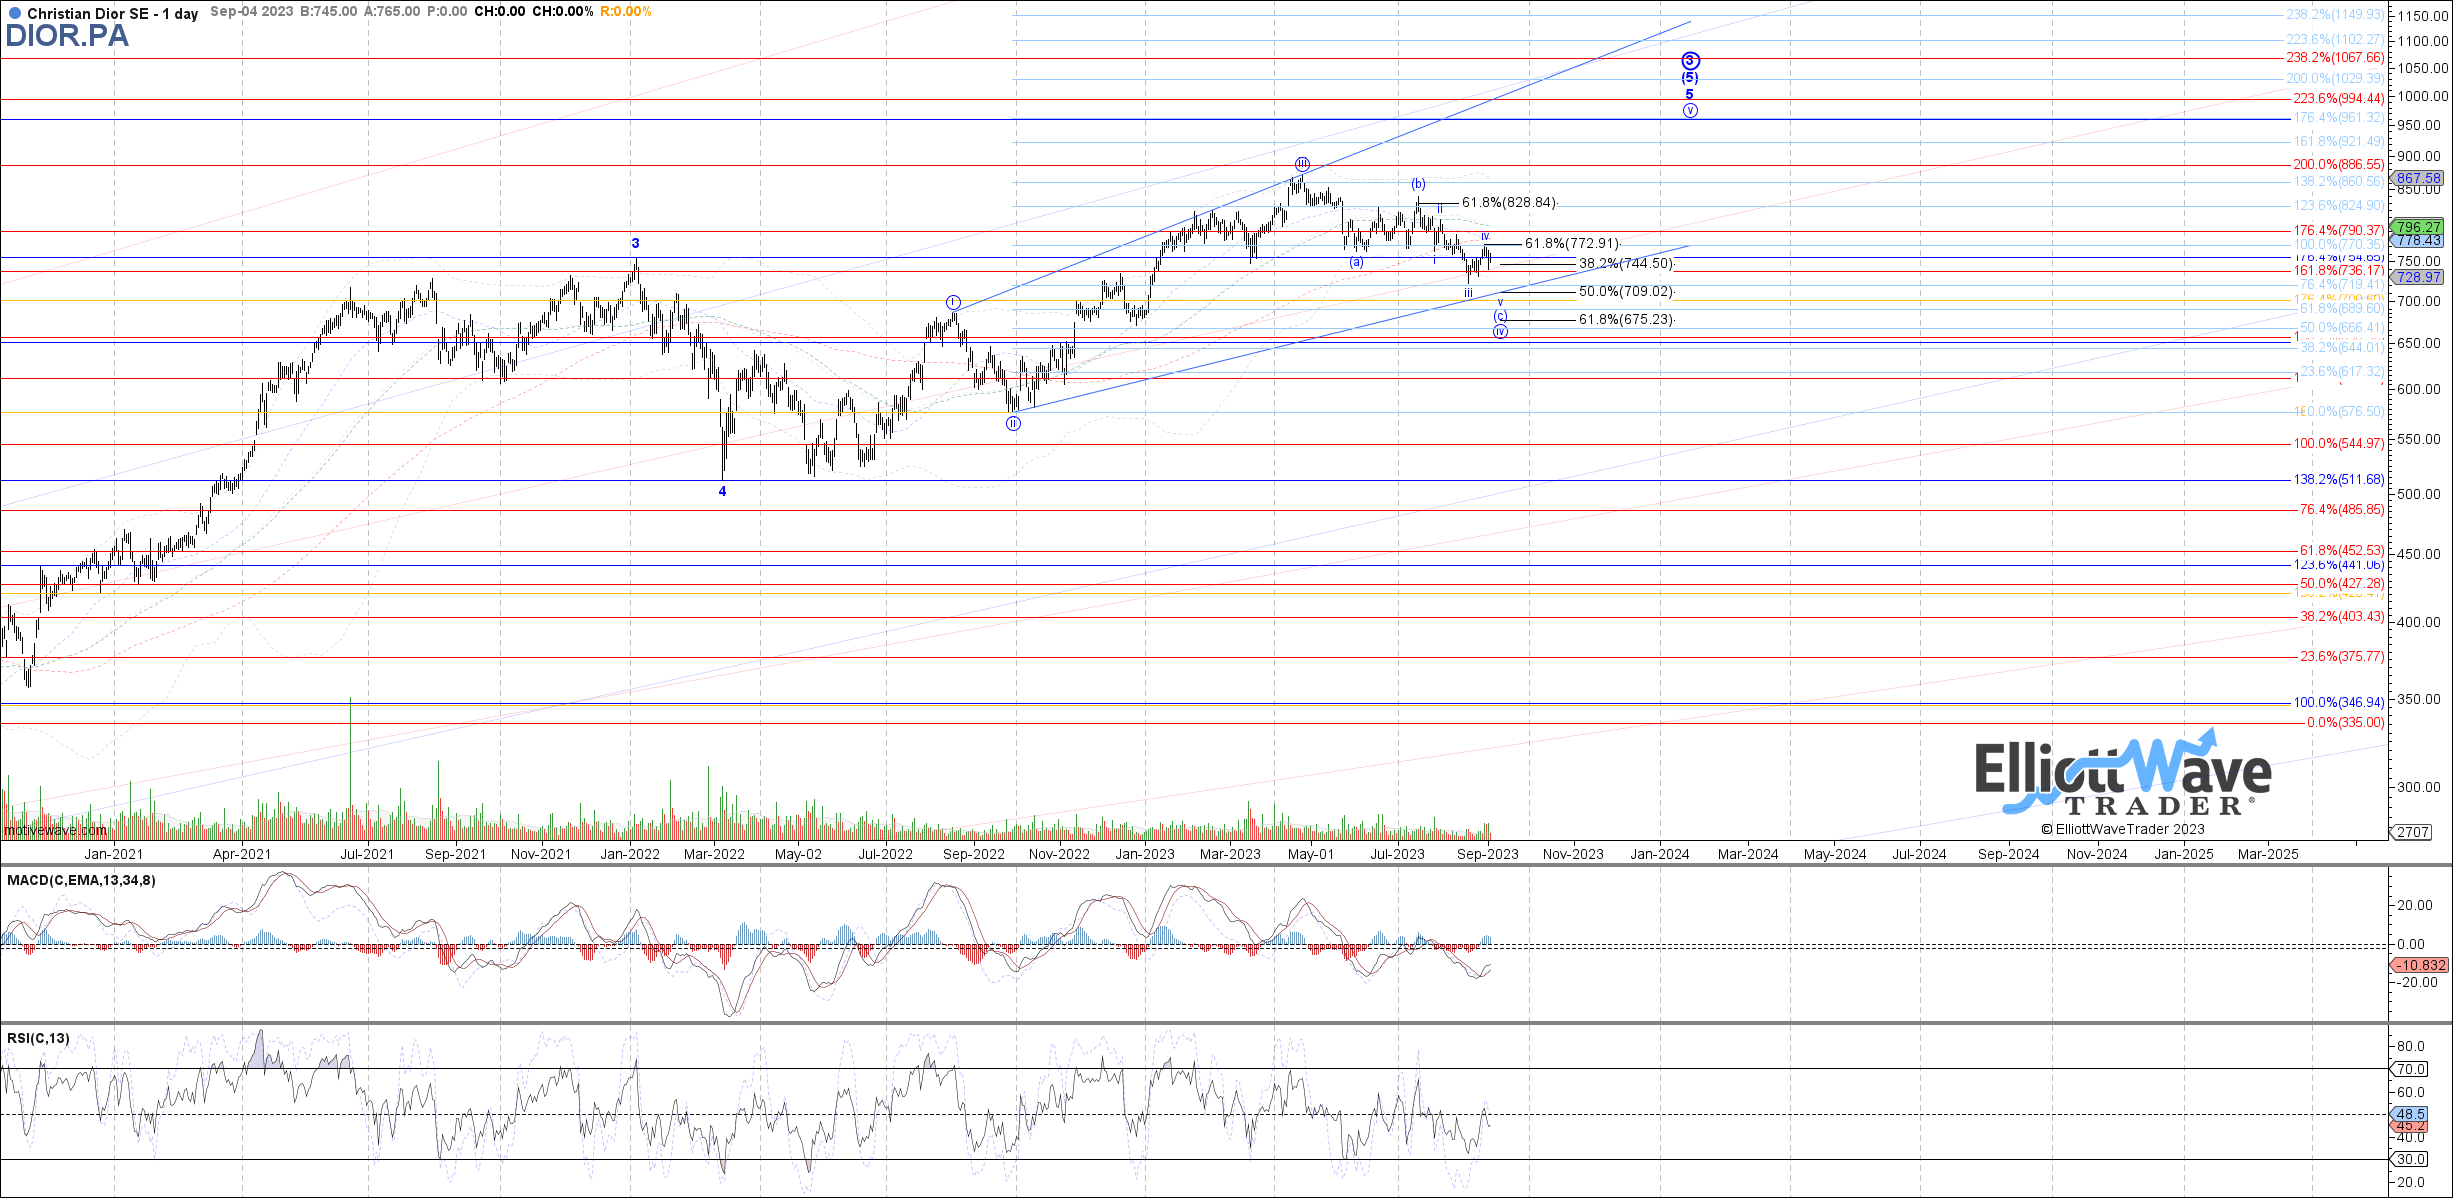
Garrett has been watching the LVMH chart with keen interest as of late (we are sharing the DIOR chart as well, but remember the crossover between the two tickers mentioned above).
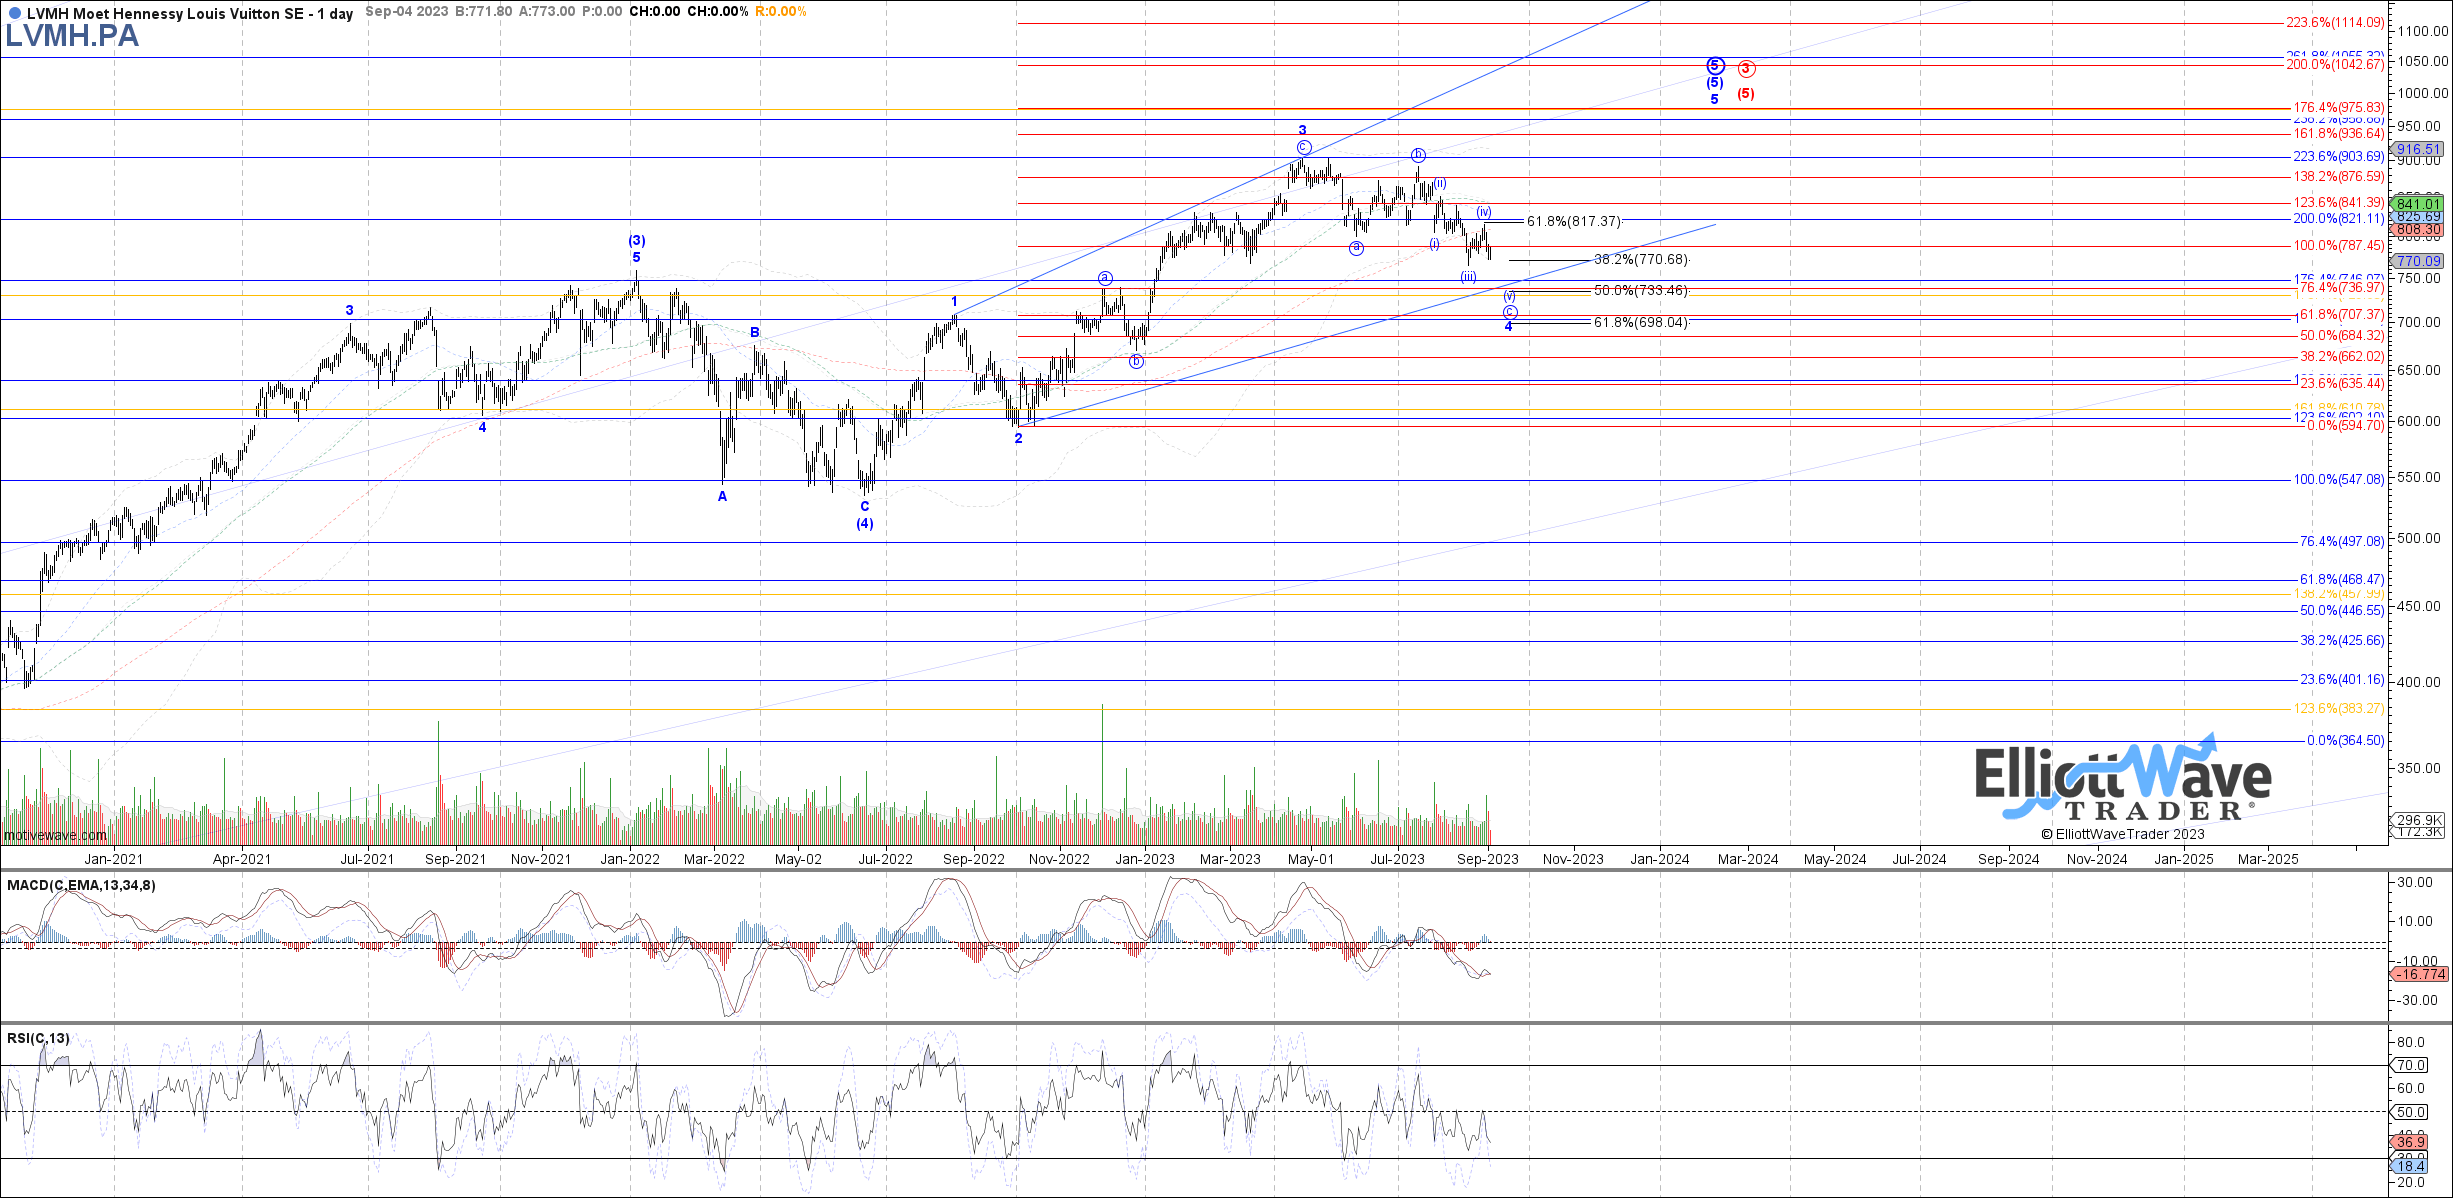
Let's focus on the LVMH chart. Both the Blue and Red paths point higher over the next several months. The difference will be the depth of the correction, if/when the next peak in price is struck as illustrated.
For now, we can focus on the near-term completion of what is labeled as wave [v] of the circle 'c' of wave 4. That is nearing fruition shortly or perhaps has even finished the corrective move with today's low. If so, then price should reverse from this area and then break above the 820 area. We are looking for the 975 zone overhead to complete a much larger rally structure.
Risk : should price move below 660 first before forming this higher high anticipated, then we would reassess the bullish setup as presented.
In the bigger picture, this next high should be significant. Why do we make that affirmation? It's a matter of degrees.
Degrees But Not Temperature
Perhaps another way to describe the use of degree in this context is to compare it with scale. The markets display self-similarity of structure at all degrees or scales of time. This is the fractal nature of the markets. These structures, or patterns, repeat at all scales, or degrees, and therefore can provide us with predictability.
This is the power of Elliott Wave theory, when correctly applied. Let's simply discuss this using the Blue path illustrated on the above chart for LVMH.
Note at the next anticipated high there is a stack of 3 numbers. What is this? It is the confluence of degrees, the one above greater than the prior, and it tells us that the next high will be of even more importance than the prior high. Why? Because it will be at a higher degree.
This will be the confluence of 5 waves up from the low struck at wave [4] in June 2022. This wave [5] rally up is formed in 5 waves. But the larger structure is also 5 waves. What's more, it's part of an even bigger 5 wave structure. Now, don't let this blow your mind. Fractals are all around us in mathematics and even nature.
Avi Gilburt has discussed this in depth across many articles presented here for the readership. Here is a brief excerpt from one of those pieces that discusses the theory:
"Elliott Wave theory understands that public sentiment and mass psychology moves in 5 waves within a primary trend, and 3 waves in a counter-trend. Once a 5 wave move in public sentiment is completed, then it is time for the subconscious sentiment of the public to shift in the opposite direction, which is simply a natural cause of events in the human psyche, and not the operative effect from some form of 'news.'
In fact, the former Chairman of the Federal Reserve, Alan Greenspan, understood this fact well. During his tenure, in several hearings in front of the Joint Economic Committee, Mr. Greenspan noted that the idea that the Fed can prevent recessions is a "puzzling notion" . . . Rather, the stock market is "driven by human psychology" and "waves of optimism and pessimism."
This concept is inherent in the aggregate actions of individuals. Based upon these concepts, it is clear that man's progress and regression does not take the form of a straight line, nor does it occur randomly in nature. Rather, it progresses in 3 steps forward, with two steps back within the primary trend.
This is the basis of the Elliott Wave theory. This mass form of progress and regression seems to be hard-wired deep within the psyche all living creatures, and that is what we have come to know today as the "herding principle", which is what gives the Elliott Wave theory its ultimate power.
This theory has been proven time and time again throughout history. This is the basis behind the Elliott Wave, which is enhanced through the concept of Phi; the Golden Ratio. These concepts have been understood by Plato, Pythagoras, Bernoulli, DaVinci and Newton. Historic structures have been built by architects of famous Greek structures, such as the Parthenon, and even as far back as the architects of the Great Pyramid of Giza in Egypt, who recorded their knowledge of Phi as the building block for all man nearly 5,000 years ago.
For a more detailed understanding of this concept and application, I highly suggest reading the Elliott Wave Principle, by Frost & Prechter."
Conclusion
There are many ways to analyze and track stocks and the market they form. Some are more consistent than others. For us, this method has proved the most reliable and keeps us on the right side of the trade much more often than not. Nothing is perfect in this world, but for those looking to open their eyes to a new universe of trading and investing, why not consider studying this further? It may just be one of the most illuminating projects you undertake.
(Housekeeping Matters)
If you would like notifications as to when our new articles are published, please hit the button at the bottom of the page to "Follow" us.
For further details see:
LVMH/Christian Dior: All Things Luxury Showing A Buy Setup