QQQ - Market Chartstorm: VTI Losing Momentum After A Stellar Run Downgrading To Hold
2024-01-13 22:29:10 ET
Summary
- The S&P 500 and Vanguard Total Stock Market Index Fund have both performed well, but VTI has not reached a new all-time high.
- VTI's valuation is high, and there are mixed momentum signals and uncertain seasonal trends.
- The US economy is still growing, but there are concerns about the labor market and future GDP growth.
- I outline key price levels to watch on the VTI chart along with running through key macro charts to monitor as 2024 unfolds.
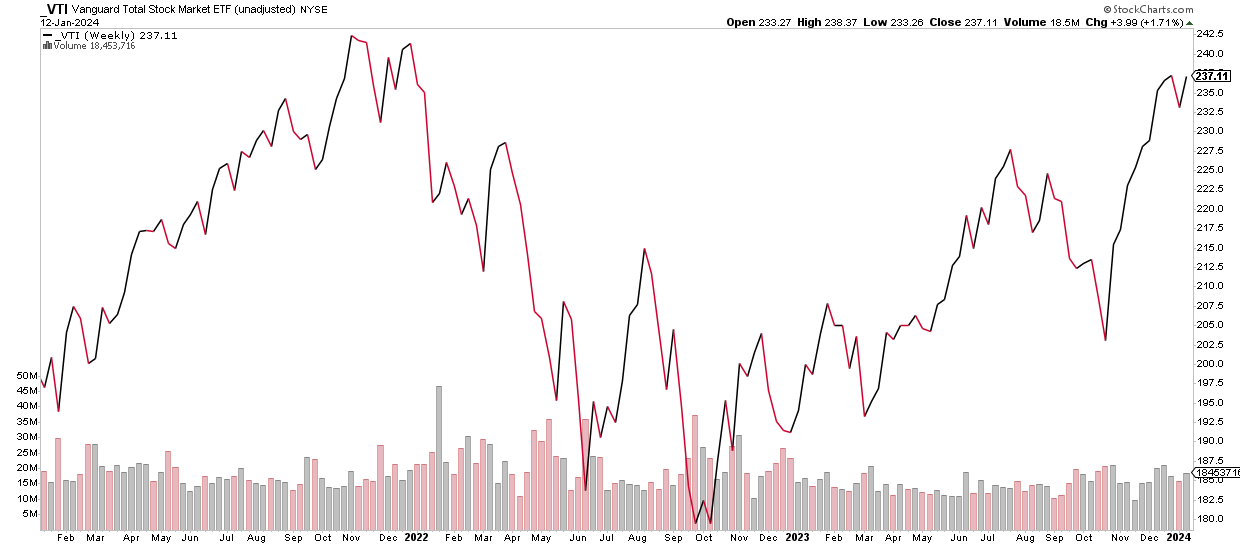
The S&P 500 is up 10 of the last 11 weeks. The Vanguard Total Stock Market Index Fund ETF Shares (NYSEARCA:VTI) can say the same, though the ETF failed to settle at a fresh all-time weekly high close, whereas the SPX did. VTI’s significant weight in domestic mid-cap stocks, with a splice of small caps, generally hurt relative performance to the large-cap index over the past three-plus years. US SMID caps peaked in Q4 2021 and have retraced only about half of their late 2021 to October 2022 bear market.
I am downgrading VTI from a buy to a hold based on higher valuations, mixed momentum signals, and sketchy seasonal trends that often ensue during the first half of election years. For background, VTI seeks to track the performance of the CRSP US Total Market Index. The fund holds large-, mid-, and small-cap equities diversified across growth and value styles and employs a passively managed, index-sampling strategy, according to Vanguard .
VTI: Up 10 of the last 11 Weeks
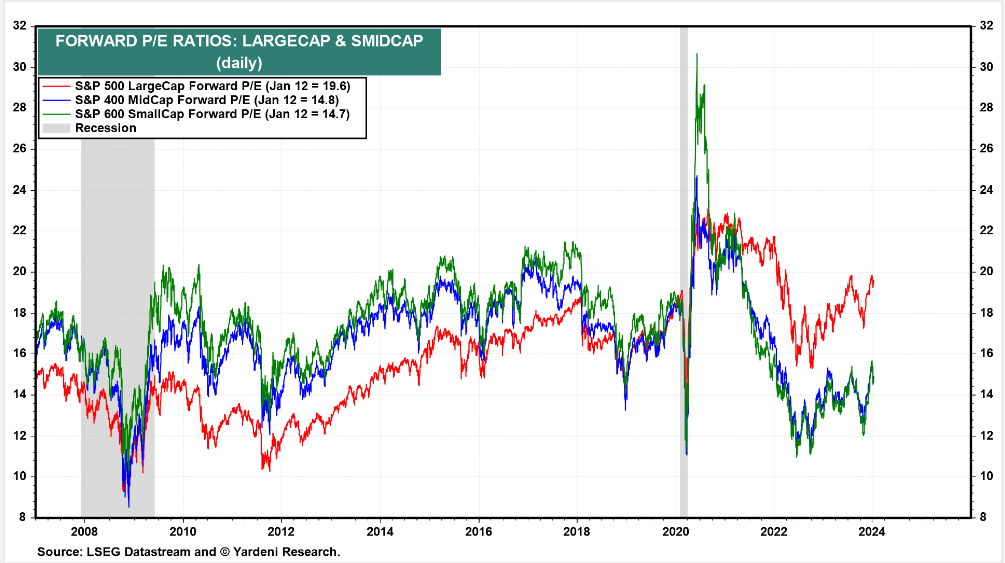
As it stands, VTI trades at a lofty forward non-GAAP price-to-earnings ratio close to 19. That elevated valuation multiple is not extreme, though. Consider that the high-growth and relatively defensive Information Technology sector comprises more than 27% of the allocation.
I.T. stocks naturally command a higher valuation, so large caps’ 19.6 P/E, per Yardeni Research, is reasonable while about a 15 multiple on SMIDs may be fair based on their lower quality and more cyclical nature. In other words, stocks are priced maybe not to perfection, but they have certainly baked in a Goldilocks economic outcome.
US Stock Market Valuations by Market Cap: P/Es off the Lows
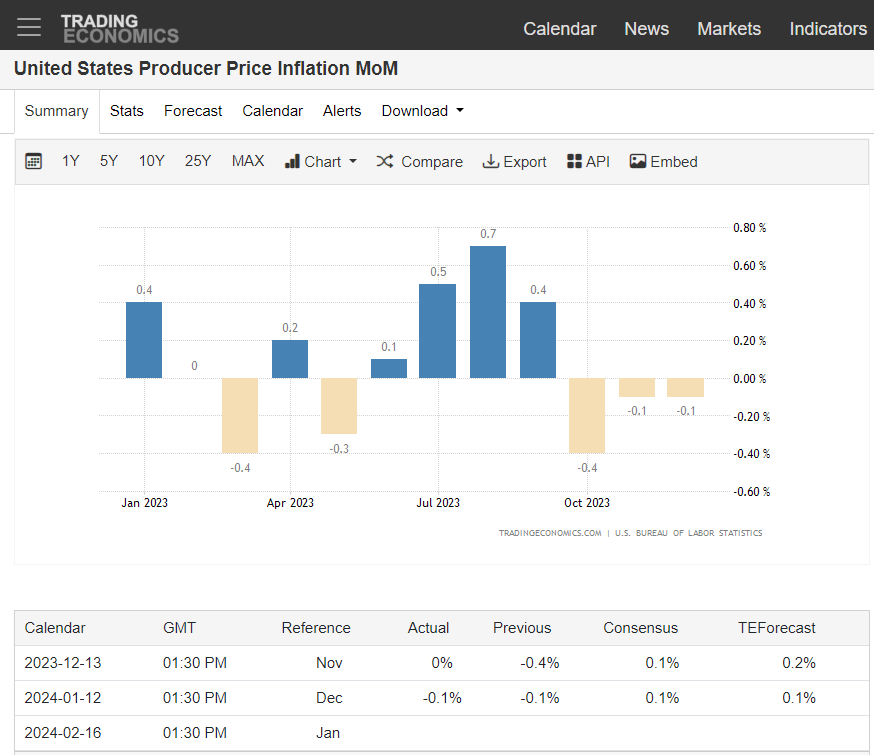
Consider that Core PCE is now under the Fed’s 2% target on a six-month annualized basis (Core PCE inflation is the Fed’s preferred inflation gauge). Last week, while CPI numbers came in on the warm side, PPI confirmed that wholesale prices continue to actually deflate, dropping another 0.1 percentage point in December.
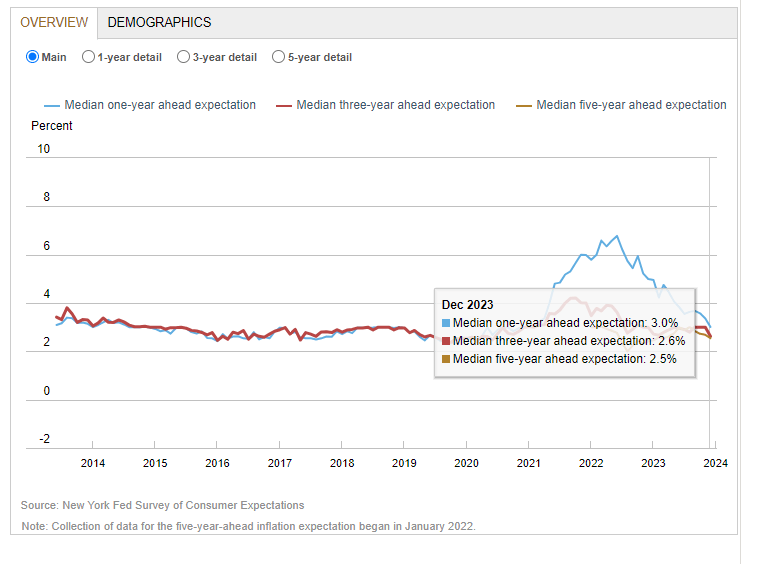
The inflation landscape was cast in a better light early last week, too. The New York Fed Survey of Consumer Expectations revealed that Americans are more sanguine about future inflation levels – short-term inflation expectations dropped to their lowest level in three years.
US PPI Declines for a Third Straight Month
NY Fed Survey: Lowered Consumer Inflation Expectations
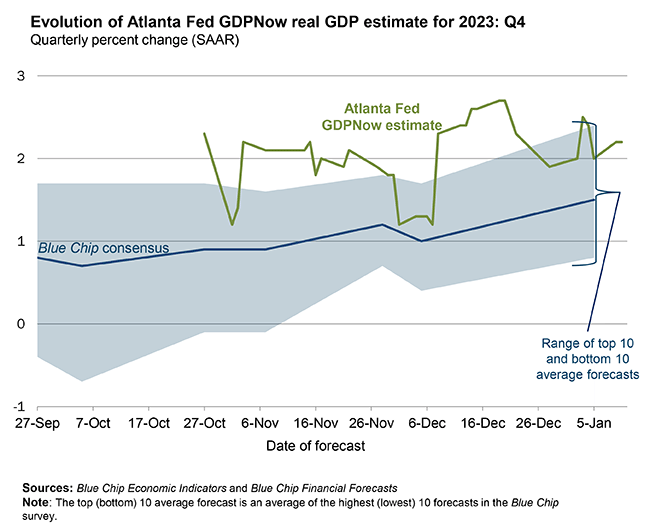
On the growth side of the ledger, the Atlanta Fed’s GDPNow tool shows the US economy humming along at a decent 2.2% real rate for Q4. While that is down from the stellar expansion pace seen in Q3 last year, there’s certainly little evidence of a hard landing or even any stretch of negative real GDP growth in the offing.
Q4 US Real GDP Growth Seen at +2.2%
Economists currently expect the US real GDP growth rate to trough in Q1 and Q2 this year, sidestepping a technical recession, before a re-acceleration takes place in the second half of 2024. Much will depend on how the jobs situation unfolds as well as what retail sales look like following a holiday shopping season that was good, not great. Also, the Q4 2023 corporate earnings season will shed light on the health of companies big and small.
Consensus US Real GDP Forecast
Goldman Sachs
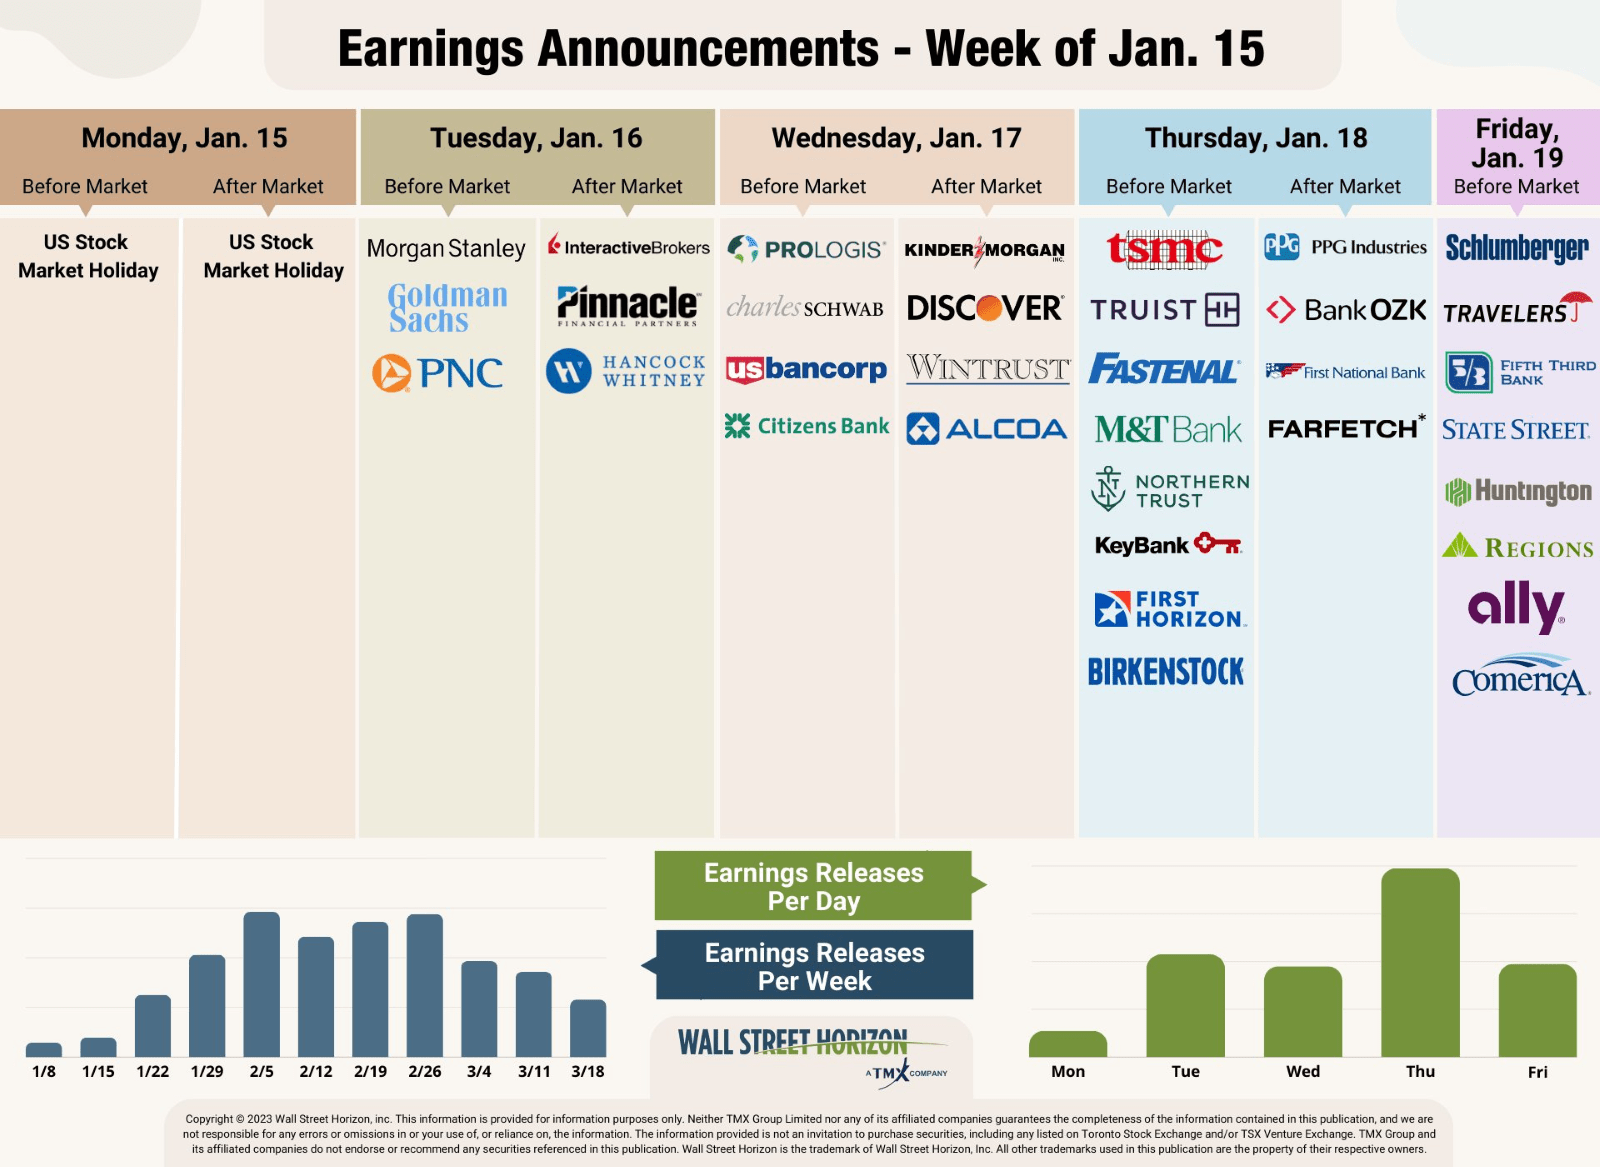
According to FactSet , for Q4 2023 (with 6% of S&P 500 companies reporting actual results), 76% of S&P 500 companies have reported a positive EPS surprise and 55% of S&P 500 companies have reported a positive revenue surprise, but the blended (year-over-year) earnings decline for the S&P 500 is -0.1% after a rebound in EPS growth reported in Q3. Still, strategists expect per-share profit growth to have continued last quarter, and we will know a lot more in the next three weeks as the bulk of SPX earnings hit the tape.
Earnings on Tap This Week
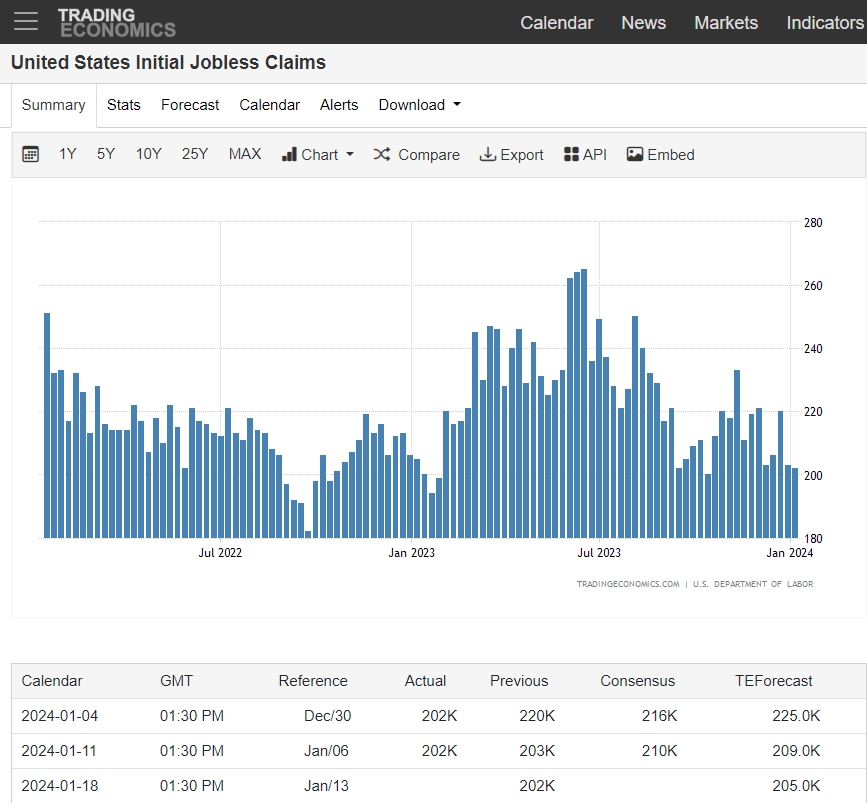
I mentioned the labor market earlier. Employment growth has certainly ebbed over the last few quarters, but Initial Jobless Claims remain exceptionally low by historical standards, and monthly gains in the NFP establishment payrolls report suggest hiring is still going on.
What’s more, wage growth has steadied at a decent 4% clip on a year-over-year basis. Negative revisions to the headline jobs print and volatility in the household survey, used to calculate the unemployment rate, are things the bears point to. Also concerning was a surprise downtick in the ISM Services Employment sub-index for the month of December.
Sanguine Jobless Claims Numbers
As for VTI and the broad US stock market, I expect bouts of volatility here and there throughout the first half of 2024. With the Iowa Caucuses taking place on Monday, a market holiday, we are now in the heart of primary election season.
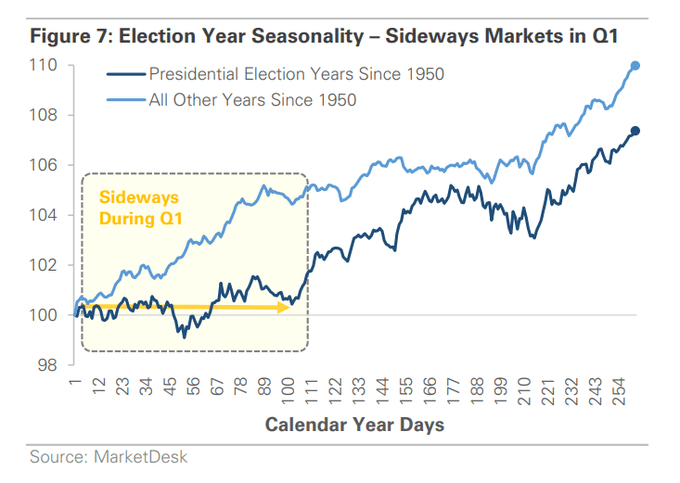
Betting markets suggest a high probability of a Trump versus Biden rematch being in the cards, so perhaps equities will not be rattled quite as much as they otherwise would be by extreme policy ideas as candidates seek to appeal to their respective bases. Nevertheless, stocks often stumble at the state of election years, according to data put together by MarketDesk.
Choppy Price Action into Q2 of Election Years
The Technical Take
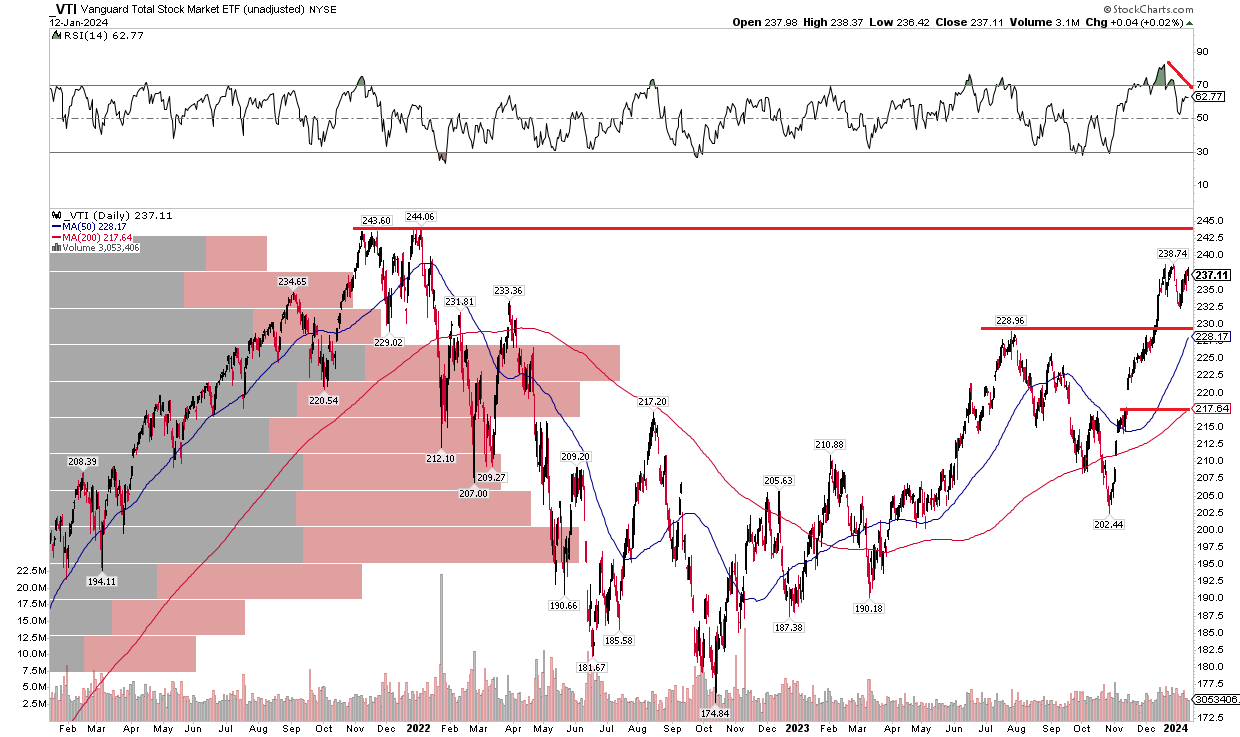
As we form a narrative about VTI for the next few months, let’s look at its momentum situation. Notice in the chart below that the fund, unlike the S&P 500, has not peeked above its early 2022 all-time high. If we see VTI rise above $245 on a weekly closing basis, maybe we can get more constructive, but I see the risk of a trading range emerging on a near-term basis. Support is seen at the $229 mark – that was the high from July last year and it is also where the rising 50-day moving average comes into play. I see next support further down at $218 – there's a significant price gap there along with the rising 200-day moving average offering technical confluence.
Also take a look at the RSI momentum gauge at the top of the graph – while not a technical bearish divergence, VTI’s RSI was at a much weaker level to close last week while the S&P 500 settled at a fresh all-time weekly high close. I would like to see a price thrust confirmed by robust momentum, as well as with increased volume. For now, $244 appears to be resistance while $229 is near-term support.
VTI: Remains Below the All-Time High, Support at the Summer 2023 Peak
The Bottom Line
I am downgrading VTI from a buy to a hold. I was bullish on the US stock market heading into the final two months of the year given seasonal tailwinds and extreme bearishness in October. Now, though, momentum has waned and a more volatile seasonal stretch is underway. VTI’s valuation is not all that cheap, either, while macroeconomic conditions are mixed as real GDP growth slows.
For further details see:
Market Chartstorm: VTI Losing Momentum After A Stellar Run, Downgrading To Hold