FEX - Market Trends: Large Cap Equity
Summary
- US Large Cap stocks are still in a short-term downtrend but the long-term uptrend is intact.
- International Large Cap stocks are in a short-term uptrend versus US Large Cap. The trend has been driven by the falling dollar.
- US Large Cap value is in a short-term uptrend versus growth.
- International Large Cap value is in a short-term uptrend versus growth.
- The long-term trends favoring growth and the US over international are still intact.
I am a visual person so I use charts to see the trends in markets. Tactical changes to your portfolio are difficult because there is so much noise out there, it is hard to know what you should act on and what you should ignore. Charts make the job easier by eliminating the noise. Follow the trends. Own things that are going up and avoid the things that are going down. (I know that sounds trite but simplicity works in many areas of life and investing is no different.) And watch for extremes where reversals, the end of trends, are likely to occur.
Let’s take a look at the trends in Large Capitalization Equity. We are global investors, so we’ll look at international too, but the US is the biggest economy and market in the world, so that’s where we’ll start.
First of all, let’s define Large Capitalization Equity. The common definition of large, mid and small cap is:
Large Cap = >$10 billion
Mid Cap = $2 – $10 Billion
Small Cap = $200 Million – $2 Billion
That may be the “official” definition but the indexes themselves show more range. The market cap of the companies in the S&P 500, the best known large cap index, range from $5.2 billion (Lincoln National ( LNC )) to $2.1 trillion (Apple ( AAPL )). The S&P 400 (Mid Cap) ranges from $1.75 billion (Pebblebrook Hotel Trust ( PEB )) to $14.5 billion (Fair Isaac ( FICO )). The S&P 600 ranges from $155 million (Bed Bath & Beyond ( BBBY )) to $6.3 billion (Agree Realty ( ADC )). There are other indexes for each market cap as well such as the Russell 1000 for large cap or the Russell 2000 for small cap.
Today, I’ll focus on large cap stocks, both domestic and international. For each index, we’ll look at several time frames, but we focus on an intermediate term time frame which we put at about 3 years. Long term is a decade or more while short term is a year or less. Most of the charts I’ll show here will be weekly charts, where each bar represents one trading week.
S&P 500
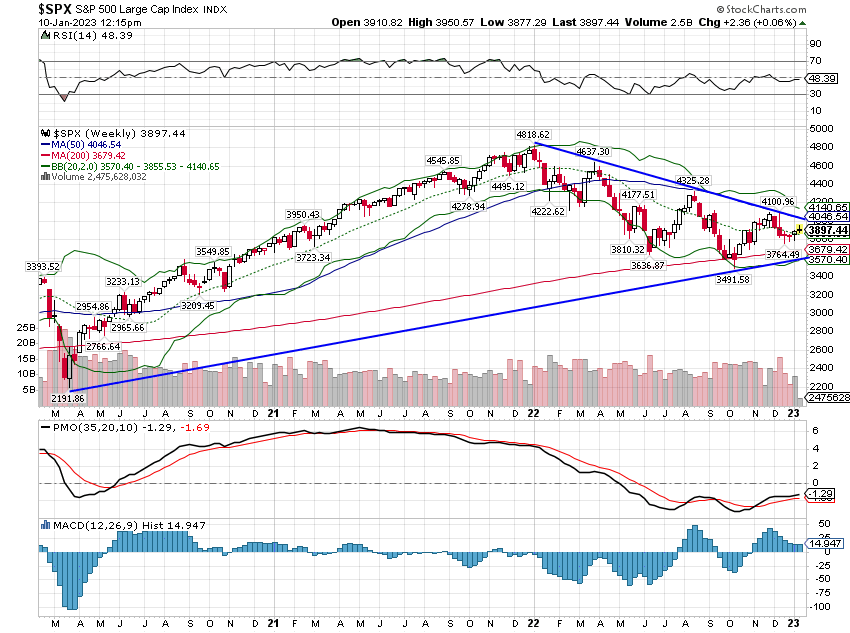
I’ve drawn in some trend lines but don’t take them as any kind of formal technical analysis. We’re just looking at general trends. In this case, for the S&P 500, the short-term trend is obviously down while the intermediate-term trend is up but fairly weak. Total returns over the last 6 months, 1 year and 3 years are 0.68%, -15.4% and 24.8% respectively.
The long-term trend is also pretty obvious. The 10-year return is 223.1%. By the way, this is a log scale chart, which is how you should view these very long-term charts. One other thing to notice here is that returns from stocks are pretty lumpy. You go through fairly long periods – or at least they seem long when you are going through them – where you just don’t make much. The last two years the S&P 500 is up just 4.9% total. From March 2018 to March 2020, the index was up 1.9%. From June 2014 to February 2016, it rose just 4.2%. The gains tend to be concentrated and persistent; the uptrends rarely give you a significant dip to buy. If you have long-term goals, you probably need to use the flat to down periods to accumulate. The peak in late 2021 was an obvious place to raise cash as the index was well above the long-term trend, but that was an exception. You don’t often see indexes that far above the long-term trend.
StockCharts
EAFE
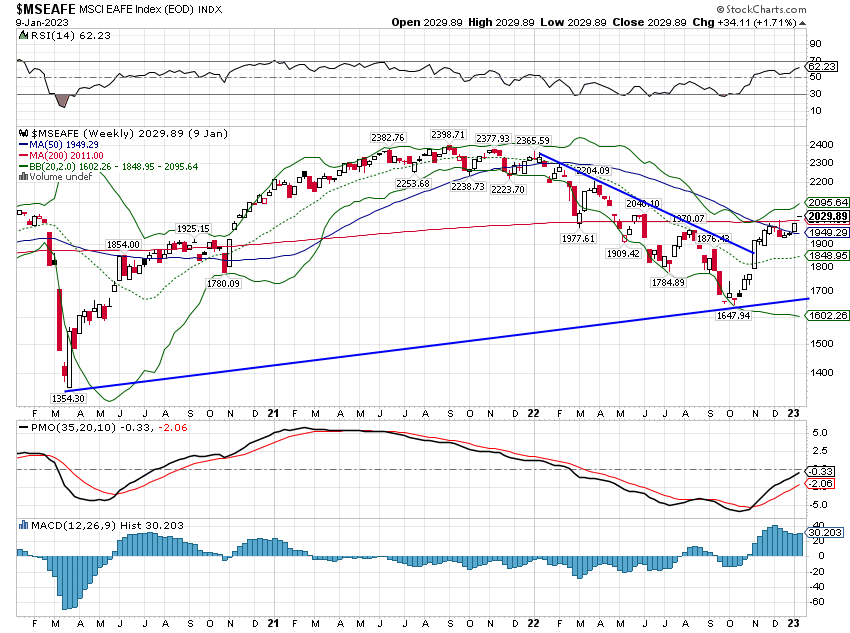
Next, let’s take a look at an international, non-US, large cap index, the EAFE (Europe, Australasia, Far East). It has 796 constituents that range from $1.4 billion to $318.5 billion in market cap. Contrary to the S&P 500, I’d put the EAFE short-term trend at neutral; it has already broken from its previous short-term downtrend. The intermediate-term trend is up but, like the S&P, fairly weak. 6-month, 1-year and 3-year returns are 11.0%, -9.9% and 8.73% respectively.
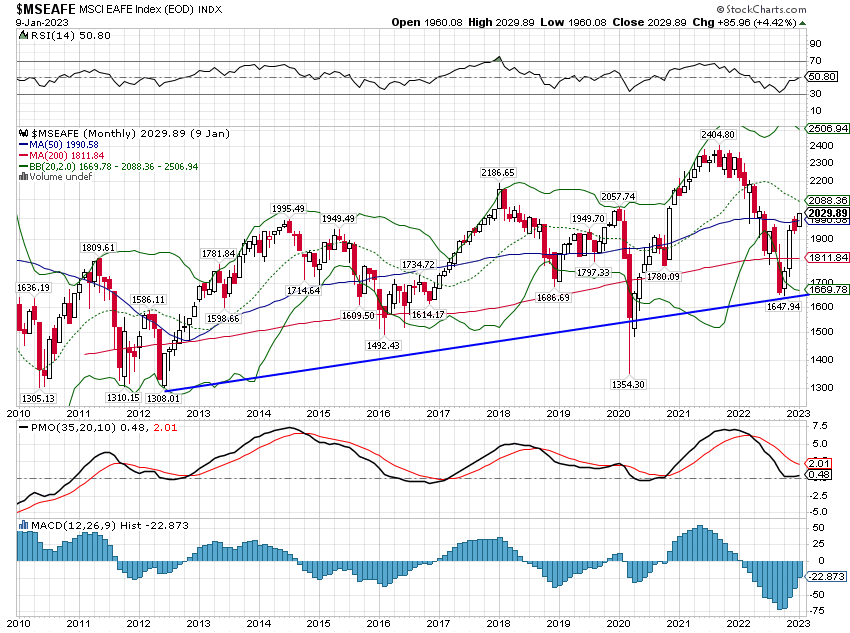
The long-term trend is up but international stocks have vastly underperformed US stocks over the last decade. That is not surprising in a strong dollar environment. The 10-year return for the index is 69.9%.
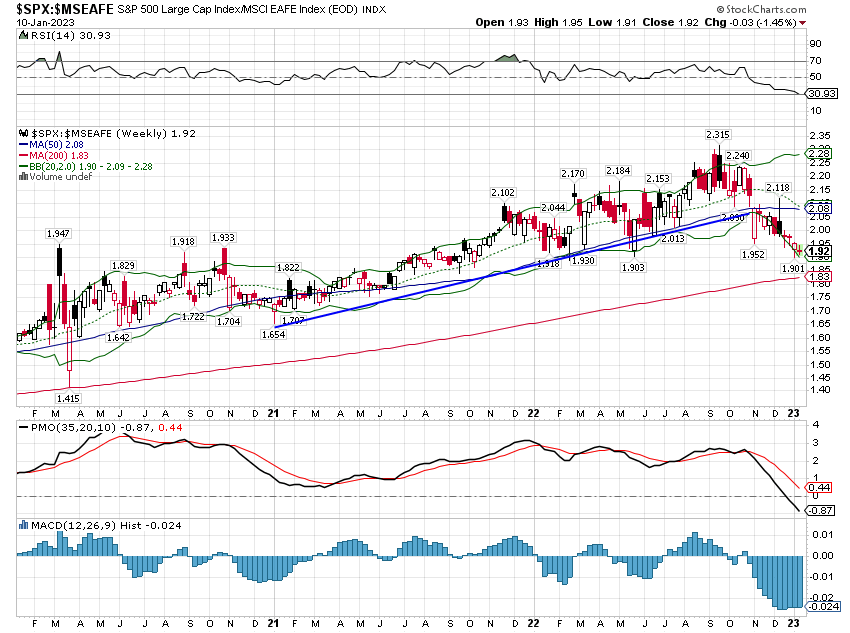
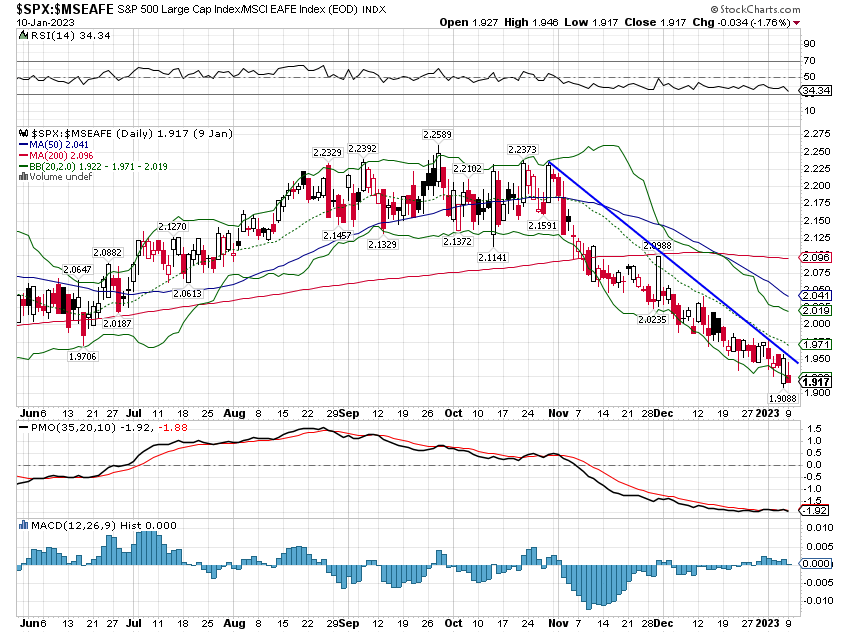
Next, let’s look at the S&P 500 relative to the EAFE. For these comparisons, we use ratio charts. This shows the ratio of the S&P 500 to the EAFE index. When it is rising, the S&P 500 is outperforming. And that is what we see for the intermediate time frame.
You’ll notice though that in the short term the smooth uptrend has been interrupted. The ratio peaked in September. Why? Because that’s when the dollar peaked. Currency changes have a big impact on non-dollar denominated stock markets.
You can see the short-term trend better on a shorter term chart and it is obviously down (EAFE outperforming).
The long-term trend is obvious with the S&P 500 in a steady uptrend. For this trend to break, the dollar almost certainly has to go lower. Absent that, I would expect the long-term trend to reassert itself soon. And remember that a rising ratio does not mean the S&P 500 is rising, just that it is outperforming the EAFE.
StockCharts
Value & Growth
As almost everyone knows, value has been outperforming during this bear market; the short-term trend is up. But the intermediate-term trend is neutral. 6-month, 1-year and 3-year returns for [[IVE]] and [[IVW]] are (9.6% vs -6.7%), (-2.6% vs -25.8%) and (24.1% vs 21.7%).
StockCharts
The long-term chart though reveals that the rally in value has only brought it back up to the old downtrend line that prevailed prior to the big surge in growth at the onset of COVID. Value/Growth trends tend to persist for a long time and growth has been winning since 2007 so value is certainly due, but it is far from a sure thing. I would also point out that the current makeup of the S&P 500 value index is not particularly cheap except in comparison to the growth index. The index trades for 15.6 times next year’s earnings estimate (from Morningstar) and 1.57 times sales. That is not cheap for a value portfolio where you routinely find single-digit P/Es. There are cheaper versions of large cap value such as the MSCI USA Value Factor ( VLUE ) which trades for 9.8 times earnings and .86 times sales but it hasn’t performed as well (6-month, 1-year and 3-year of 4.9%, -13.4% and 15.5%). We have chosen to use an actively managed fund in our portfolios that is cheaper than the S&P 500 Value and has outperformed the MSCI Value Factor over the last 6 months and 1 year and both indexes over the last 3 years. It’s a tradeoff.
StockCharts
We see a similar dynamic in EAFE Value ( EFV ) vs EAFE Growth ( EFG ), but the difference is not as extreme as the S&P. Like the US version, the short-term trend is up (Value outperforming) and the intermediate-term trend is neutral. The returns for EAFE Value and Growth over 6 months, 1 year and 3 years are 12.6% vs. 8.4%, -4.3% vs. -15.5% and 6.6% vs. 5.1%. The short-term returns are better for international due to the recent drop in the dollar.
StockCharts
The long-term trend favors growth but the difference isn’t as stark as for the US indexes.
StockCharts
Now let’s compare EAFE Value vs. S&P 500 Value. As expected, it shows EAFE outperforming over the very short term and S&P outperforming over the intermediate and long term.
StockCharts StockCharts
Key takeaways:
- US Large Cap stocks are still in a short term downtrend but the long term uptrend is intact.
- International Large Cap stocks (EAFE) have broken their short-term downtrend. Intermediate and long term trends are higher but the long-term returns have not been attractive.
- International Large Cap stocks are in a short-term uptrend versus US LC. The trend has been driven by the falling dollar.
- The long-term trend still favors the US over International. Changing that trend will likely require a sustained downtrend in the dollar.
- US Large Cap value is in a short-term uptrend versus growth. The intermediate-term trend is neutral and the long-term trend still favors growth over value.
- International Large Cap value is in a short-term uptrend versus growth but the intermediate trend is neutral while the long-term trend still favors growth.
- International value has outperformed US over the very short term but the longer term trends continue to favor the US.
Value investing has been getting a lot of good press lately because it has outperformed recently. That is also true of international stocks. But I think investors should be careful about extrapolating short-term performance. The long-term trends favoring growth and the US over international are still intact. US growth stock valuations have come down a lot and so aren’t nearly as expensive as they were at the beginning of last year. The difference in valuation between value and growth has shrunk but the real message here is that stocks are still not cheap. US and international growth stocks are expensive relative to their expected growth. US Value stocks are as well. International value stocks do seem to be fairly, if not cheaply, valued.
Author
Value and international are both outperforming right now and you have to stay with those short-term trends to see if they become intermediate or long term trends. But investors should keep in mind that stocks are not all that cheap. US value stocks, if measured via the S&P 500 value index, are not cheap at all considering their expected growth of revenue and earnings. We continue to favor purchasing the individual equity of high quality issuers over the index approach. Globally, there are plenty of good companies trading at cheap multiples and you don’t have to buy the expensive ones.
Don’t get hung up on the growth and value labels. Well-run growth companies command higher multiples but you can still find them trading at P/Es less than their growth rate. Value companies can be tougher because really cheap stocks usually come from companies with problems. But if the problems are solvable, the rewards can be considerable.
Editor's Note: The summary bullets for this article were chosen by Seeking Alpha editors.
For further details see:
Market Trends: Large Cap Equity