CTTZF - Massif Capital Q3 2023 Letter To Investors
2023-10-25 11:40:00 ET
Summary
- Massif Capital employs a long/short equity strategy focused on global opportunities in listed real assets, principally mining, energy, and infrastructure.
- Massif Capital Real Assets strategy returned -4.6% net of fees in Q3 2023, bringing YTD net of fees return to -8.73%.
- Losses in the long book were driven by a fall in the price of Industrial, Material, and Utilities sectors exposure.
- The company remains confident in the long-term demand for oil and gas, despite short-term volatility and concerns about the transition to a low-carbon economy.
Dear Friends and Investors,
The Massif Capital Real Assets strategy returned -4.6% net of fees in the third quarter of 2023, bringing our YTD net of fees to return to -8.73%.
ATTRIBUTION
| Portfolio Contribution (Gross of Fees) |
| 2nd Qrt |
| 3rd Qrt |
| YTD |
| Long |
| (1.16%) |
| (6.92%) |
| (4.22%) |
| Short |
| (0.35%) |
| 2.70% |
| (3.40%) |
| Gross |
| 116.27% |
| 116.20% |
| 116.20% |
| Net |
| 61.97% |
| 66.96% |
| 66.96% |
| Total Return |
| (1.51%) |
| (4.22%) |
| (7.62%) |
| Equity and Options Book (Gross of Fees)* |
| Energy |
| 0.39% |
| 1.40% |
| 1.15% |
| Industrials |
| 1.11% |
| (1.77%) |
| 0.13% |
| Materials |
| (3.06%) |
| (2.16%) |
| (5.52%) |
| Utilities |
| (0.40%) |
| (2.07%) |
| (3.64%) |
| Other |
| 0.45% |
| 0.38% |
| 0.25% |
| Additional Return Data (Gross of Fees)^ |
| Tail Risk Hedge (Only Calculated on a YTD Basis) |
| (1.04%) |
| Options Trading Return |
| 0.23% |
| 1.00% |
| 1.23% |
| Isolated Return on Dividends Paid |
| 0.52% |
| 2.20% |
| 3.27% |
| T-Bill |
| 0.31% |
| 0.31% |
| 1.28% |
| *Data: NAV, Inclusive of Dividends Paid ^Data: Rolling Estimate based on Massif Calculations |
There is no point in sugarcoating it; the third quarter was abysmal, with a net of fees return of -4.6%. The long book sank 6.92% while the short book rose 2.7%. Losses in the long book were driven by a meaningful fall in the price of our Industrial, Material, and Utilities sectors exposure. The only bright spot in the quarter was our Energy sector exposure and the short book. This performance is not up to our standards, and we make no excuses for that. It is not the performance we want, it’s not the performance our investors expect, and every effort is being made to improve performance. Unfortunately, we have run into a nasty buzzsaw primarily driven by variables outside our control.
One reason to invest with Massif Capital is that we have a significant focus and expertise in industries poorly allocated to by most investors: energy, materials, infrastructure, and heavy industry. Within those sectors, we tend to perform well on both an absolute and a relative basis. If we divide our portfolio into Oil and Gas, Utilities, Precious Metals, Industrial/Base Metals, and Industrials and compare our returns to the relevant sector indices, we have outperformed three of the five this year.
Unfortunately, relative performance does not spend, but we think it is essential to highlight and assess as it helps us understand the sources of our continued 2023 struggles. The underperformance comes from our metals and mining, the portfolio’s largest allocation, and underperformance in utilities; we will discuss both issues below. We also see a general downward trend in all five of the buckets we invest in.
This trend prompts us to dig deeper into our returns and assess them from a factor level. When we decompose gross of fees returns into Alpha and Factors, we find that factor exposure explained 113% of the drawdown, and alpha was positive, offsetting the drawdown by 13%. In short, the companies we are invested in continue to perform well, but our market exposure in general has punished us. With a concentrated portfolio in only a handful of industries, we have to expect that this will happen from time to time; it is not an excuse, just a statement of fact. Our short book is supposed to blunt the impact of such events, and it did during the third quarter, but not sufficiently to keep performance in the black.
Given our extensive review of our short performance this year, we do not expect that to change. Running a short book sufficiently sized to blunt 100% of any drawdowns in the long book (essentially a market-neutral portfolio) would be very challenging. We continue to believe our posture towards opportunistically driven short selling remains the right course of action.
SELECT POSITION REVIEW
Utility Exposure (11.8% Gross, 6.3% Net)
Given interest rates’ elevated state, it is perhaps unsurprising that our utility exposure has fared poorly for us this year. We should have hedged the exposure sooner with a Utility ETF short, but we did not do that until the third quarter, after much of the damage was already done. As noted above, our Utility exposure is second only to our materials exposure in terms of negative impact on the portfolio across both the third quarter and the YTD periods. This is primarily driven by our investment in AES , which was down roughly 26% in the third quarter and 47% YTD. Our other utility exposure is up for the year, including our short position, which, as noted, was put on in the third quarter, and it is probably something we should have had on the books for the entire year.
We attribute, for right or wrong, the entirety of the sell-off in AES to the interest rate environment. Chart overlays are always tricky, so one should not read too much into them, but as a quick sense check of the claim, if one inverts the move-in rates for a generic 10-year US government bond and overlay it with AES stock price YTD, you get the following:
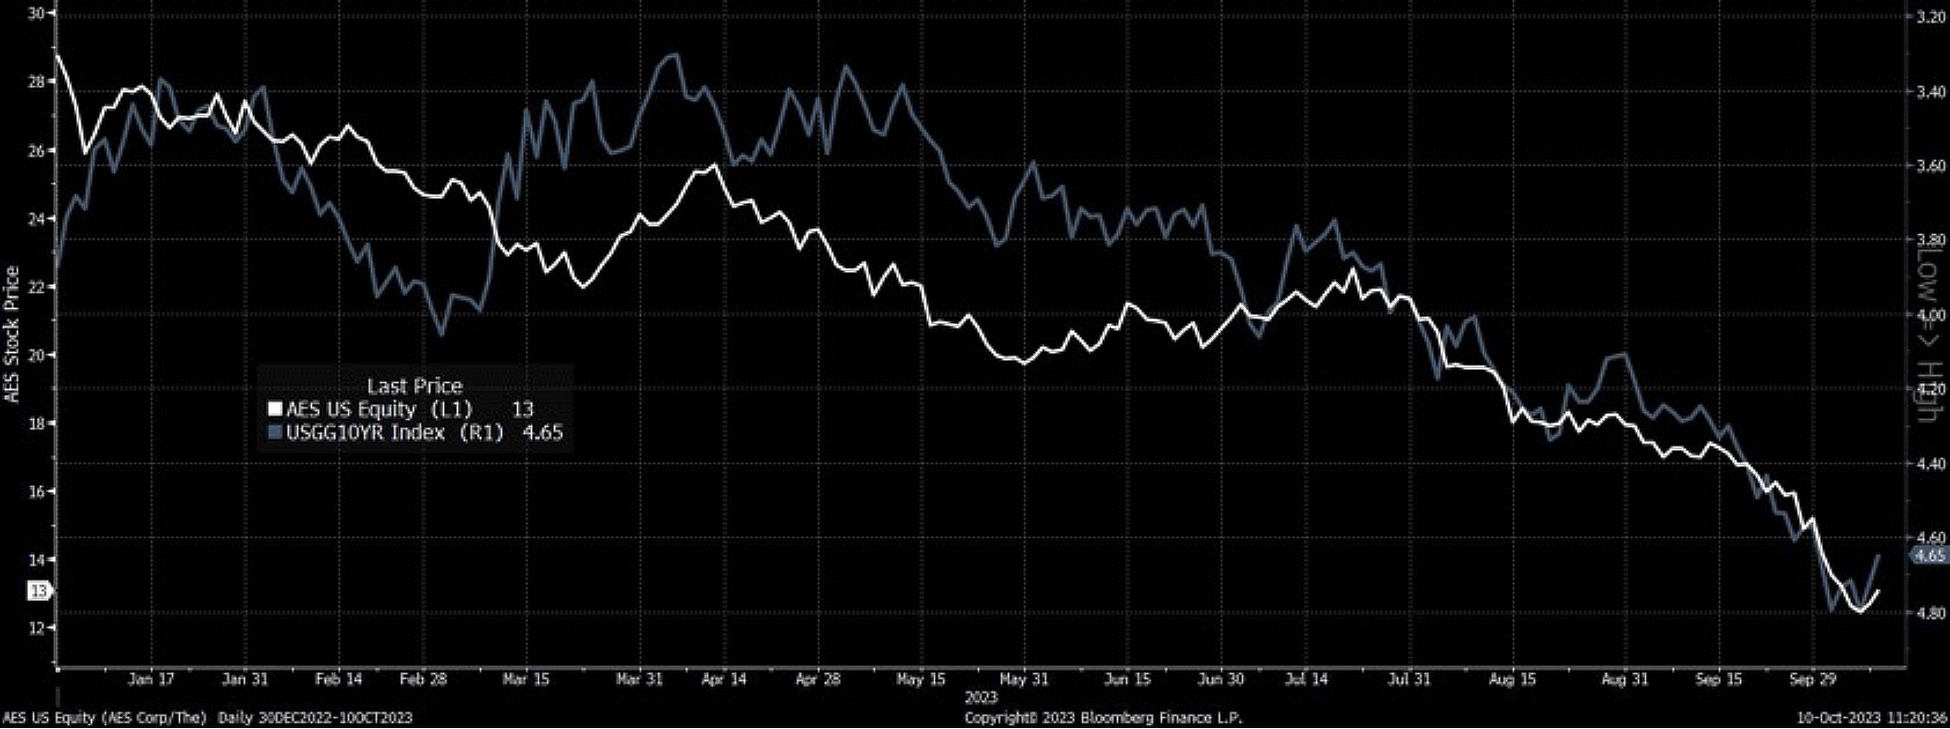
It is not hard to see why we think interest rates are the dominant factor in AES’s abysmal year. The price move has driven the stock’s dividend yield to 5.09% and its P/E to 5.2x. The stock is now trading at a 48% P/E discount to the mean of its North American Utility Peers (46% discount to its five-year historical average, a 2.7 StdDev) and a 23% discount in terms of EV/Rev. If the stock traded at five-year historical multiple levels, it is anywhere from a 40% to 80% move.
If management achieves the lower end of their adjusted EPS target (7% to 9% per annum through 2025), the company will trade at 4.5x 2025 adjusted EPS. The firm’s five-year track record supports modest to strong conviction in management’s ability to hit their target. We are not rushing to average down, but are adding to it slowly over time to take it to 6% from its current ~4%. We continue to believe the stock is worth something in the realm of $30 to $35 per share.
Energy Exposure (19.7% Gross, 12.2% Net)
Hydrocarbon investments (oil, natural gas, LNG, etc.) might be our most profitable investments in the near term, as the strength of the businesses we are invested in and the favorable medium- to long-term environment continues to favor strong prices in underlying commodities. The excellent entry points we established for our investments were primarily spurred by a naïve narrative in which oil is perceived to be in a long-term structural decline. We reject this narrative. While short-term economics may negatively impact oil prices, and medium-term supply issues are generally accepted, the long-term need for oil is poorly appreciated and poorly understood. Just as we suggested in a recent white paper that there would be no net-zero transition by 2050, there is no end in sight for oil demand. This may disappoint some people and worry others, but it is a reality. Absent unforeseeable technological innovations (for example, sudden breakthroughs in fusion), the world we live in today, and we suspect for at least the next 50 years, will be powered by hydrocarbons.
Furthermore, one does not need to tie themselves in knots with complex analysis to understand this simple truth. The best presentation of the argument was recently delivered by Arjuun Murti, a former Goldman Sachs equity analyst on his SubStack Super Spiked. 1 The argument starts with recognizing that despite the ample investment in renewables, batteries, and various energy alternatives, ongoing demand for oil and natural gas remains robust and continues to hit new highs.
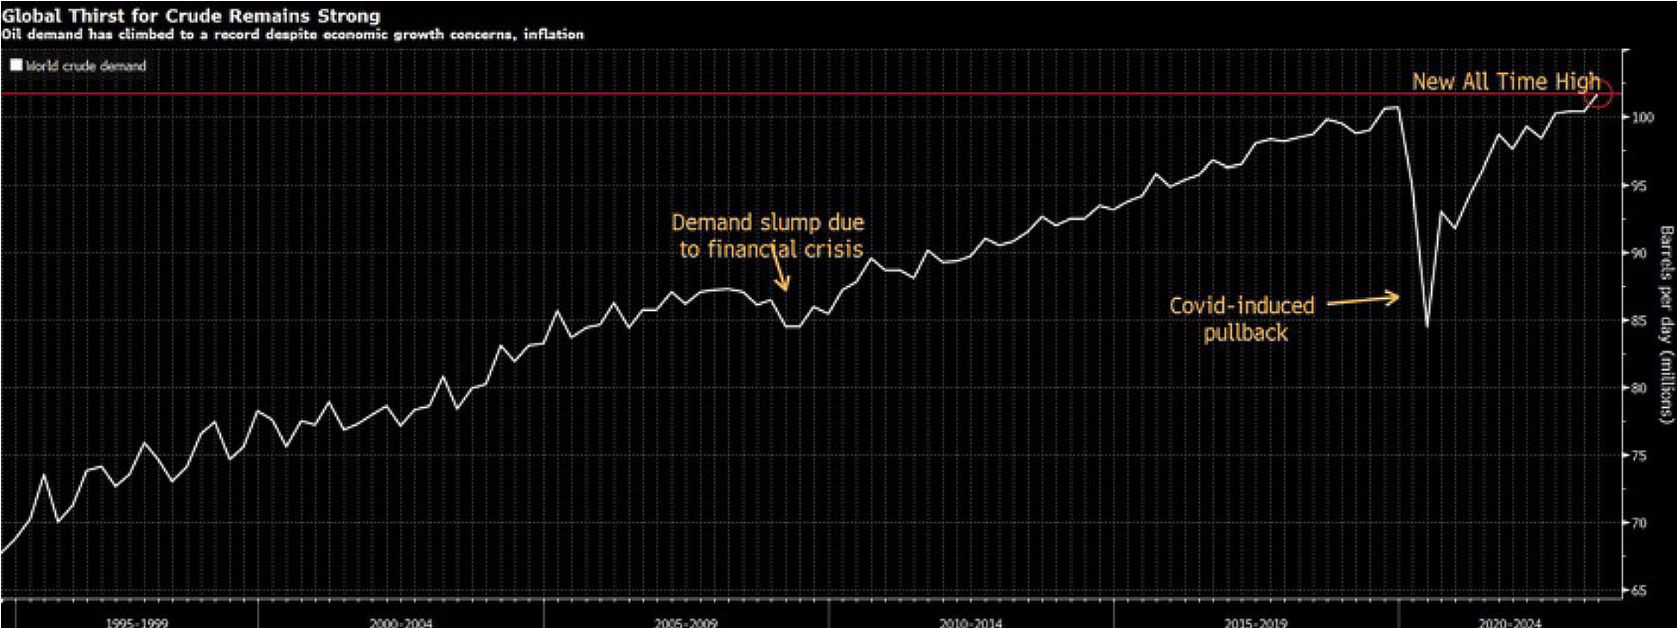
Most importantly, though, these new highs are being set when no major oil-consuming economy is in a robust economic state. If we hit new all-time highs in daily consumption during a slow economy, what will happen in a strong economy, let alone a booming economy?
Taking this line of thinking a step further, what happens when parts of the developing world, such as the global south, begin to demand more oil? Will they leapfrog over the hydrocarbon phase of the development cycle and move directly to a post-hydrocarbon world? That is certainly the argument you must make if you expect oil and natural gas demand to peak by 2030 (as the IEA recently suggested) and start to decline. Unfortunately, that is not such a simple argument to make. After all, oil and natural gas are not like telephones. A country can skip over the landline development phase and go straight to wireless easily. Hydrocarbons (in this case inclusive of coal) currently account for more than 80% of the primary energy supply globally, and renewables, despite their numerous strengths (and they do have them), are not the universal solution to power production that many claim. Just like finding traces of copper in a soil sample does not mean a copper mine can be built where the soil was taken from, the presence of wind and sun does not mean cost-effective and efficient renewables can be built. The argument for ongoing demand growth does not end with robust immediate-term growth.
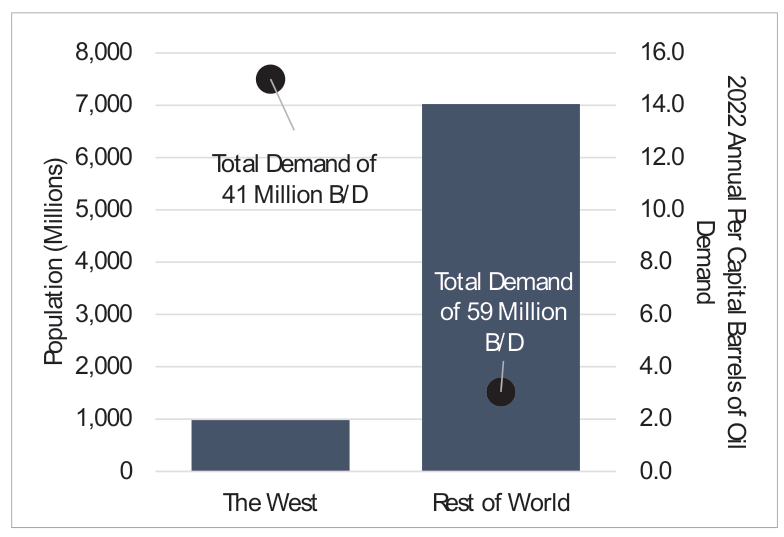
At the current time, with roughly 1 billion people, the developed world (US, Canada, EU, Japan, Australia, and New Zealand) has an annual per capita consumption of 15 barrels of oil. The developing world (everyone else) has a population of roughly 7 billion, with a per capita annual consumption of 3 barrels. Demand from the developed world has slowed in its growth and may have reversed in places. With efforts currently underway, it is even possible that it will begin to decline throughout the developed world. Environmentalists are sure to cheer on such an outcome, and they should; there is nothing inherently wrong with reducing oil demand.
At the same time, that developed world trend does not define the future of oil demand; the future will be determined by the 7 billion people with growing demand. What happens if the rest of the world’s demand doubles, going from 3 barrels of per capita annual consumption to 6, which is still less than half of that in the developed world? In that case, daily global oil demand increases by roughly 40%. What does daily oil demand look like if the global average rises to the standard the West currently enjoys? We reach 334 million barrels of demand a day. We don’t hypothesize that this occurs, nor should we seek it, as it is unlikely we can meet that level of demand, hence the need for every energy source available (from oil and gas to renewables and perhaps even fusion one day) and our continued support of renewables.
This is the underlying argument for long-term oil and gas demand. There is an imbalance in global energy demand between the developed and developing world that can only be met with oil and gas. Furthermore, addressing that demand is critical for the world economy and continued efforts at improving the lives of 7 billion people who do not live in the developed world. In 2022, 55% of global exajoules of energy consumed came from either oil or natural gas. That number does not capture the complete economic impact of oil demand, as 20% of a barrel of oil is used to produce products other than energy (chemicals, plastics, etc.). Recognizing the critical linkages between oil and the rest of the economy is essential because if one regresses global GDP since 1964 against energy demand (see chart below), one finds a correlation of 0.98, implying that energy use and GDP go hand in hand. Ready access to energy directly contributes to economic growth, which directly improves the lives of billions.
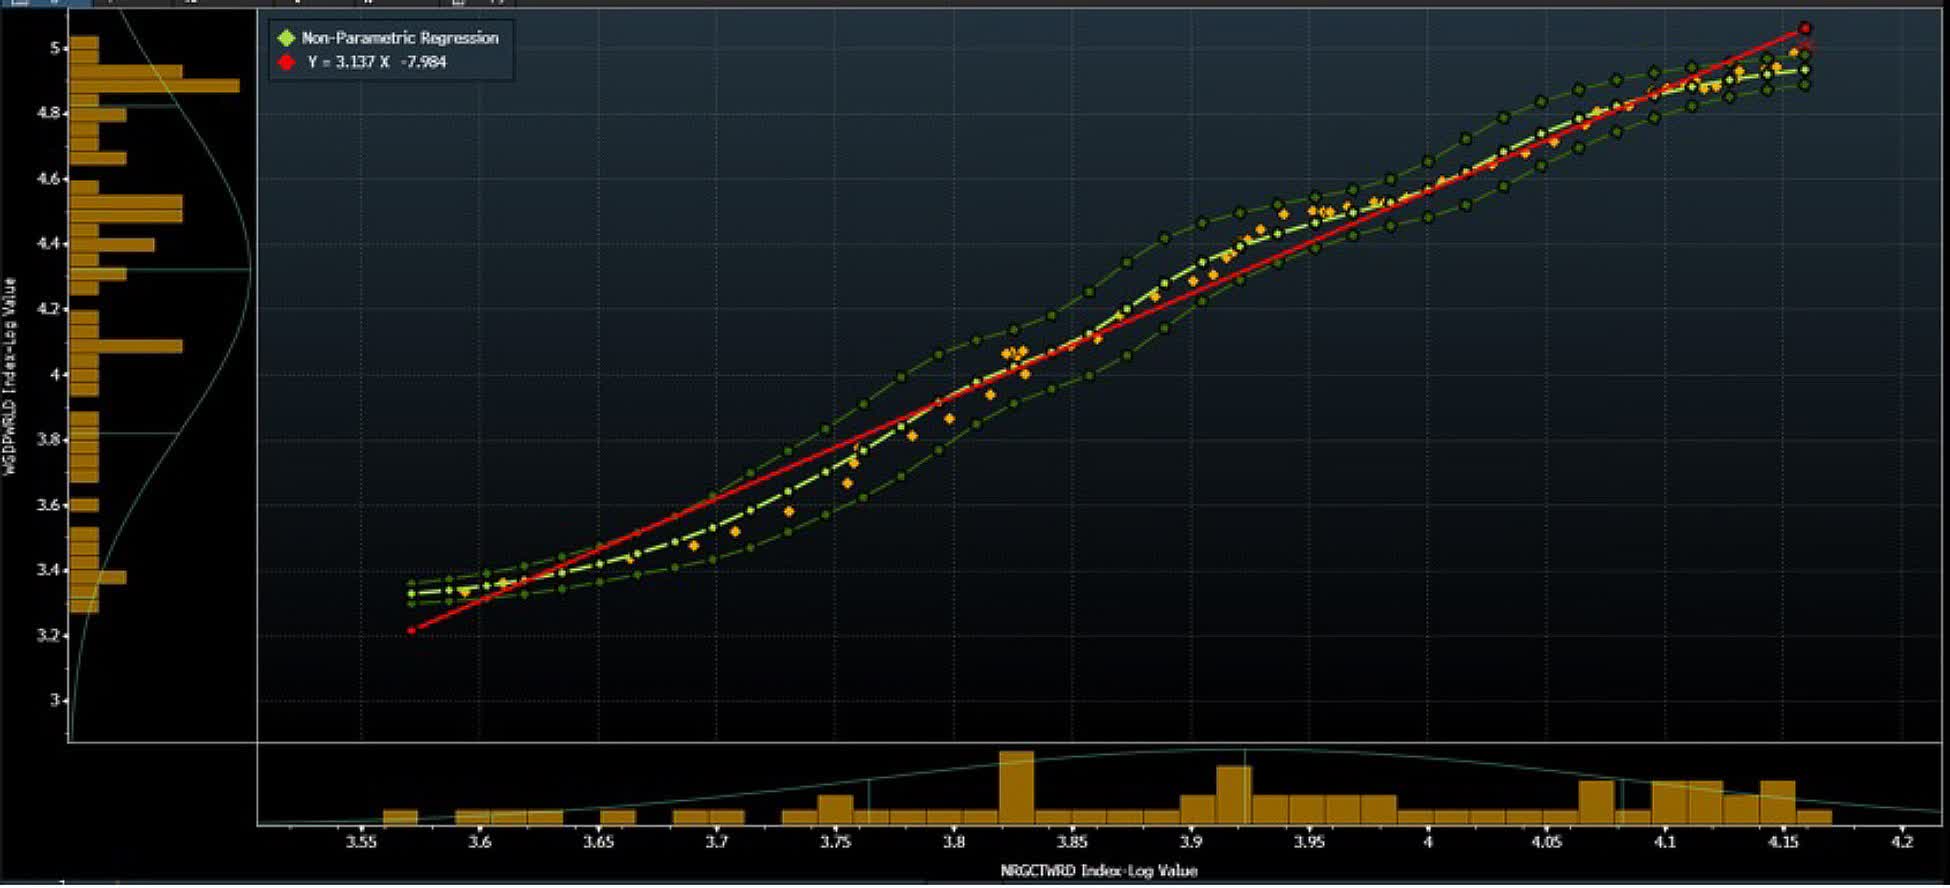
Various advocacy groups, such as the IEA, predict nothing more aggressive than oil demand stability in the next decade. The IEA World Energy Outlook 2022 Stated Policies Scenario (STEPS) suggests global oil demand rebounds and surpasses 2019 levels by 2023, despite high prices; it peaks in the mid-2030s at 103 million barrels per day (mb/d) and by 2050 is at 102 million barrels a day. In the Announced Pledges Scenario (APS), more decisive green policy action brings the peak in oil demand to the mid-2020s, with oil demand falling to 93 million barrels by 2030 and 57 million barrels a day by 2050. In the Net Zero Emissions by 2050 (NZE) Scenario, faster global action to cut emissions means oil demand will never return to its 2019 level and will fall to 75 mb/d by 2030.
The Net Zero Scenario has already failed as 2019 demand has already been surpassed.
All three scenarios seem somewhat comical, particularly the Net Zero Scenario. The Net Zero Scenario would imply that in the next seven years, the world will figure out how to address all incremental energy demand growth with non-hydrocarbon sources and replace roughly 14% of the world’s current energy supply with new non-hydrocarbon-based sources.
The key takeaway is that oil and natural gas prices may be volatile in the short term, and demand may decline someday. Still, for the foreseeable future, oil and natural gas supply represents a real bottleneck to continued economic growth. This should concern everyone regardless of your thoughts around climate change, but amusingly enough, especially for climate change advocates. Any transition to a low-carbon economy will encompass a wholesale reworking of the global energy system, the global transportation system, and every supply chain that crosses the globe, hence our past suggestion that it is humanity’s single largest industrial activity ever undertaken. If you want to undertake such an activity, the economy better hum; otherwise, we won’t be able to afford it.
Given events in the Middle East at the time of writing, a final note on geopolitics and oil markets seems warranted. Note that we are less interested in trying to predict the future than understanding what everyone else thinks will happen. The future is uncertain, and far more is possible than we can imagine. Still, the herd’s opinion produces a causal chain of events, which is important to understand, perhaps even more important than knowing exactly what will happen, as it lets us evaluate the risks embedded in current prices.
The market’s response to events in the week of October 9th has surprised us, specifically what we would consider a lackadaisical response to potential risk. As of October 12, oil is up anywhere from 2.8% to 3.6%, depending on what you look at over the past five days. There was some exciting movement in oil prices on October 9, but nothing dramatic. It is difficult not to interpret this market response as pricing in a baseline scenario where the current conflict does not spread beyond Israel’s borders. If the conflict remains confined to Israel, global oil supplies have no meaningful threat, hence a subdued response. We worry that markets are not giving enough credit to a possible scenario in which the current conflict spreads beyond Israel. Should that happen, oil prices would spike as supply out of the Middle East would be threatened.
The more significant economic impact of such a scenario seems poorly appreciated. Looking back to the 1970s, there was a series of conflicts in the Middle East, starting with the Yom Kippur War in 1973 and followed by the Iranian Revolution in 1978, that impacted oil prices. Both events occurred coincident with the 1973 oil crisis and the 1979 oil crisis. The respective oil shocks that happened during those years were partly the cause of a massive stagflationary current that washed over the globe. This is not the baseline scenario the market is pricing in (nor should it necessarily do so); the market is discounting the chance of a massive conflict, but it remains a genuine risk that does seem to be ignored.
As events in Ukraine demonstrated, the sensitivity of the global economy to energy shocks is very high, a reality we continue to think is oddly underappreciated by the West. Energy shocks typically send economies into either a dramatic slowdown or a recession combined with a rise in Inflation, hence the possibility of a stagflationary outcome. We would expect central banks to come under significant pressure should we see a repeat of oil price moves seen in the last two years as they must choose between raising rates to tame Inflation or cutting rates to boost growth. In the 1970s, similar events caused a de-anchoring of inflationary expectations. Should we experience a spread of conflict, it would likely lead to the second energy crisis in two years, an outcome we are not sure has a historical analog.
The most famous saying about Inflation comes from Milton Friedman: “Inflation is always and everywhere a monetary phenomenon.” We are hesitant to boldly (arrogantly) suggest the great economist makes his case too strongly but find inflation is more likely always and everywhere, a behavioral phenomenon. The potential for surprise on the geoeconomic and geopolitical front at the current time seems significant.
Materials Exposure (50.8% Gross, 12.7% Net)
We are currently significantly overweight Materials, with much of the change from last quarter driven not by new positions but by a combination of appreciation of our uranium positions and adding a few new shorts to the book.
Our uranium exposure rallied 67% during the quarter, yielding a 1.97% gain for the portfolio on a position that now represents 8.3% of the portfolio. We have not considered trimming yet, as we continue to expect more price appreciation from the uranium space. Although we remain only modestly confident in the claims of a sea change in sentiment around Nuclear, we are convinced that even the modest shift that has occurred can be counted on to ensure that the pace of decommissioning slows (outside of places like Germany, which has lost its way when it comes to energy policy). We also think that price stability at current levels might not be sufficient in and of themselves to justify FID on various pre-production mines. There is no scuttlebutt to this effect, but we would be surprised to see miners rushing to build unless Uranium shoots the moon from here or maintains these price levels for an extended period. As such, the Uranium supply situation continues to look like a coiled spring in our mind, with ever greater compression being created because of the simple passage of time and stable demand, let alone modestly rising demand.
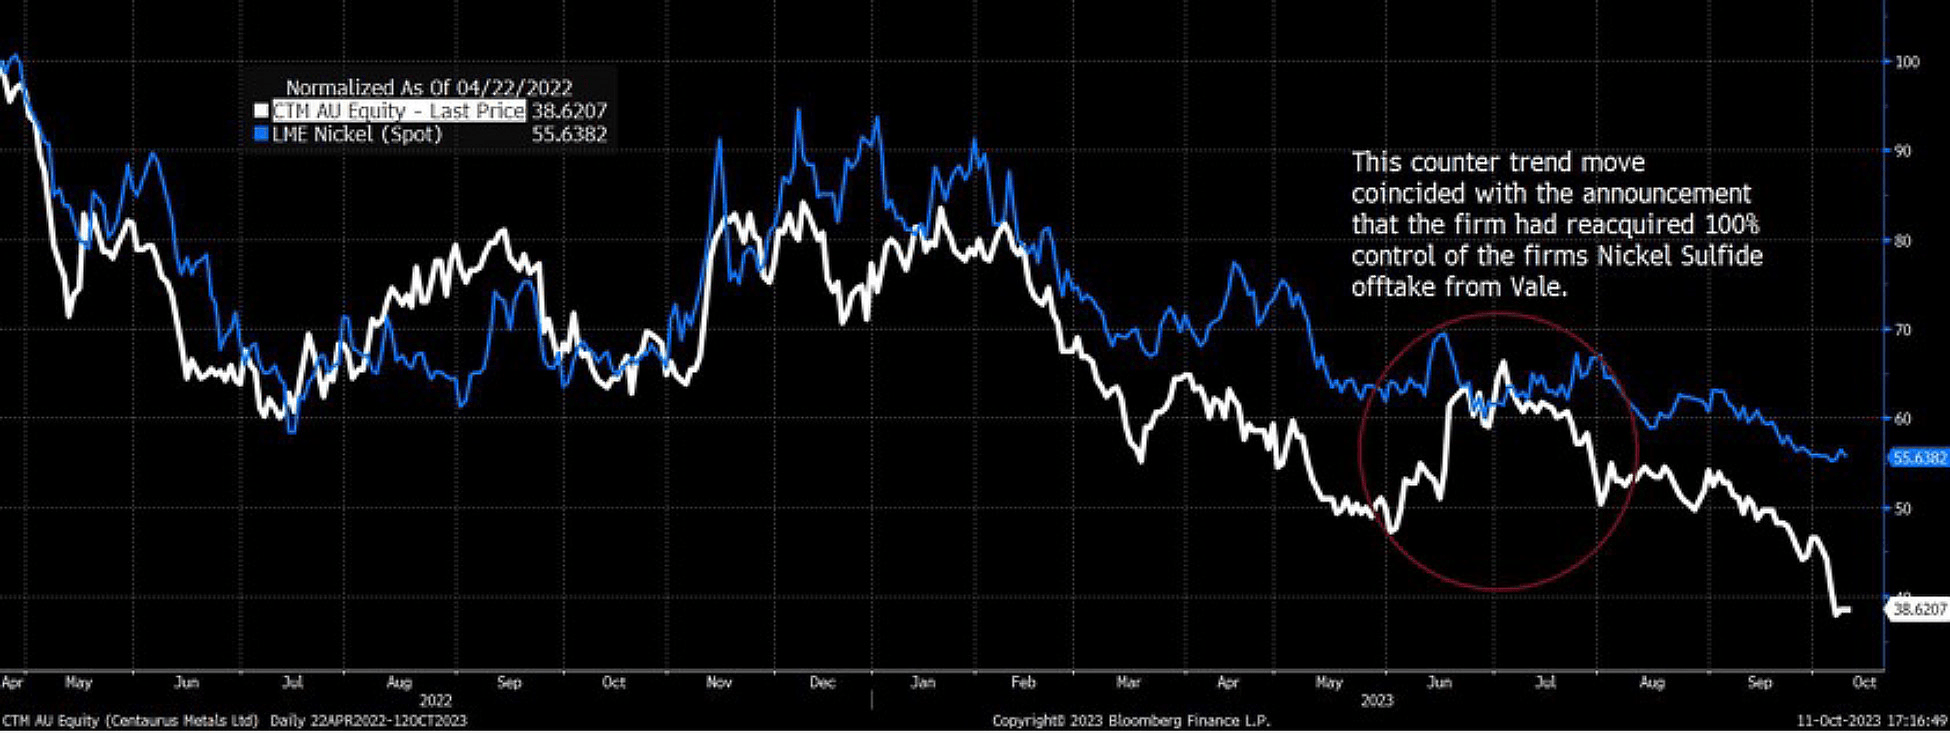
Within Materials, our investments in Gold (Equinox and an undisclosed junior) and our Nickel investment in Centaurus Metals (CTTZF ) are proving particularly painful and account for the vast majority of not only our 2023 losses but our struggles over the last seven quarters. Centaurus alone represents a nearly 5% loss for the portfolio at the current time. This is a particularly painful stock to own as the company continues to make decent progress on developing the Jaguar deposit, including securing complete control of the mines offtake from VALE . Nevertheless, the distinctive company-level catalysts are not proving sufficient. The stock has traded chiefly with nickel, which has done nothing but fall since our investment. The chart below shows the normalized return of LME Spot Nickel and CTM since ownership; they have tracked closely, except for a single counter-trend move spurred on by a company-level event.
We would be mistaken for not acknowledging some missteps in building the position, specifically an overly aggressive entry, which occurred in two ways: First, we took a full 6% position all at once, rather than legging into it. We do not have any notes on why we chose to do that, but it is not our standard approach to building a position. Second, we took an aggressive position at the same time dramatic events were occurring in the Nickel space. As a reminder, there was a sharp short squeeze in the LME Nickel markets in March/April of 2022; which coincided with the point when we finished our research and decided to take a position. In hindsight, we should have let the dust settle before proceeding.
In the wake of the squeeze, Nickel has remained a particularly tricky metal to think about the future of, far more challenging than other metals like lithium or tin that have significant growth potential driven by a combination of traditional technology and new energy technologies. Four factors drive the complication on the Nickel front:
- The continued emergence of separate pricing, supply, and demand for Class-1 Nickel (the easiest to convert to Nickel Sulfate for batteries) and Class-2 Nickel (Nickel Pig-Iron, NPI, used in stainless steel).
- The oversupply of Class 2 Nickel driven by a combination of sluggish demand from China, which consumes 70% of the world’s Class 2 Nickel, and surging supply from Indonesia, the world’s largest producer, which, according to data from the International Nickel Study Group grew output 48% in 2022 and another 41% in 2023 thus far.
- The continued promise of High-Pressure Acid Leaching (HPAL) projects to produce cost-effective Nickel Sulfate in the long-term from lower quality lateritic nickel projects that generally produce Class 2 Nickel. 2
- An unclear future for Nickel-heavy lithium-ion battery chemistries.
Regarding the first issue, NPI and Nickel Sulfate prices have already decoupled—from themselves and from LME nickel prices, with NPI currently trading at roughly ~$14,000 per ton in China and Nickel Sulfate at ~$24,924 per ton versus generic LME prices of roughly ~$18,000 per ton. We believe the discrepancy is due to multiple factors: oversupply of Class 2 Ore, additional methods to make nickel sulfate, i.e., through conversion of NPI matte/through HPAL, and lower liquidity in LME Nickel since the 2022 short squeeze.
We expect continued market fragmentation as the demand for lithium-ion batteries with Nickel-bearing chemistries, such as Nickel Manganese Cobalt (NMC), continues to grow. This fragmentation is good for our investment in CTM as the mine, a Sulfide deposit, proposes to sell Nickel Sulfate directly produced at the mine. This means they will sell a higher value-added product vs. most mines that sell a nickel concentrate to a refiner (typically in China).
Furthermore, we expect continued fragmentation of the market, similar to what is seen in the oil market based on sulfur content and weight (API Gravity) but in this case based on CO2 intensity. Some of this depends on how seriously car manufacturers take efforts to green supply chains, but the signals are good, especially when one is talking about higher-end EVs selling into Western markets. Simplistically, we see all metals ultimately being sold on a Free on Board 3 carbon-neutral basis, meaning a premium/discount would be applied based on the carbon intensity of production. In this context, Class 1 Nickel and Nickel Sulfate produced from sulfide deposits will earn a premium due to the inherently lower carbon intensity of the production process.
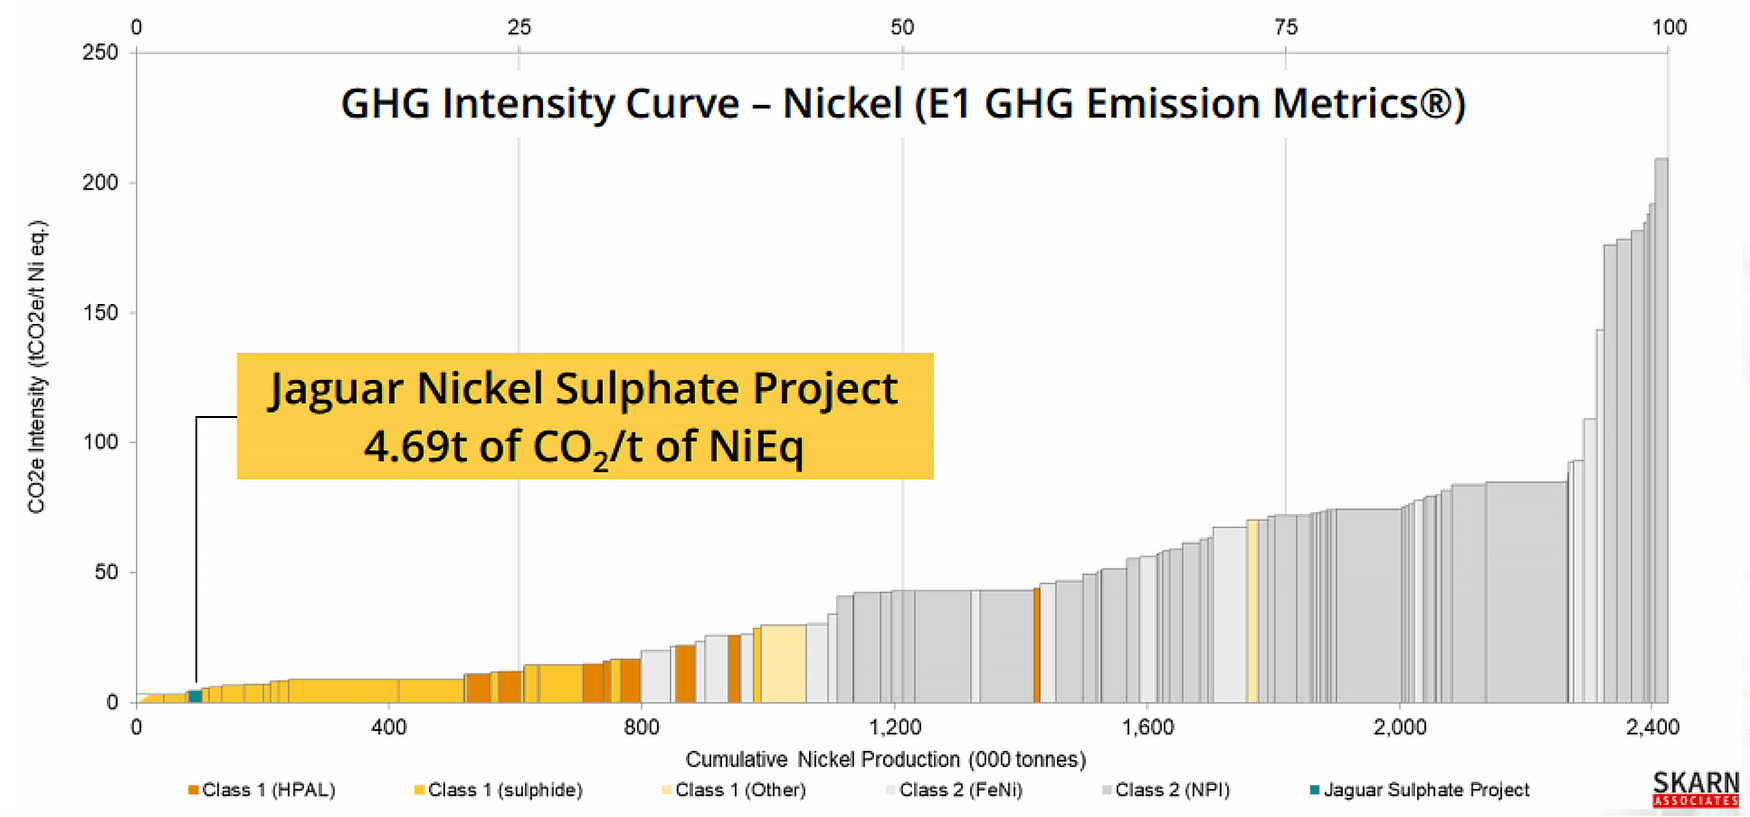
As the chart of the GHG intensity of producing Nickel across the industry shows, the Jaguar deposit has a lower life of mine CO2 footprint than 97% of global nickel production. Some may ignore this as just an amusing factoid about the nickel produced by Jaguar, but we disagree. On October 1, the EU officially entered the transitional period of the Carbon Border Adjustment Mechanism (CBAM) 4 ; the initial transitional period only requires importers of select overseas goods (including iron, steel, and aluminum) to report greenhouse gas emissions embedded in their products.
In the fullness of time, the EU expects to apply the CBAM more broadly and tax sellers of high-embedded carbon products. This will translate to a competitive advantage for Jaguar, whose nickel will compare favorably with the output of places like Indonesia, which have low-grade class 2 deposits and employ energy-intensive processes to convert that nickel into battery-grade nickel sulfate. In Indonesia, the largest global producer of nickel and the source of much of the current oversupply, the route to high-grading poor nickel ore is either by producing nickel matte or by processing the ore via HPAL.
Nickel matte production is energy-intensive, requiring the ore to be heated to more than 1,500 degrees Celsius, which is done in a rotary kiln electric furnace that a collocated coal-fired power plant typically powers. HPAL, on the other hand, is much less energy-intensive but produces a nasty toxic slurry that must be stored in a tailings dam. In either case, the ore from Jaguar is a much cleaner product and superior to that which can be sourced from most Asian miners. Admittedly, policies such as the CBAM will not save the nickel prices from falling should Indonesia ramp production as much as it appears they might, but commodities are not as commoditized as people think they are, and low-carbon high-quality nickel sulfate from a western supplier will likely earn a premium price.
Centaurus should release a Definitive Feasibility Study on the Jaguar deposit during the fourth quarter, clearing the path for a final investment decision sometime next year. This will likely remain a painful investment for some time, but we have confidence that the asset’s qualities and the market context will eventually yield a good return.
As always, we appreciate the trust and confidence you have shown in Massif Capital by investing with us. We hope that you and your families stay healthy over the coming months. Should you have any questions or concerns, please do not hesitate to reach out.
Best Regards,
Will Thomson
ENDNOTES1 Super-Spiked | Arjun Murti | Substack2 Nickel deposits tend to come in two flavors: Sulfidic and Lateritic. Laterite deposits make up 70% of all nickel reserves and are found in Australia, Indonesia, New Caledonia, the Philippines, Cuba, and Brazil. Sulfite deposits are found in Canada and Russia and occasionally, as in the case of CTM, Brazil. Historically miners have favored sulfide deposits due to the costly and energy intensive process of recovering nickel from lateritic ores which cannot be concentrated via standard mining methods such as flotation forcing producers to process low concentrate ore. Around roughly 2010 lateritic ore production overtake sulphidic ore production as a result of hydrometallurgical processing methods such as HPAL. 3 Free on Board (FOB) is an incoterm that means the seller (in this example CTM) pays for transportation of the goods to the port of shipment, plus loading costs, and the buyer pays the cost of marine freight transport, insurance, unloading and transportation from the arrival port to the final decision. In essence FOB indicates that the passing of risk occurs when the good are loaded on board at the port of shipment from the seller to the buyer. 4 For more on CBAM follow this link DISCLOSURESOpinions expressed herein by Massif Capital, LLC (Massif Capital) are not an investment recommendation and are not meant to be relied upon in investment decisions. Massif Capital’s opinions expressed herein address only select aspects of potential investment in securities of the companies mentioned and cannot be a substitute for comprehensive investment analysis. Any analysis presented herein is limited in scope, based on an incomplete set of information, and has limitations to its accuracy. Massif Capital recommends that potential and existing investors conduct thorough investment research of their own, including a detailed review of the companies’ regulatory filings, public statements, and competitors. Consulting a qualified investment adviser may be prudent. The information upon which this material is based and was obtained from sources believed to be reliable but has not been independently verified. Therefore, Massif Capital cannot guarantee its accuracy. Any opinions or estimates constitute Massif Capital’s best judgment as of the date of publication and are subject to change without notice. Massif Capital explicitly disclaims any liability that may arise from the use of this material; reliance upon information in this publication is at the sole discretion of the reader. Furthermore, under no circumstances is this publication an offer to sell or a solicitation to buy securities or services discussed herein. Disclosure: |
Editor's Note: The summary bullets for this article were chosen by Seeking Alpha editors.
For further details see:
Massif Capital Q3 2023 Letter To Investors