CMCSA - Mawer Investment Management Quarterly Update - Q3 2022
Summary
- The valuation correction experienced in 2022 - while far from pleasant - has its benefits in that gravity is being restored to the system.
- Companies that have been able to pass on cost increases to customers have also been generally well rewarded in the market.
- Holdings that faced increased costs and margin compression have seen their stock prices come under pressure.
- The probability of a global economic slowdown remains high.
Market overview
Numerous equity markets declined (in local currency terms) during a volatile third quarter, despite some optimism early in the period that led to a brief rally. Many central banks have continued to hike interest rates and the U.S. Federal Reserve has been unequivocal about its plan to fight inflation; ultimately, how far and how fast the U.S. Federal Reserve will go has been a key factor driving markets. Additionally, currency markets experienced significant volatility and the U.S. dollar was considerably strong against many other currencies.
The Bank of Canada has also remained committed to ensuring that higher prices do not get entrenched into expectations. Headline inflation eased slightly in Canada but remained elevated and Canadian bonds finished the quarter with a positive return as longer dated interest rates moved modestly lower.
How did we do?
| Performance has been presented for the O-Series Mawer Mutual Funds in Canadian dollars and calculated gross of management fees and net of operating expenses for the 3-month period of July 1 - September 30, 2022. |
As the performance of various asset classes suggests, the risks are evident: inflation, central bank tightening, and the associated impacts to growth. This is a transition period from the era of unusually accommodative monetary policy that persisted since the Global Financial Crisis toward one of structurally higher rates. Just as in life, transition periods in markets are often volatile and can be long lasting. But the valuation correction experienced in 2022-while far from pleasant-has its benefits in that gravity is being restored to the system.
Equities
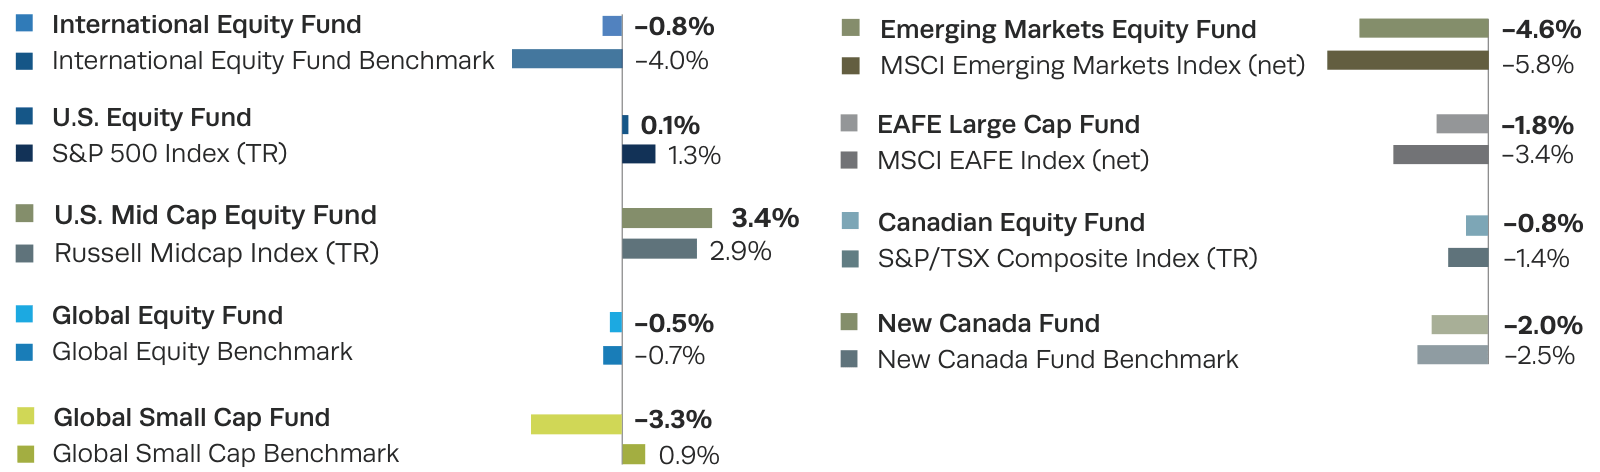
Chart A: Q3 2022, Series O, Gross of fees
With the backdrop of a more uncertain economic environment, there were several companies in our portfolios that performed well over the quarter.
- Businesses we would define as "boring" were some of the stronger performing stocks in the quarter. Holdings such as insurance broker Aon ( AON ), reference data provider Wolters Kluwer ( WOLTF ), and manufacturer of electronic connectors and cables Amphenol ( APH ), posted steady increases in revenues and operating profits reflecting the stability of their businesses.
- While many global banks declined in the quarter, our Singapore bank holding, DBS Group ( DBSDF ), whose lending book is tilted toward floating rate loans tied to the U.S. Federal Funds rate, has enjoyed the associated higher net interest margins.
- Another company that has been a beneficiary in the current environment is Deutsche Boerse ( DBOEF ), a financial exchange that benefits from increased hedging activity.
Companies that have been able to pass on cost increases to customers have also been generally well rewarded in the market. While they had good performance in the third quarter, some of the businesses noted below have seen their stock prices go through a period of decline at some point in the last couple of years.
- Operator of auto-collision repair shops, Boyd Group ( BYDGF ), experienced higher labor inflation and while there was a lag, the company displayed its pricing power by passing on much of these increased costs.
- Our holdings in Japanese drugstores such as TSURUHA ( TSUSF ) and KUSURI NO AOKI took a positive step towards passing on higher costs in a market which is traditionally averse to price hikes.
On the contrary, holdings that faced increased costs and margin compression have seen their stock prices come under pressure.
- U.K. automobile insurer Admiral Group ( AMIGF ), which previously benefited from COVID-19 lockdowns reducing the number of overall accidents, has seen this trend reverse with more drivers on the road. In addition, their competition has been intensifying and Admiral has not been fully able to pass through increased claims inflation to its customers.
- Paper-based personal care products producer Essity ( ETTYF ) is another example; though the company has been increasing its prices, they haven't fully kept up with inflation.
There are a few other segments of our portfolios that displayed weakness in the quarter.
- Cable and telecommunication companies have been an area that has lagged the broader market as their worlds are increasingly colliding. Companies such as Verizon ( VZ ) and Comcast ( CMCSA ) have been impacted as wireless operators are spending heavily to attract internet subscribers with fixed wired access and the cable companies are trying to build wireless businesses.
- Companies tied to the Real Estate market also tended to lag this quarter as higher interest rates impacted the sector. Holdings including Colliers International Group ( CIGI ), Choice Properties REIT ( PPRQF ), and Mainstreet Equity ( MEQYF ) had their stock prices decline.
- Other companies that have seen declines include those that have been impacted by macroeconomic uncertainty in China. Both Alibaba ( BABA ) and Tencent ( TCEHY ) have reported results that are negative fundamentally, and while both have been under pressure from new competition, the recent results are also a reflection of the economic state in China.
Balanced and Canadian Bond
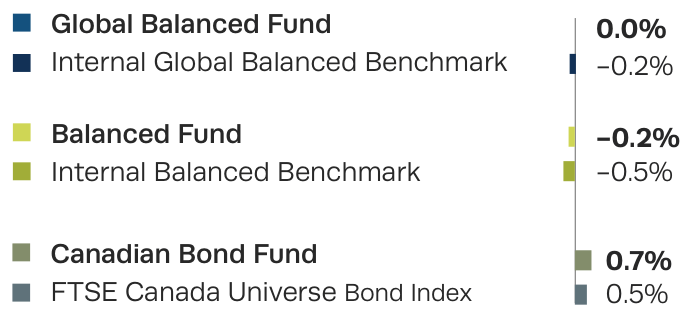
Chart B: Q3 2022, Series O, Gross of fees
Canadian bonds moved higher this quarter, as longer dated interest rates moved modestly lower, but much more is needed to recover from the losses incurred in the first half of the year. The flattening of the yield curve was a result of the Bank of Canada continuing to hike interest rates to control inflation.
The relative outperformance of the Mawer Canadian Bond Fund was driven by our duration decision to switch from long to short relative to the benchmark and curve positioning that benefited from the yield curve flattening. Mawer's Balanced strategies delivered slightly negative returns this quarter and performed in line with their benchmarks.
From an asset mix perspective, we are holding higher than normal levels of cash within our portfolios. After a series of equity trims during 2022 we've now transitioned to an equity weight that is slightly below our neutral level. Bond allocations also remain below our long-term neutral targets. Tilting the portfolio towards this defensive positioning offers some additional resilience to rising interest rates, but as long-term investors we remain comfortable with our current allocation to both bonds and equity.
Looking ahead
As we move forward, the market will continue to keep a close eye on economic data that may signal how central banks will respond in the coming months. Given the macroeconomic headwinds facing markets, the probability of a global economic slowdown remains high-though we will point out the market has the potential to be surprised if inflation moderates faster than expected. Supply chains have improved and commodity prices have also moderated. Some companies also noted elevated inventory levels in the quarter, a sign that demand may be softening.
Higher discount rates combined with the potential for diminished earnings growth can have a material impact on company valuations. While markets globally may have the rise in discount rates priced in, many still do not have an earnings recession reflected in valuation. Ultimately, additional headwinds to company valuations might remain.
As we have mentioned before, one of the risks is something breaks. We don't have to look further than the recent mini-budget announcement in the U.K. to see the delicateness in the current market environment. The British pound nearly hit parity with the U.S. Dollar and U.K. yields were sent soaring on the news. The vast speed on which the situation unfolded highlights how sensitive the market can be to surprises.
With all the macroeconomic headlines dominating markets, we continue to stick to our bottom-up process and focus on the quality of the companies we purchase, while being cognizant of thematic or macroeconomic exposures to determine if there are sharp corners that require addressing. Regardless of how the economic outlook may evolve, we take comfort in the notion that over the long term, stock prices tend to follow wealth creation. As such, we continue to lean heavily into the durability of our philosophy and process in an effort to responsibly steward our clients' investments through uncertainty.
Total gross returns (Series O)
For periods ending September 30, 2022
| Equity funds |
| YTD |
| 3-Mo |
| 1-Yr |
| 3-Yr |
| 5-Yr |
| 10-Yr |
| Since Inception* |
| Mawer International Equity Fund |
| -25.0 |
| -0.8 |
| -21.8 |
| -0.4 |
| 2.1 |
| 8.7 |
| 8.1 |
| International Equity Benchmark* |
| -20.0 |
| -4.0 |
| -18.8 |
| -0.3 |
| 1.1 |
| 7.2 |
| 4.9 |
| Mawer U.S. Equity Fund |
| -18.2 |
| 0.1 |
| -9.2 |
| 7.3 |
| 12.3 |
| 16.0 |
| 9.8 |
| S&P 500 Index ((TR)) |
| -17.2 |
| 1.3 |
| -8.3 |
| 9.5 |
| 11.3 |
| 15.5 |
| 9.3 |
| Mawer U.S. Mid Cap Equity Fund |
| -19.0 |
| 3.4 |
| -12.8 |
| - |
| - |
| - |
| -12.8 |
| Russell Midcap Index ((TR)) |
| -17.6 |
| 2.9 |
| -12.6 |
| - |
| - |
| - |
| -12.6 |
| Mawer Global Equity Fund |
| -17.2 |
| -0.5 |
| -10.8 |
| 6.2 |
| 9.5 |
| 13.5 |
| 12.6 |
| Global Equity Benchmark* |
| -19.1 |
| -0.7 |
| -13.9 |
| 5.0 |
| 6.4 |
| 11.4 |
| 9.9 |
| Mawer Global Small Cap Fund |
| -24.6 |
| -3.3 |
| -26.4 |
| 0.9 |
| 5.0 |
| 13.5 |
| 11.5 |
| Global Small Cap Benchmark* |
| -19.9 |
| 0.9 |
| -18.4 |
| 4.2 |
| 4.3 |
| 10.2 |
| 6.3 |
| Mawer Emerging Markets Equity Fund |
| -33.1 |
| -4.6 |
| -32.8 |
| -4.4 |
| -0.7 |
| - |
| 1.1 |
| MSCI Emerging Markets Index ((NET)) |
| -20.8 |
| -5.8 |
| -22.0 |
| -0.8 |
| 0.1 |
| - |
| 2.7 |
| Mawer EAFE Large Cap Fund |
| -24.7 |
| -1.8 |
| -20.3 |
| - |
| - |
| - |
| 0.5 |
| MSCI EAFE Index ((NET)) |
| -20.7 |
| -3.4 |
| -18.8 |
| - |
| - |
| - |
| 0.6 |
| Mawer Canadian Equity Fund |
| -9.7 |
| -0.8 |
| -3.7 |
| 6.5 |
| 6.3 |
| 10.3 |
| 9.5 |
| S&P/TSX Composite Index ((TR)) |
| -11.1 |
| -1.4 |
| -5.4 |
| 6.6 |
| 6.5 |
| 7.3 |
| 7.0 |
| Mawer New Canada Fund |
| -23.4 |
| -2.0 |
| -22.9 |
| 5.8 |
| 7.0 |
| 12.1 |
| 12.9 |
| New Canada Benchmark* |
| -16.3 |
| -2.5 |
| -13.8 |
| 6.5 |
| 2.4 |
| 3.2 |
| 5. [1] |
| Balanced funds |
| Mawer Global Balanced Fund |
| -14.6 |
| 0.0 |
| -9.9 |
| 3.7 |
| 6.4 |
| - |
| 8.4 |
| Internal Global Balanced Benchmark* |
| -15.6 |
| -0.2 |
| -11.9 |
| 1.9 |
| 4.2 |
| - |
| 6.7 |
| Mawer Balanced Fund |
| -16.4 |
| -0.2 |
| -12.8 |
| 2.0 |
| 4.6 |
| 8.2 |
| 7.3 |
| Internal Balanced Benchmark* |
| -14.0 |
| -0.5 |
| -10.8 |
| 2.6 |
| 3.9 |
| 6.3 |
| 5.4 |
| Mawer Tax Effective Balanced Fund |
| -16.3 |
| -0.2 |
| -12.8 |
| 1.9 |
| 4.6 |
| 8.2 |
| 7.2 |
| Internal Tax Effective Balanced Benchmark* |
| -14.0 |
| -0.5 |
| -10.8 |
| 2.6 |
| 3.9 |
| 6.3 |
| 5.3 |
| Income funds |
| Mawer Canadian Bond Fund |
| -11.7 |
| 0.7 |
| -10.5 |
| -2.2 |
| 0.8 |
| 1.7 |
| 3.6 |
| FTSE Canada Universe Bond Index |
| -11.8 |
| 0.5 |
| -10.5 |
| -2.5 |
| 0.7 |
| 1.7 |
| 3.5 |
| Mawer Canadian Money Market Fund |
| 0.9 |
| 0.5 |
| 0.9 |
| 0.7 |
| 0.9 |
| 0.8 |
| 1.1 |
| FTSE Canada 91 Day TBill Index |
| 0.8 |
| 0.5 |
| 0.9 |
| 0.8 |
| 1.0 |
| 0.9 |
| 1.3 |
For further details see:
Mawer Investment Management Quarterly Update - Q3 2022