TZA - MDA Breakout Stocks/ETFs Week 12 - March 2023: High-Frequency Gainers To Give You An Edge
2023-03-19 07:43:18 ET
Summary
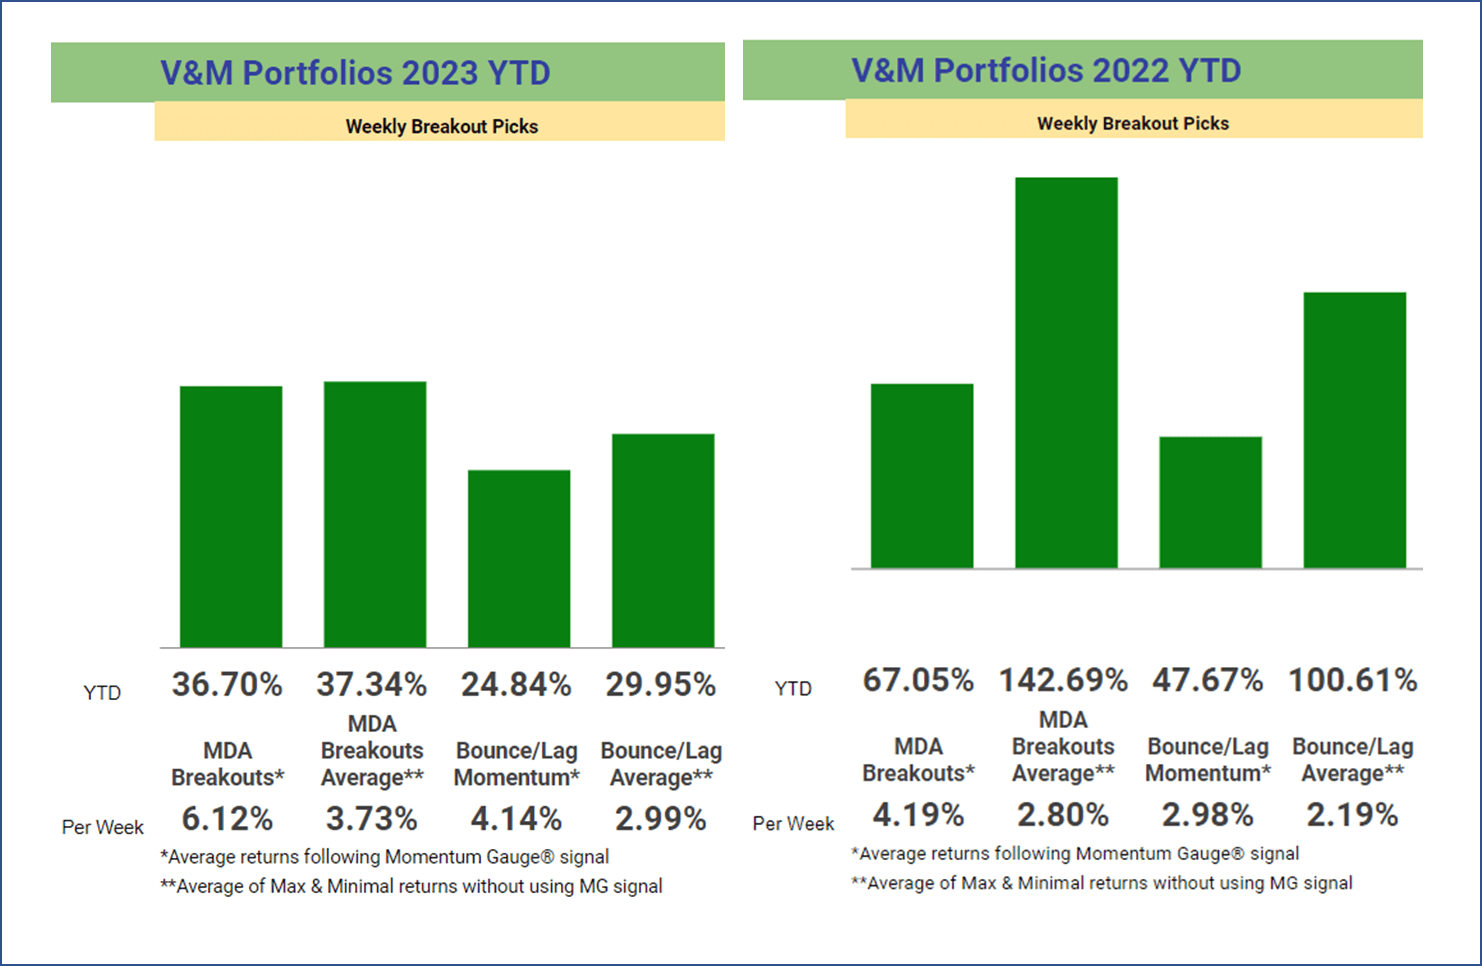
- Two new Breakout Stocks for Week 12 with better than 10% short-term upside with ETFs and a Dow 30 Pick. Average cumulative returns for 2023 are +37.3% YTD.
- The Momentum Gauges® continue negative in bear funds from Mar 7th led by BNKD +65.7%. EGO peaked at +8.3% gains for members.
- The streak of weekly picks gaining over 10% in less than a week has reached 240 out of 303 trading weeks (79.2%) not considering multiple gainers or negative signals.
- Annual returns are simulated by adding 52 weekly selections though they could be compounded weekly. Since inception, over 450 stock picks have gained over 10% in less than a week.
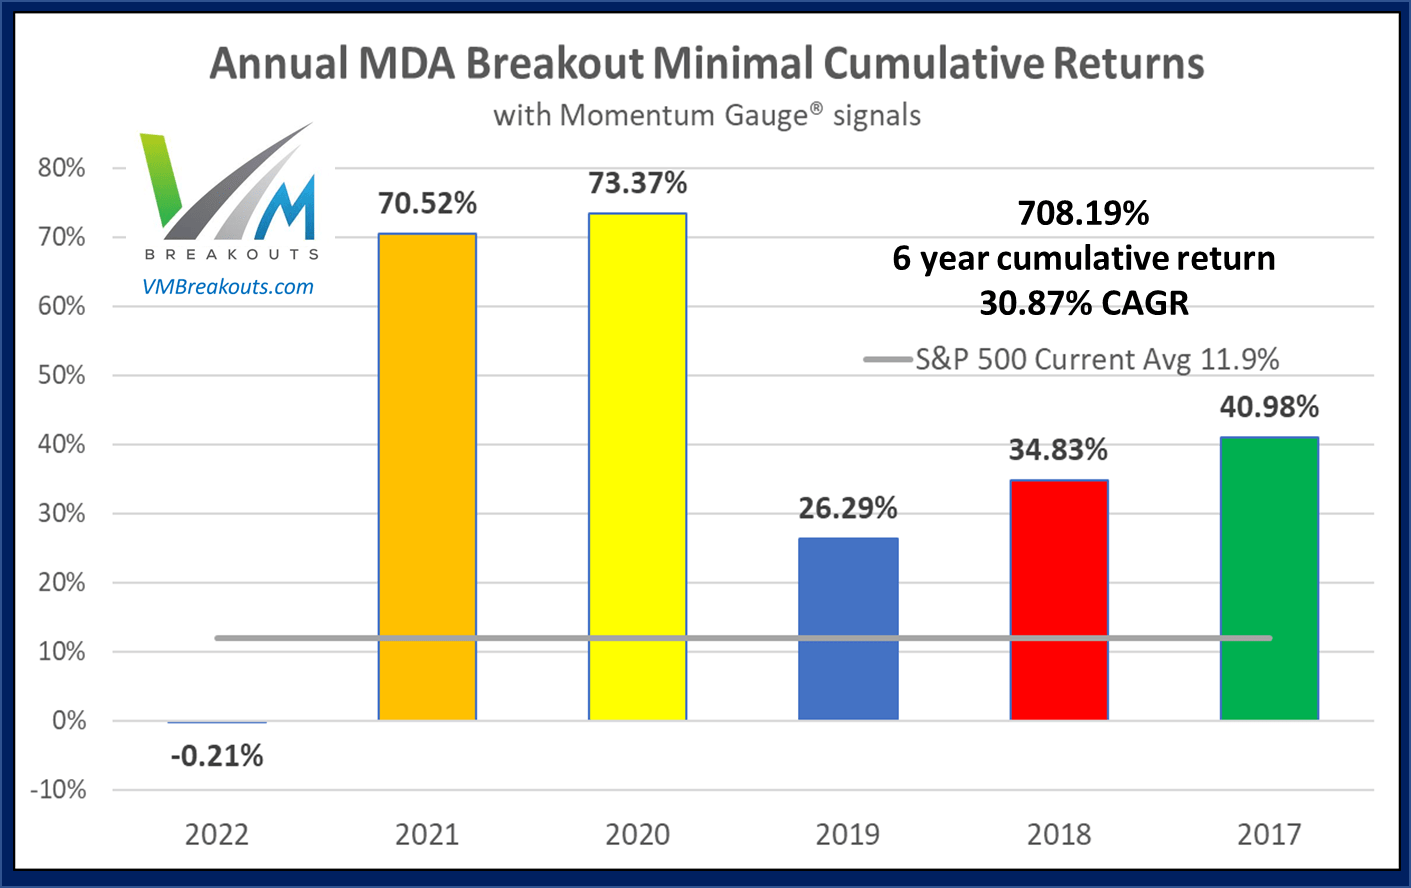
- The MDA breakout picks continue to beat the S&P 500 into 7 consecutive years delivering +708.2% compound returns through 2022 and a CAGR +30.87%.
Introduction
The Weekly Breakout Forecast continues my doctoral research analysis on MDA breakout selections over more than 8 years. This high frequency breakout subset of the different portfolios I regularly analyze has now reached 300 weeks of public selections as part of this ongoing live forward-testing research. The frequency of 10%+ returns in a week is averaging over 4x the broad market averages in the past 6+ years.
In 2017, the sample size began with 12 stocks, then 8 stocks in 2018, and at members' request since 2020, I now generate only 4 selections each week. In addition 2 Dow 30 picks are provided using the MDA methodology, but I highly recommend the monthly Growth & Dividend mega cap breakout portfolios if you are looking for larger cap selections beyond only 30 Dow stocks.
As long term investors know , you can compound $10,000 into $1 million with 10% annual returns in less than 50 years. This model serves to increase the rate of 10% breakouts into 52 weekly intervals instead of years. In 2022, the worst market since 2008: 113 MDA picks gained over 5%, 52 picks over 10%, 22 picks over 15%, and 13 picks over 20% in less than week.
2023 Market Outlook
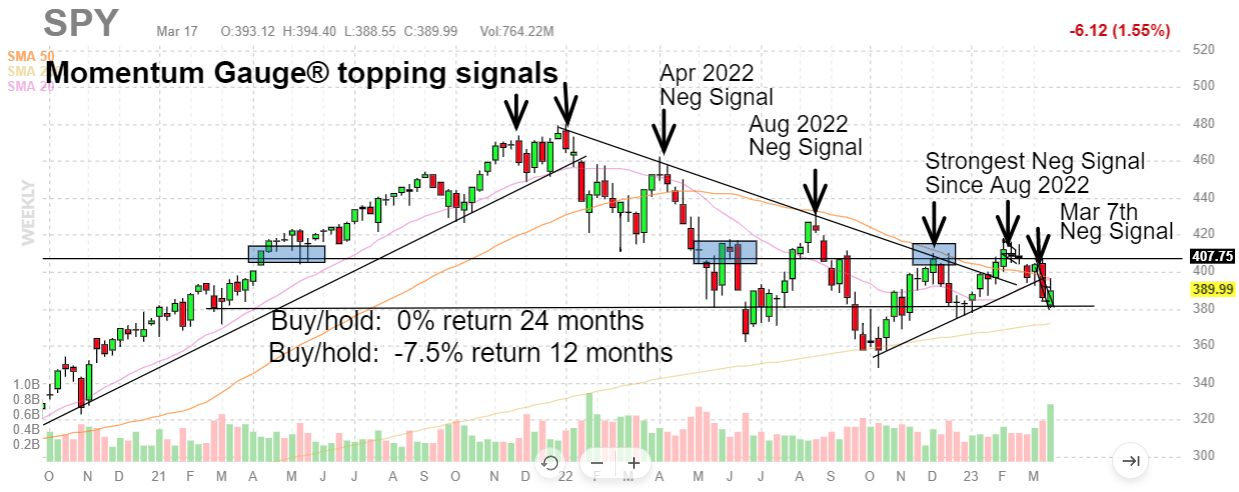
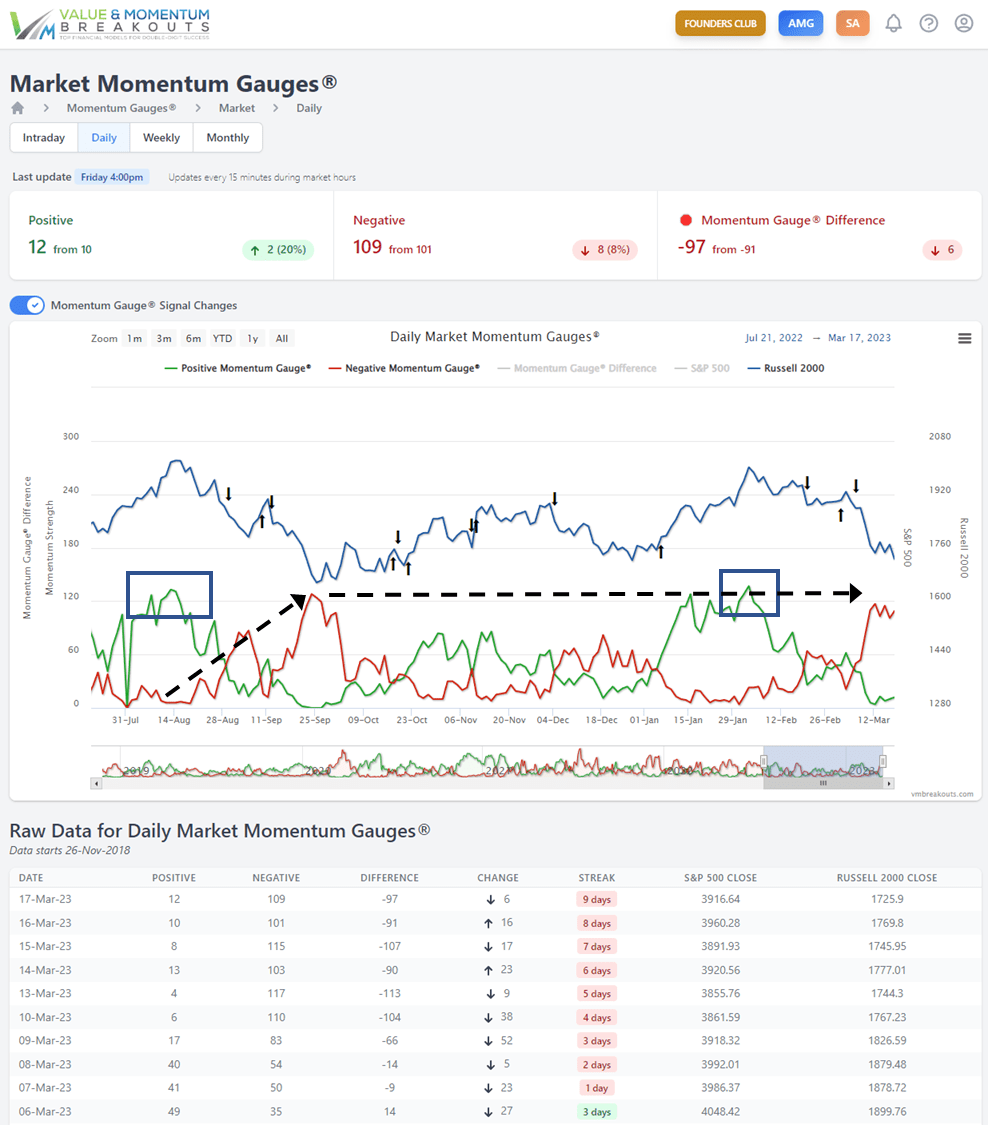
The strong similarities to the August topping signal on the Momentum Gauges continue from February. First the gauges reached the highest positive (overbought) levels in January with strong risk of a market downturn. Now we are watching the market breakdown to very high negative gauge levels to see if the gauges will test the high negative levels last September as we look for the next change in market conditions.
- V&M Breakout Update - March 8th: Bear Bounce Fades Into February Breakdown
- Largest Market Topping Signal Since August As Fed Considers 50 Bps Rate Hike
Why do finance companies admit that "timing is everything," but when it comes to investing your money the majority tell their clients to "just buy/hold and ride through the downturns?" I submit they would rely on timing signals, but without a model like the gauges they are forced to try to retain their clients in buy/hold positions for 24 months with no gains, or worse.
My strategy for 2023 is to stay generally bearish while adjusting for large bear bounces in anticipation of strong similarities to the August topping pattern. Economic data, inflation, manufacturing productivity, home sales, and the latest banking crisis continue to show recessionary weakness into rising interest rate hikes at the highest levels since 2008.
Mid-year 2023 is where things may get interesting with potential for a Fed pivot. Dip-buyers will continue to try to pull this anticipated pivot event forward in time extending high market volatility while the Fed hikes rates. Mid-year I also plan to leverage strong results from a new June Russell Reconstitution anomaly we found last year that is actively tracked on the dashboard: FTSE Russell Reconstitution Anomaly Study - Strong +22.7% Difference After 5 Months
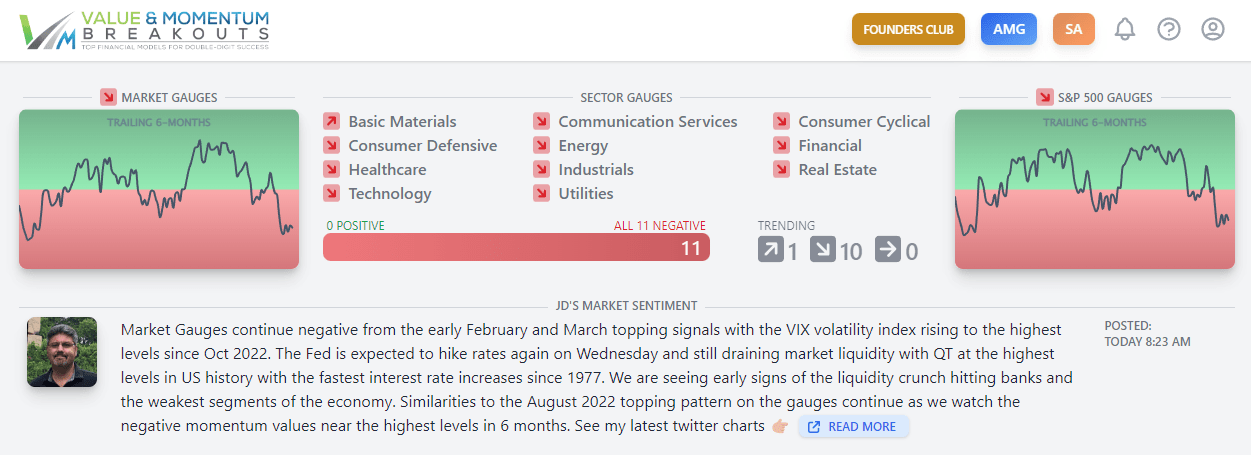
Momentum Gauges Dashboard for Week 12
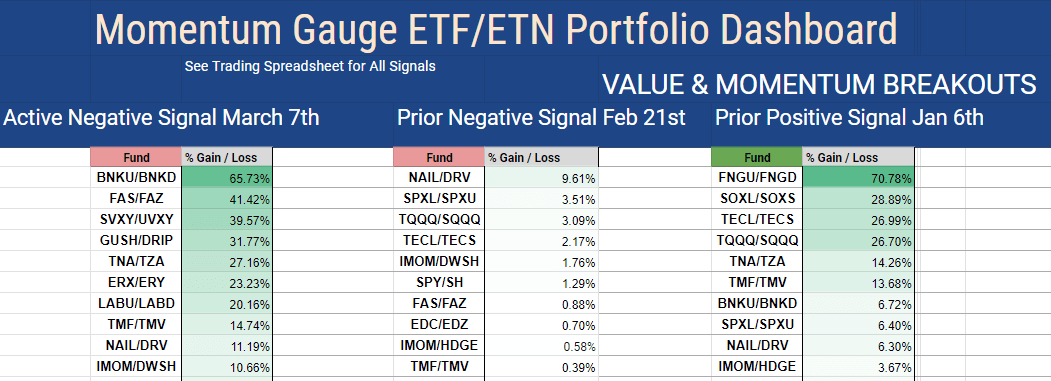
Momentum Gauges continue highly negative with all the sectors negative and weakening except Basic Materials on the strong move to Gold/Silver for safety. The negative signal for March has generated large gains for bear funds led by MicroSectors U.S. Big Banks -3x Bear fund ( BNKD ) +65.7%, Direxion Daily Financial Bear 3x fund ( FAZ ) +41.4%, ProShares Ultra VIX fund ( UVXY ) $39.5%, Direxion Daily S&P Oil & Gas Bear 2x fund ( DRIP ) +31.7%, Direxion Daily Small Cap Bear 3x fund ( TZA ) +27.2%
Positive gauges peaked in January at the highest levels since last August. Now we are watching for a peak in the negative gauges near the highest levels since September as the market continues to decline.
As a reminder much greater detail is covered live every day in the Chat Rooms with current charts and signals. If you are not reviewing the latest charts and updates you could be missing out.
Weekly Breakout Returns
The two weekly breakout portfolios are shown below with current 2023 returns. The ongoing competition between the Bounce/Lag Momentum model (from Prof Grant Henning, PhD Statistics) and MDA Breakout picks (from JD Henning, PhD Finance) are shown below with / without using the Momentum Gauge trading signal. The per-week returns equalize the comparison where there were only 16 positive trading weeks last year using the MDA trading signal (negative values below 40).
For 2022, the worst market since 2008: 113 MDA picks gained over 5%, 52 picks over 10%, 22 picks over 15%, and 13 picks over 20% in less than week . These are statistically significant high frequency breakout results despite many shortened holiday weeks.
V&M Multibagger List
While not the purpose of my model, longer term (using the trading video in FAQ #20) many of these selections may join the V&M Multibagger list now at 114 weekly picks with over 100%+ gains, 44 picks over 200%+, 15 picks over 500%+ and 7 weekly picks with over 1000%+ gains since January 2019 such as:
- Celsius Holdings ( CELH ) +1,682.5%
- Enphase Energy ( ENPH ) +1,227.8%
- Trillium Therapeutics ( TRIL ) +1008.7%
More than 450 stocks have gained over 10% in less than a week since this MDA testing began in 2017. Frequency comparison charts are at the end of this article. Readers are cautioned that these are highly volatile stocks that may not be appropriate for achieving your long term investment goals: How to Achieve Optimal Asset Allocation
Historical Performance Measurements
Historical MDA Breakout minimal buy/hold (worst case) returns have a compound average growth rate of 30.87% and cumulative minimum returns of +708.19% from 2017. The minimal cumulative returns for 2022 were -0.21%, average cumulative returns were +67.05%, and the best case cumulative returns were +360.25%. The chart reflects the most conservative measurements adding each 52 weekly return in an annual portfolio simulation, though each weekly selection could be compounded weekly.
The Week 12 - 2023 Breakout Stocks for next week are:
The picks for next week consist of 2 Technology, 1 Basic Materials, and 1 Real Estate sector stocks. These picks have already gained as much as 9% in the advance release to members Friday. Momentum Gauge values continue highly negative and I caution against positive momentum picks this week. Prior selections may be doing well, but for research purposes I deliberately do not duplicate selections from the prior week. These selections are based on MDA characteristics from my research, including strong money flows, positive sentiment, and strong fundamentals -- readers are cautioned to follow the Momentum Gauges for the best results.
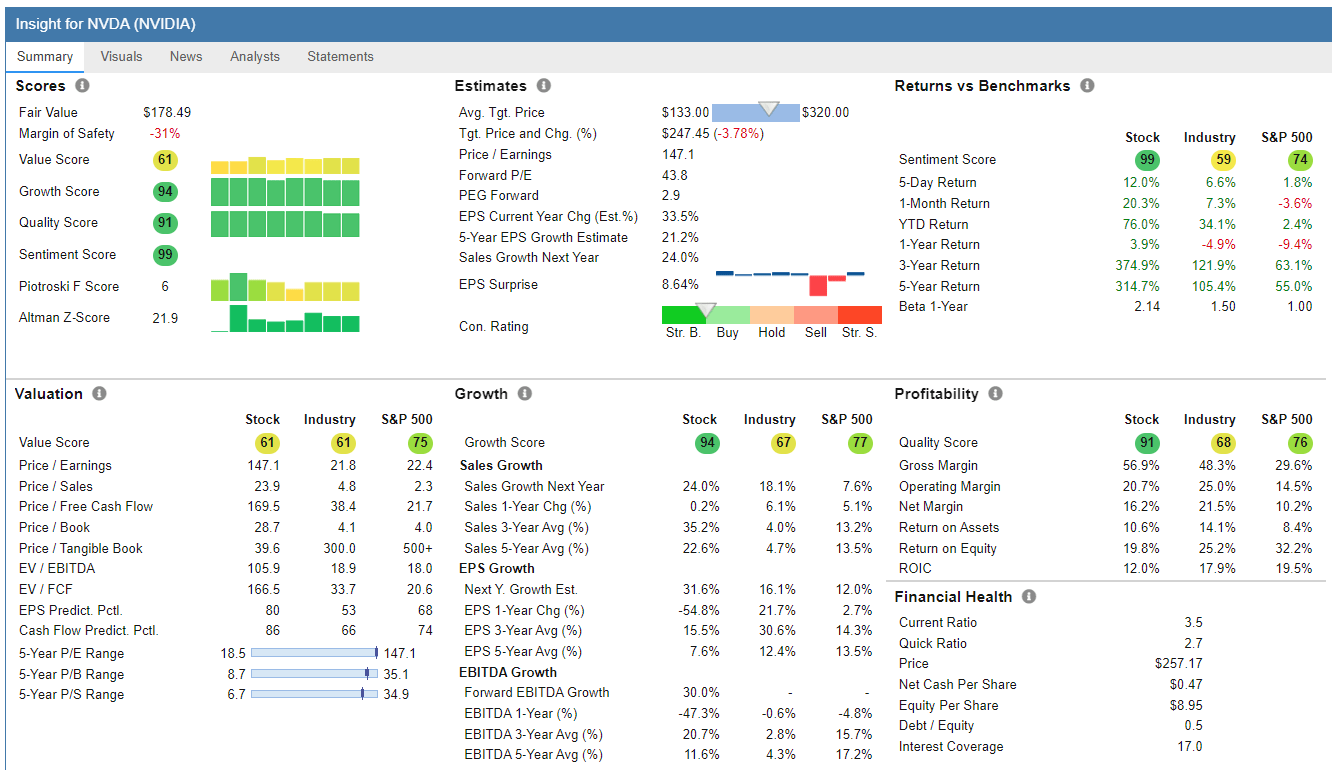
- NVIDIA ( NVDA ) - Technology / Semiconductors
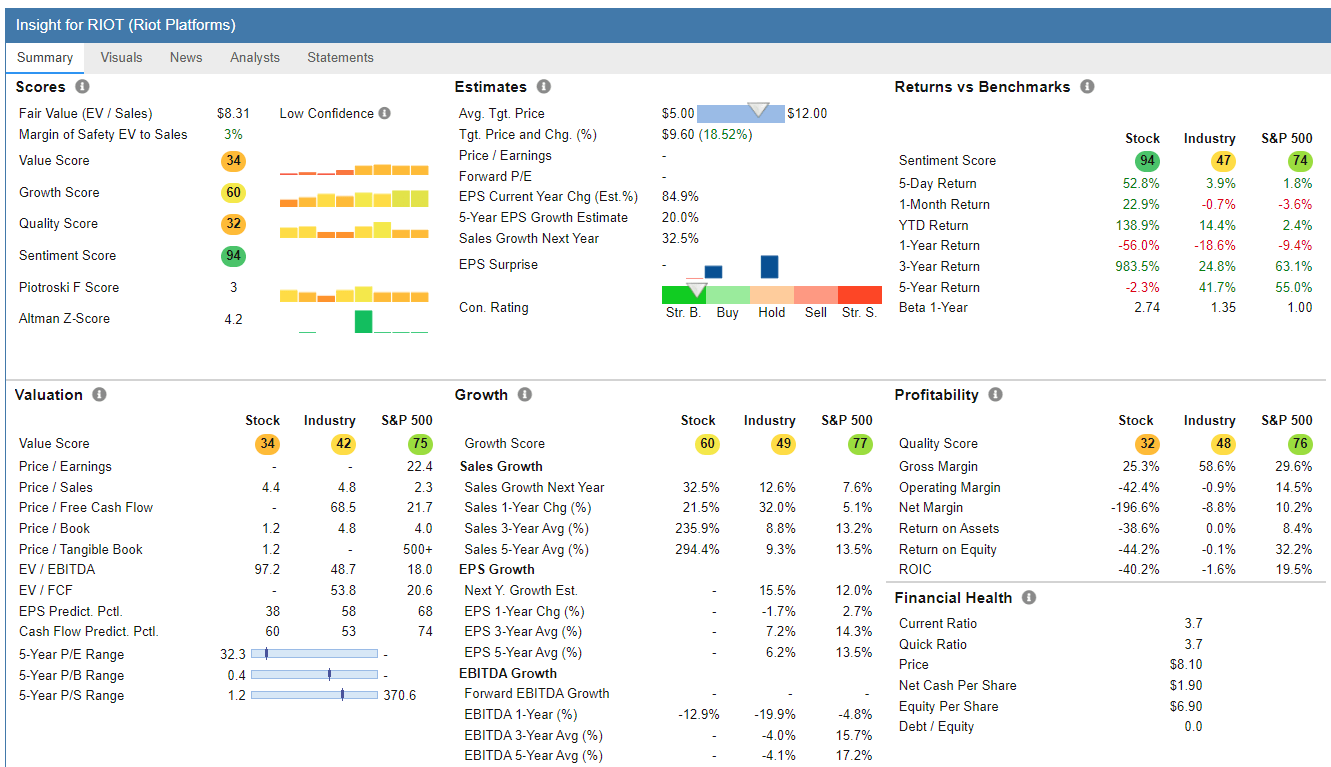
- Riot Blockchain ( RIOT ) - Technology / Software - Application
NVIDIA - Technology / Semiconductors
FinViz.com
Morgan Stanley upgraded to $304/share target this past Friday.
Price Target: $280.00/share (Analyst Consensus + Technical See my FAQ #20)
| Mar-17-23 05:38PM |
| Nvidia GTC event to showcase generative AI arms race MarketWatch |
| 05:00PM |
| Better Growth Stock: Nvidia vs. Apple Motley Fool |
| 04:01PM |
| Nvidia Stock Still Has Room To Run, Thanks To AI Spending, Analyst Says Investor's Business Daily |
| 03:47PM |
| 13 Best Automation Stocks To Buy Now Insider Monkey |
| 02:02PM |
| Can AMD Stock Break Out Over Major Resistance? TheStreet.com |
| 11:32AM |
| Nvidia's stock upgraded as AI deemed too much of a megatrend to ignore MarketWatch |
| 10:37AM |
| Microsoft ( MSFT ) to Add AI-Powered Co-pilot to Office 365 Suite Zacks |
(Source: Company Resources)
NVIDIA Corporation provides graphics, and compute and networking solutions in the United States, Taiwan, China, and internationally. The company's Graphics segment offers GeForce GPUs for gaming and PCs, the GeForce NOW game streaming service and related infrastructure, and solutions for gaming platforms; Quadro/NVIDIA RTX GPUs for enterprise workstation graphics; vGPU software for cloud-based visual and virtual computing; automotive platforms for infotainment systems; and Omniverse software for building 3D designs and virtual worlds
Riot Blockchain - Technology / Software - Application
FinViz.com
Price Target: $10.00/share (Analyst Consensus + Technical See my FAQ #20)
| Mar-13-23 05:48PM |
| 7 Blockchain Stocks Destined to Disrupt Traditional Industries InvestorPlace +17.92% |
| 04:10PM |
| Why Shares of Riot Blockchain, Marathon Digital, Hut 8 Mining, and Bitfarms Are Surging Today Motley Fool |
| Mar-08-23 03:50PM |
| 7 Stocks to Avoid Like the Plague as Market Heads Down from Here InvestorPlace |
| Mar-06-23 09:56AM |
| 3 Stocks Under $10 That Will Double in One Year InvestorPlace |
| Mar-03-23 09:00AM |
| Riot Announces February 2023 Production and Operations Updates GlobeNewswire |
(Source: Company Resources)
Riot Platforms, Inc., together with its subsidiaries, operates as a bitcoin mining company in North America. It operates through Bitcoin Mining, Data Center Hosting, and Engineering segments. The company also provides co-location services for institutional-scale bitcoin mining companies; and critical infrastructure and workforce for institutional-scale miners to deploy and operate their miners.
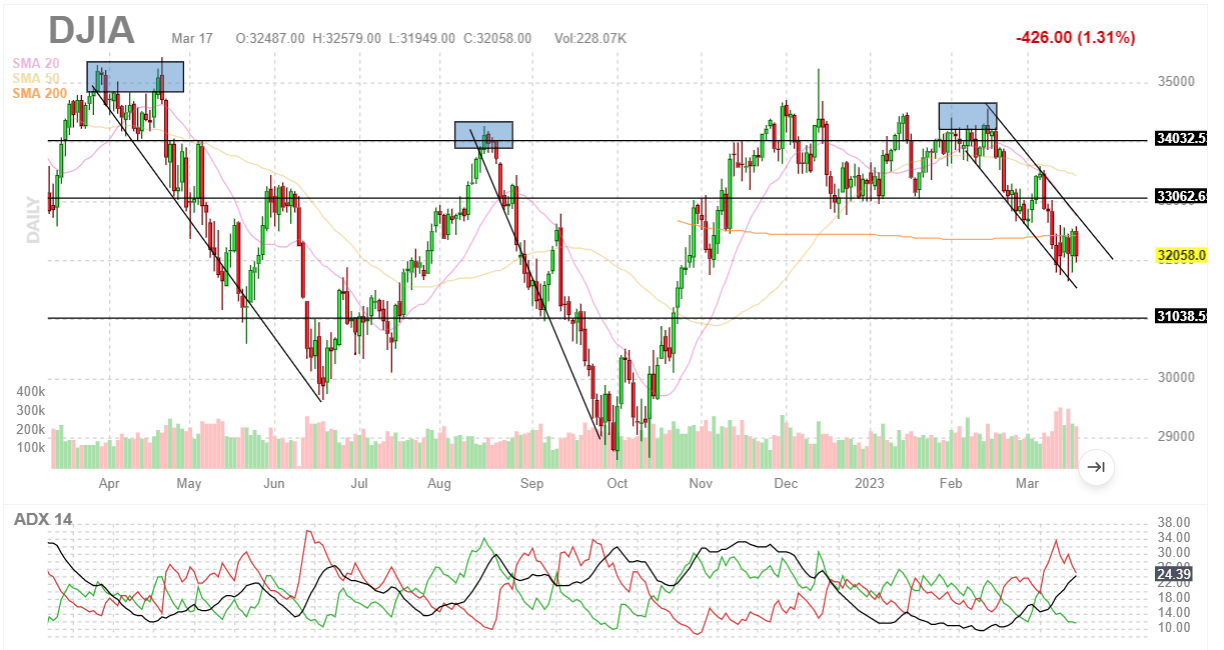
Top Dow 30 Stocks to Watch for Week 12
As detailed in the past few weekly articles the DJIA has moved into technical breakdown erasing all the gains back to November on the strong negative Momentum Gauge signals. The picks for next week are Microsoft and Intel Corp ( INTC ) but have greater risk while the major indices are in technical breakdown. The February market correction continues to follow the Momentum Gauge topping signals of April and August that reached new market lows. Rather than focus on the best of the worst Dow stocks this week I will share the current Momentum Gauge ETF top funds as we trade the Momentum Gauge signals.
The Momentum Gauge timing model changes between bull/bear funds following the signals at the start of the next day. Members are outperforming these returns following early signals and trading on the day of the signals. Top funds include ProShares Ultra VIX +30.65%, Direxion Daily S&P Biotech Bear ( LABD ) +25.6%, MicroSectors U.S. Big Bank Bear +26.5%, Direxion Daily Financial Bear +20.0%.
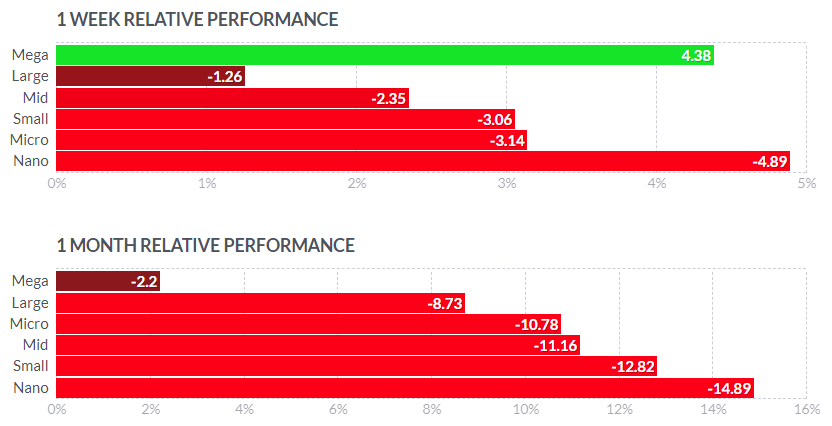
You will notice on the current negative signal for March that the Mega cap and Tech sector funds are behaving as a "safety trade" for now while the Financial and Energy sectors are showing economic recession warnings. That could change if the broader market selloff continues.
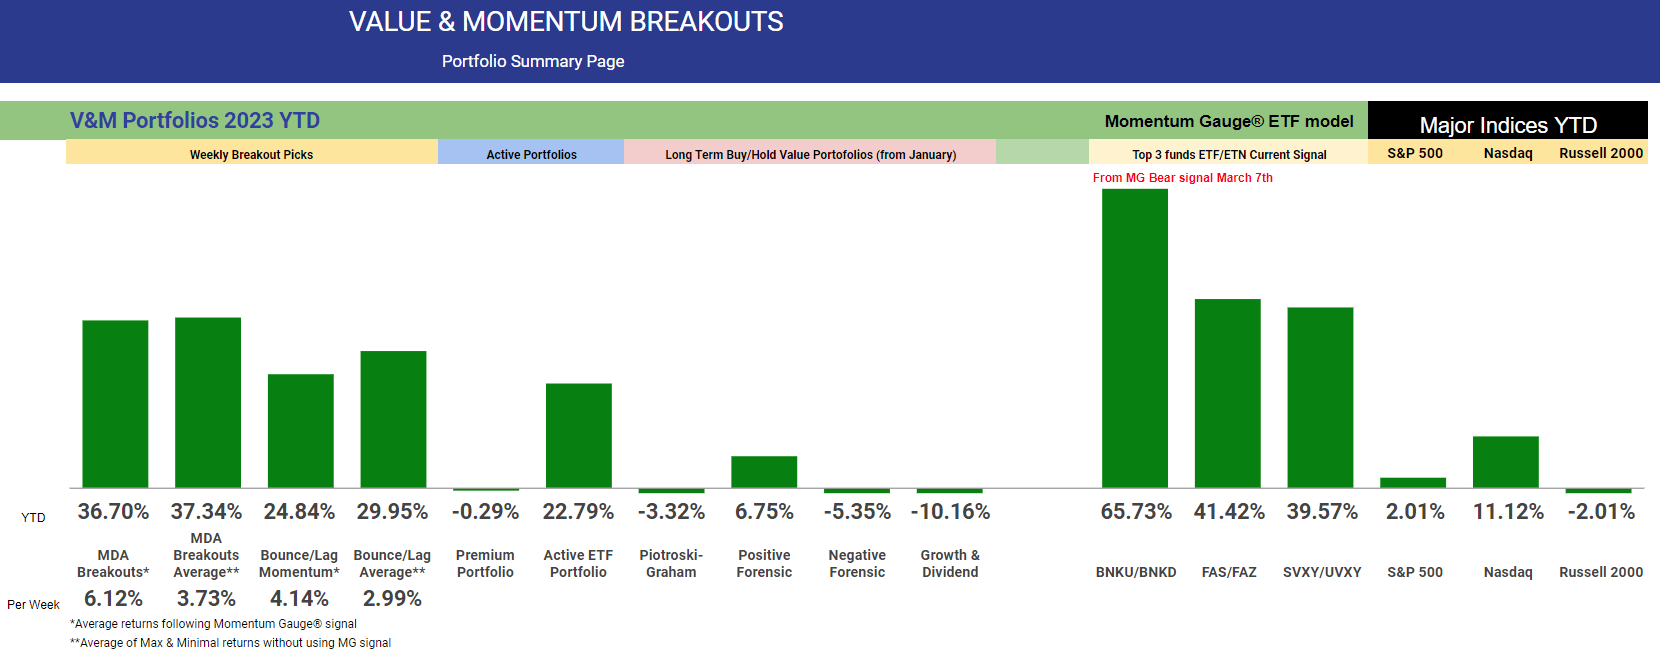
If you are looking for a much broader selection of large cap breakout stocks, I recommend these long term portfolios with consecutive years of beating the S&P 500 and achieving double-digit returns. However, we have moved to negative signals on the gauges and market declines may continue. The returns shown below are the 2023 YTD gains before the Negative signal for March. Showing again how much timing matters.
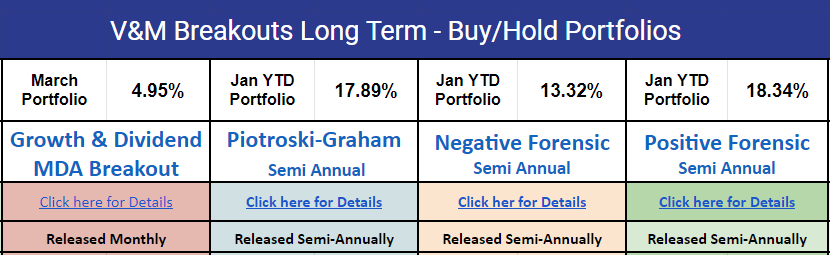
V&M Breakouts: Examining The Best Long Term Value Portfolios For Turbulent Markets
New 2023 Piotroski-Graham enhanced value -
- New January portfolio +17.89% YTD
- 2022 January portfolio beat the S&P 500 by +32.54%
- New January portfolio +18.34% YTD
- January 2022 Positive Forensic beat S&P 500 by +6.59%
- New January portfolio +13.32% YTD
- January 2022 Negative Forensic beat S&P 500 by +22.18%
New Growth & Dividend Mega cap breakouts -
- New March meg cap portfolio +4.95% YTD not including dividends
- January 2022 portfolio beat S&P 500 by +13.91%
These long term portfolio selections have significantly outperformed many major hedge funds and all the hedge fund averages since inception.
The Dow pick for next week is:
Microsoft
Microsoft has been extremely resilient through the sharp market declines from February. The enthusiasm and potential about AI and Chat GPT have helped propel the stock higher on strong net MFI inflows and large volume buying. Price is testing the top of the positive channel again around 280/share but could move higher on the current strong inflows.
FinViz.com VMBreakouts.com
Background on Momentum Breakout Stocks
As I have documented before from my research over the years, these MDA breakout picks were designed as high frequency gainers.
These documented high frequency gains in less than a week continue into 2020 at rates more than four times higher than the average stock market returns against comparable stocks with a minimum $2/share and $100 million market cap. The enhanced gains from further MDA research in 2020 are both larger and more frequent than in previous years in every category. ~ The 2020 MDA Breakout Report Card
The frequency percentages remain very similar to returns documented here on Seeking Alpha since 2017 and at rates that greatly exceed the gains of market returns by 2x and as much as 5x in the case of 5% gains.
VMBreakouts.com
The 2021 and 2020 breakout percentages with 4 stocks selected each week.
MDA selections are restricted to stocks above $2/share, $100M market cap, and greater than 100k avg daily volume. Penny stocks well below these minimum levels have been shown to benefit greatly from the model but introduce much more risk and may be distorted by inflows from readers selecting the same micro-cap stocks.
Conclusion
These stocks continue the live forward-testing of the breakout selection algorithms from my doctoral research with continuous enhancements over prior years. These Weekly Breakout picks consist of the shortest duration picks of seven quantitative models I publish from top financial research that also include one-year buy/hold value stocks.
All the V&M portfolio models beat the market indices again last year with consecutive yearly outperformance of the major indices the last 6 years. All new portfolios are in a strong start to 2023 with many portfolios already in double-digit returns. Remember to follow the Momentum Gauges® in your investing decisions for the best results.
Portfolio returns for 2022
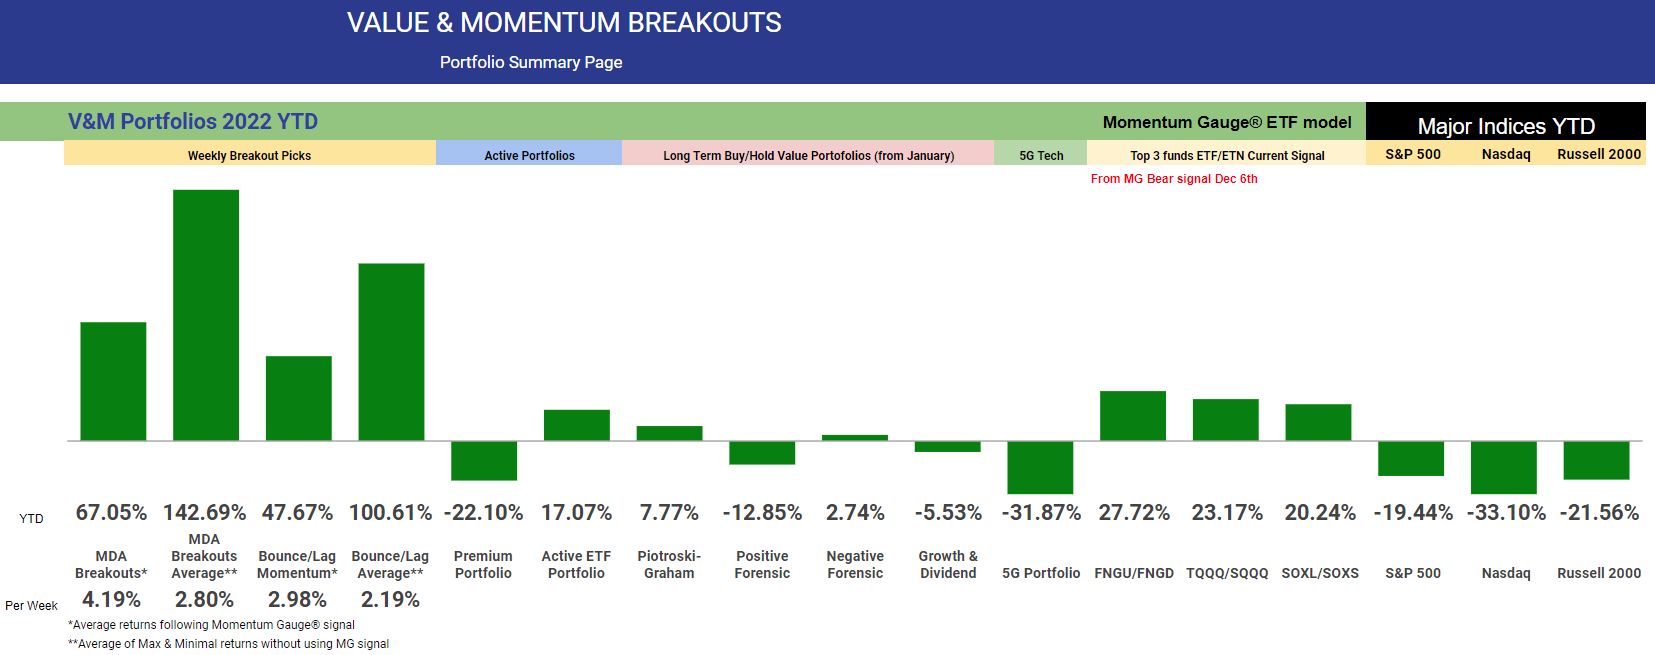
All the very best to you, stay safe and healthy and have a great week of trading!
JD Henning, PhD, MBA, CFE, CAMS
For further details see:
MDA Breakout Stocks/ETFs Week 12 - March 2023: High-Frequency Gainers To Give You An Edge