SVTRF - MFD: Utilities And Infrastructure Fund Discount Deepens Further
2023-04-12 13:05:09 ET
Summary
- MFD enjoyed a relatively calm 2022 when most other asset classes saw sizeable drops.
- The utility exposure that helped it out last year has been a bit weaker this year, but the fund has still provided some gains.
- The fund's deep discount could make it an interesting fund for investors looking to add some utility and infrastructure.
Written by Nick Ackerman, co-produced by Stanford Chemist. This article was originally published to members of the CEF/ETF Income Laboratory on April 10th, 2023.
Macquarie/First Trust Global Infrastructure/Utilities Dividend & Income Fund ( MFD ) has an extremely long name, but it tells us exactly what the fund is going for. First, it's advised by First Trust, with Macquarie (listed as Delaware Investments Fund Advisers) as the sub-advisor. Second, it clearly shows that the fund focuses on global infrastructure and utilities. Delaware, owned by Macquarie, recently merged their closed-end funds into abrdn funds . However, as First Trust advises MFD, it seems this fund will continue to exist as is.
In the last year, utilities and infrastructure were a relatively solid place to be invested, and that resulted in the fund experiencing minimal losses. The fund's infrastructure exposure tends to be allocated to oil and gas, so we know energy provided is one of the only places of positive performance. This year, utilities and energy haven't necessarily been the strongest as there has once again appeared to be a push towards growth investments.
That being said, MFD is also experiencing a discount widening since our last update, which could make it a fairly attractive option for investors. We would see essentially flat results on a total return basis, which factors in the fund's distribution.
MFD Performance Since Prior Update (Seeking Alpha)
We see that the fund would have lost around 3.5% on a price basis alone. However, the discount going from 9.80% to a now extended 13.19% is the largest factor for that decline. The NAV during this time, and therefore the actual underlying portfolio, increased during this period from $9.45 per share to $9.63.
The Basics
- 1-Year Z-score: -1.69
- Discount: -9.80%
- Distribution Yield: 9.88%
- Expense Ratio: 1.75%
- Leverage: 25.08%
- Managed Assets: $109.8 million
- Structure: Perpetual
MFD's investment objective is "to provide a high level of current return consisting of dividends, interest, and other similar income while attempting to preserve capital." To achieve this, the fund will "invest predominantly in the securities of companies that are involved in the management, ownership, and/or operation of infrastructure and utilities assets, and are expected to offer reasonably predictable income and attractive yields. The Fund also invests in senior secured loans generally considered to be high-yield securities."
MFD is quite a small fund, which can make it difficult for larger investors to invest in with lower volume. The fund's expense ratio is also quite high, which isn't that uncommon for global funds. The total expense ratio comes to 2.66% when including the leverage expenses. The fund's leverage isn't too elevated, but either way, it still increases potential risks and volatility.
Additionally, as interest rates were and still are expected to increase further, the costs of leverage have also increased. That's why we've seen the total expense ratio start to climb over the last year. The fund pays SOFR plus 0.95%. The average interest rate in the prior fiscal year was 2.21%, with the ending interest rate as of November 30th, 2022, at 4.76%. That compares to the 0.95% it was in the prior year. That highlights just how substantial the jump has been in borrowing costs.
Performance - Attractive Discount
The discount expansion has meant that the fund's z-score is also expanding, which is why we've seen the 1-year z-score come to -1.69 now. The z-score is a measure of where the fund's current discount is relative to the fund's average discount for the given period. The 1-year z-score can be a helpful measure in the short term, but the longer term is also incredibly important.
While we can see that the fund has experienced trading at a significant discount for an extended period of time, we can also see the fund's discount is wider than usual, even on this longer-term basis. This is a look at the fund's average discount over the last decade, along with the fund's highest and lowest premium/discount during this time.
YCharts
As a utility/infrastructure fund, an investor could have the urge to compare it to the more popular Reaves Utility Income Fund ( UTG ) and the Cohen & Steers Infrastructure Fund ( UTF ). Over the longer term, we can see that MFD has significantly underperformed if we are looking at a comparison.
YCharts
We can see that most of the underperformance started to stem from the 2015/2016 period, which coincides with when oil prices started to decline. That's what makes MFD a bit more of a unique infrastructure fund and sets it apart from UTG or UTF. Also, having a more significant focus on global investments is another distinguishing factor. UTF has a global focus too, but it isn't at the same level as MFD.
When looking at 2022 performance specifically, it would appear that MFD did come out on top. This was more noticeable in the first half of the year, but UTF started to close the gap by the end of the year.
YCharts
In the last rolling one-year period, we see that MFD is still the better performer in terms of its NAV results. However, on a total share price basis it is the worst.
YCharts
The case that could be made is that MFD's discount is much more attractive than UTF's at this time. This is precisely due to the fact that MFD's NAV had been holding up better than the share price.
The case against UTF is that UTF trades at only a slight discount. Still, UTF has proven to have a solid track record. Past performance is no guarantee of future results, but the UTF portfolio still gives me confidence. My main point is that I wouldn't necessarily see selling out of UTF or UTG to buy MFD, but it could be seen as a compliment for an investor looking to add some new infrastructure exposure on the global side.
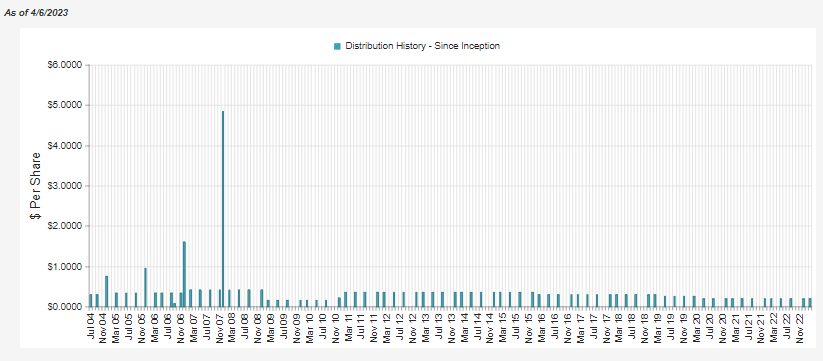
Distribution - Coverage Declines
MFD pays a quarterly distribution, which some investors tend to avoid as they prefer monthly payouts. The fund also has several distribution cuts in its history, making sense as the fund's energy and global exposure were both poor historical performers in most of the last decade. It was really now in the last couple of years that energy was a positive contributor to the fund's performance.
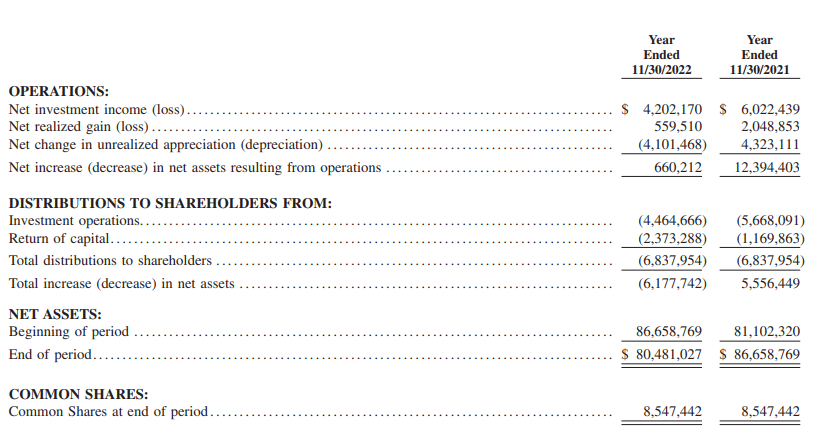
Perhaps it is worse news that we've seen the distribution coverage fall. As we noted above, the fund has been experiencing higher leverage costs, and that has translated into reduced net investment income. Year-over-year, we've seen NII decline by 30.22%.
Perhaps on a brighter note, that still translated into NII coverage of 61.45%. Since they also experienced relatively reduced losses in the prior year, that would have also meant less erosion to the assets. 61.45% might appear low, but if we go back to UTF, we can see that their NII coverage in the prior year was 27.08%. So they would actually require more capital gains to fund their distribution.
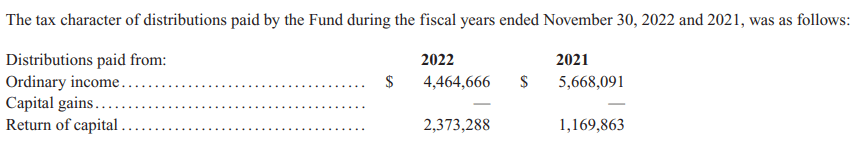
Due to a lack of distribution coverage, it does make sense that we would see return of capital in the fund's distribution. We've seen that in each of the prior two years.
However, since they also hold exposure to MLPs, some return of capital is going to be natural as MLPs distribute out ROC distributions themselves. In fiscal 2022, they listed that return of capital received from investments in MLPs was around $827k.
Beyond that, it would suggest that the rest of the ROC here could be considered destructive in 2022. That being said, in 2021, we saw that NII and realized gains were more than enough to cover the total distributions for that fiscal year. That would suggest that the ROC in that year wasn't destructive since it was covered via gains and income.
MFD's Portfolio
Some funds are labeled as global funds but will still carry the majority of their portfolio in U.S. investments. Historically, that has been the better bet for most of the last decade when choosing investments. MFD places more emphasis outside of the U.S., with less than 50% allocated there. That being said, U.S. exposure is still by far the fund's largest exposure.
MFD Country Breakdown (First Trust)
Following that, we have the U.K. as having the second largest exposure. Just a few different holdings largely contribute to this. When looking at the top holdings, we have Severn Trent PLC ( SVTRF ) and National Grid PLC ( NGG ) from the U.K. Severn is listed as a water utility, and National Grid is a multi-utility.
MFD Top Ten Holdings (First Trust)
Within the top ten, we also have United Utilities Group PLC ( UUGRY ), another water utility located in the U.K. Those three positions alone make up nearly 18% of the fund, contributing significantly to the ~24% U.K. allocation.
In fact, this also highlights how concentrated MFD is in its top ten holdings. The top ten here make up nearly 49% of the portfolio. CEFConnect lists only 48 different positions. A higher concentrated portfolio means that they have to get their calls right more times than not.
That can lead to outperformance over time, but conversely, it also can lead to underperformance should they not be as successful. While they had more of a global focus and energy exposure relative to UTG and UTF historically, that is an example of poor investment choices. Electric utilities comprise the fund's largest component; then, we see oil and gas as the second largest weighting. The water utility exposure here is also interesting and unique, as other funds don't tend to see that type of utility as a meaningful contributor to the allocation of the fund.
MFD Industry Sector Allocation (First Trust)
The fund had the flexibility to invest similarly to UTG and UTF but chose not to. Thus, historically, they underperformed as they focused more heavily on energy exposure. UTF and UTG carry some energy exposure, but it isn't as large of a focus. UTG similarly carries a fairly narrowly focused portfolio at around 44 holdings. UTF carries a significantly larger number of holdings; CEFConnect lists it at 258.
Conclusion
Longer-term MFD had been a laggard in the infrastructure CEF space relative to the more popular UTG and UTF. This seems to have stemmed from the larger focus on global investments and energy investments. More recent results in 2022 saw MFD as the better performer, but it certainly wasn't to an overly large extent. MFD's most interesting characteristic appears to be the fund's significant discount. While the fund is consistently trading at a discount, the discount at this time seems to be rather large compared to its historical average. That could make it a fairly interesting fund to consider if one is looking for a more global infrastructure-tilted fund.
For further details see:
MFD: Utilities And Infrastructure Fund, Discount Deepens Further