MCI - My 9% Income Portfolio-Living Off Dividends
2024-01-02 21:31:55 ET
Summary
- Total Return is the actual rate of return for an investment over a given evaluation period, typically one, three, five, or ten years.
- The Total NAV Return is the sum of all dividends/distributions, assuming they are reinvested, plus the change in the NAV of the fund, be it positive or negative.
- However, managing our portfolio is not only about applying financial rules, because it is not certain that dividends can and will always be reinvested.
- For me, investing is researching and selecting securities that offer a steady cash flow, regardless of their redeployment, while at the same time increasing initial capital.
- There are securities in my portfolio that meet these requirements and others that show a negative NAV performance since launch. I will cover this in my article.
Sardinia Like Childhood
In 1932, a leading narrator of the Italian twentieth century, Elio Vittorini (1908-1966), participated in a sort of “literary cruise” to Sardinia, organized by a major Italian magazine with the intention of awarding a prize for the best travelogue on the island. Out of this experience came a slim, delightful volume published a few years later under the title Sardinia Like Childhood , a short reportage on regaining the authenticity of life. In fact, the work was born from the deep frenzy of living and knowledge gained through encounters with nature, villages, people, and traditions of Sardinia.
Sardinia is not just an island, but a figurative continent, which this book transformed into a state of mind. If we analyze its past, we realize that its prehistory is more evident. The influence of the megalithic culture, formed by monoliths, dolmens, archaic temples for purification, and thousands of Nuragic towers, is stronger than historical developments, represented mainly by Romanesque churches from the medieval period and Gothic Catalan works of the fifteen and sixteenth centuries. Here, then, an archaeological site, a village, or a parish church become starting points for a journey through time, measured in millennia. An unusual, frightening order of magnitude.
Total Return in a Nutshell
In everyday life, our time horizon normally encompasses a span of months, years, more rarely decades. In some circumstances, the latter may be the most significant unit of time, as in the case of stock and bond funds that provide annual Total Return values summarizing the last ten years of operation.
Total Return is the actual rate of return for an investment over a given evaluation period, typically one, three, five, or ten years. The longer the period of time taken into consideration, the more reliable the evaluation of the performance will be. In the case of Closed-End Funds, the Total Return on Net Asset Value is calculated based on the sum of distributions plus the change in the NAV of the fund, be it positive or negative, over a given time period.
Total Return is thus the total given by capital appreciation plus the receipt of distributions, which are calculated to be reinvested on the day of payment, thus participating in increasing total return through the mechanism of compound interest.
This is what would happen from a technical point of view, assuming that distributions are always reinvested. However, our investment decisions often involve factors outside the technical aspects. It is not necessarily the case that distributions can always be reinvested unless it is our sole objective to grow the portfolio.
In fact, I am convinced that many of us use dividends or distributions (in whole or in part) as a complementary source of income, and this fact can change the perspective on Total Return. As the commentary on one of my articles from a few months ago stated: “Those of us who invest in high-income vehicles are smart enough to know what we are getting and what we are giving up. We are not trying to beat the market, just wanting to live off our dividends and distributions.”
Living off dividends and distributions often means not slavishly applying what spreadsheets or financial rules dictate, rather it is making dividend reinvestment a discretionary choice. Or at least it should be, unless we have in our portfolio CEFs or ETFs in free fall, for which dividend reinvestment seems to be the only lifeline that can keep them afloat in the hope of salvaging the salvageable.
From my point of view, our effort as investors should be to avoid “forced” dividend reinvestment, but, instead, to research, study, and select securities that can enable us to have a constant cash flow, regardless of reinvestment, with an increase in the value of initial capital at the same time. The Occam’s razor principle suggests that we should always favor the simplest solution: so, why invest in losing securities when there are winning ones?
Invert, Always Invert
The inversion rule is a simple and powerful mental model, although rarely used because it is counterintuitive: if I want to get X, instead of thinking about the actions I need to take to get to that goal, it is often simpler to start by inverting the problem. That is, try to identify those elements that would lead me to get the opposite of X. Thus, in our case, the first step would be a negative screening, aiming to exclude all securities with unsuitable characteristics (losers), to leave only those that meet our requirements (winners).
So, for me, having a clear idea of all the errors to be avoided is the most important thing to form one’s portfolio. For this reason, there is nothing wrong with being wary of securities whose NAV is constantly declining, when it is possible to buy more effective others, that in addition to the dividends paid have also grown over time, thus creating added value. Of course, in both cases, the loss of purchasing power due to inflation must be considered, but when it comes to steadily declining securities, this is also added to the loss of value of the security.
Mine is not “overreliance on past data as a signal to future conditions” (Morgan Housel). Here it is not a matter of using the past to deduce rules of behavior or general trends, which by their nature are constantly changing. Rather, it is a matter of observing and evaluating the only available data in my possession. That is, the data relating to the path taken by each security over its lifetime, as an outcome of the ups and downs of the market and the choices made by its managers. Unfortunately, future returns and trends have not yet been published… otherwise I would use those.
I admit these considerations are based on historical trends: we Italians have this historicist approach, which often affects us but also has its value. In the field of investment, it is well known that past performance cannot predict future results due to the unpredictability of stock markets. But if dividend investing means generating wealth through income and capital growth, in my opinion, it is essential to study the track record of the securities I am interested in, so as to exclude at least those that in their past have never reflected these characteristics.
While it is true that luck has a decisive impact on short-term results, the more we broaden the picture, the more a security’s performance will reflect the quality of the decision-making processes behind the choices made by its managers, which in turn will allow for better results in the long run.
Whether I have succeeded in putting these lessons into practice is another matter, so much so that, as we shall see, my portfolio has a certain number of CEFs and ETFs that are suffering in this respect: some do not cause me any concern, while others I am beginning to doubt whether they can turn around. So, let’s now look at the securities of my overall portfolio to see where I stand on this long road to the coveted “harmony of purpose” between capital growth and dividends collected.
My Overall Portfolio
As you may know, my investments are divided into three different portfolios that today include 28 securities (19 CEFs, 5 ETFs, 3 BDCs, 1 ETN) after the addition of small shares of FDUS and MCI, which I decided to reorganize more evenly with some minor shifts.
Cupolone Income Portfolio (named after Brunelleschi’s Florentine dome) consists of seventeen CEFs with monthly distributions.
- BlackRock Science and Technology Trust ( BST ))
- Calamos Dynamic Convertible and Income ( CCD )
- Calamos Global Total Return ( CGO )
- Eaton Vance Enhanced Equity Income II ( EOS )
- Eaton Vance Tax-Adv. Global Dividend Opps ( ETO )
- Eaton Vance Tax-Adv. Dividend Income ( EVT )
- Guggenheim Strategic Opportunities ( GOF )
- John Hancock Tax-Adv. Dividend Income ( HTD )
- PIMCO Corporate & Income Strategy ( PCN )
- PIMCO Dynamic Income ( PDI )
- John Hancock Premium Dividend ( PDT )
- PIMCO Corporate & Income Opportunities ( PTY )
- Cohen & Steers Quality Income Realty ( RQI )
- Special Opportunities Fund ( SPE )
- Cohen & Steers Infrastructure ( UTF )
- Reaves Utility Income Trust ( UTG )
- XAI Octagon FR & Alt Income Term Trust ( XFLT )
Giotto Income Portfolio (named after the fourteenth-century Florentine painter and architect) includes five ETFs and one ETN that adopts a covered-call strategy:
- JPMorgan Equity Premium Income ( JEPI )
- JPMorgan Nasdaq Equity Premium Income ( JEPQ )
- Global X NASDAQ 100 Covered Call ( QYLD )
- Global X Russell 2000 Covered Call ( RYLD )
- Credit Suisse X-Links Crude Oil Shares Covered Call ETNs ( USOI )
- Global X S&P 500 Covered Call ( XYLD )
Masaccio Income Portfolio (named after the founder of Renaissance painting) contains three BDCs and two CEFs with quarterly distributions.
- Ares Capital ( ARCC )
- Crescent Capital BDC ( CCAP )
- Fidus Investment ( FDUS )
- Barings Corporate Investors ( MCI )
- Royce Value Trust ( RVT )
As I said, in October, I bought some shares of Fidus Investment , despite its inefficiency from a fiscal point of view for me as an Italian, and Barings Corporate Investors , with book prices of $17.79 and $15.89, respectively. Since then, the market price of these two securities has risen to $19.70 and $18.40. This has somewhat restrained me from continuing my purchases, also given that their last two distributions are the highest ever for both: $0.80 for FDUS and $0.38 for MCI. The fear that the price flare-up is related to such large amounts is causing me to proceed with caution, fearing a pullback should distributions return to their historical average since both pay a variable dividend.
Just Tell Me the Bad News
At Berkshire, we believe in Charlie’s dictum –Just tell me the bad news; the good news will take care of itself– and that is the behavior we expect of our managers when they are reporting to us.” (Warren Buffett, 1995 annual letter)
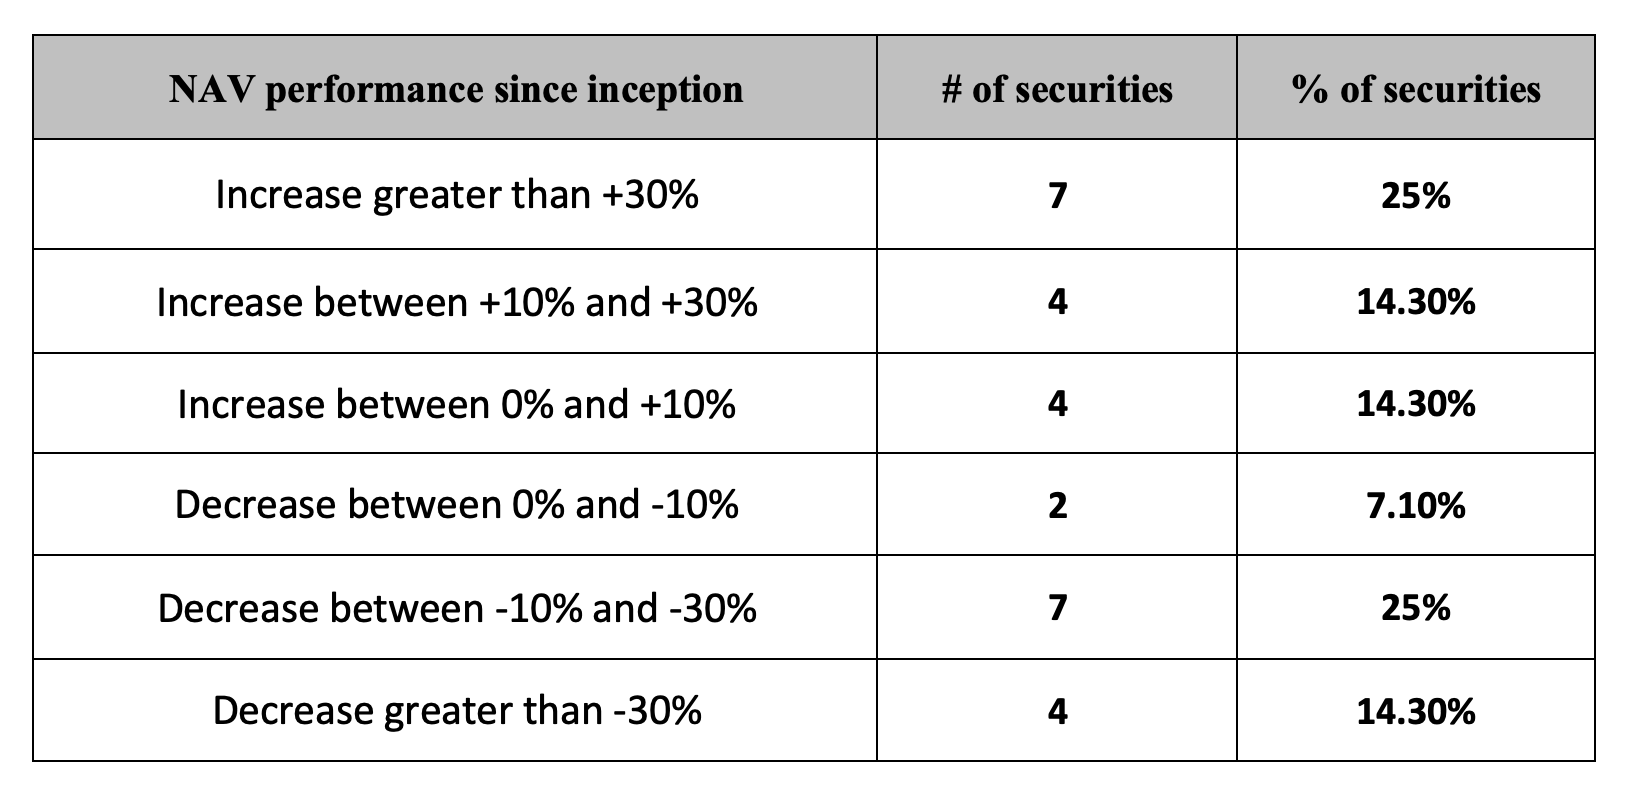
This is the summary picture regarding the NAV since launch performance of all the securities in my portfolio, divided into six ranges ( please note that with regard to the three BDCs, I decided to report the price and not the NAV, due to the lack of charts covering the trend of the underlying assets):
Author
As can be seen, 13 out of 28 securities are showing a loss since launch, but I would say the bad news concerns five of them in particular, whose NAVs show not only a worrying negative performance but above all an inexorable downward trend that has persisted for years now and seems to leave little hope for recovery, at least in the short term.
Let’s look at them in detail:
- Guggenheim Strategic Opportunities
- PIMCO Dynamic Income
- Global X NASDAQ 100 Covered Call
- Global X Russell 2000 Covered Call
- XAI Octagon FR & Alt Income Term Trust
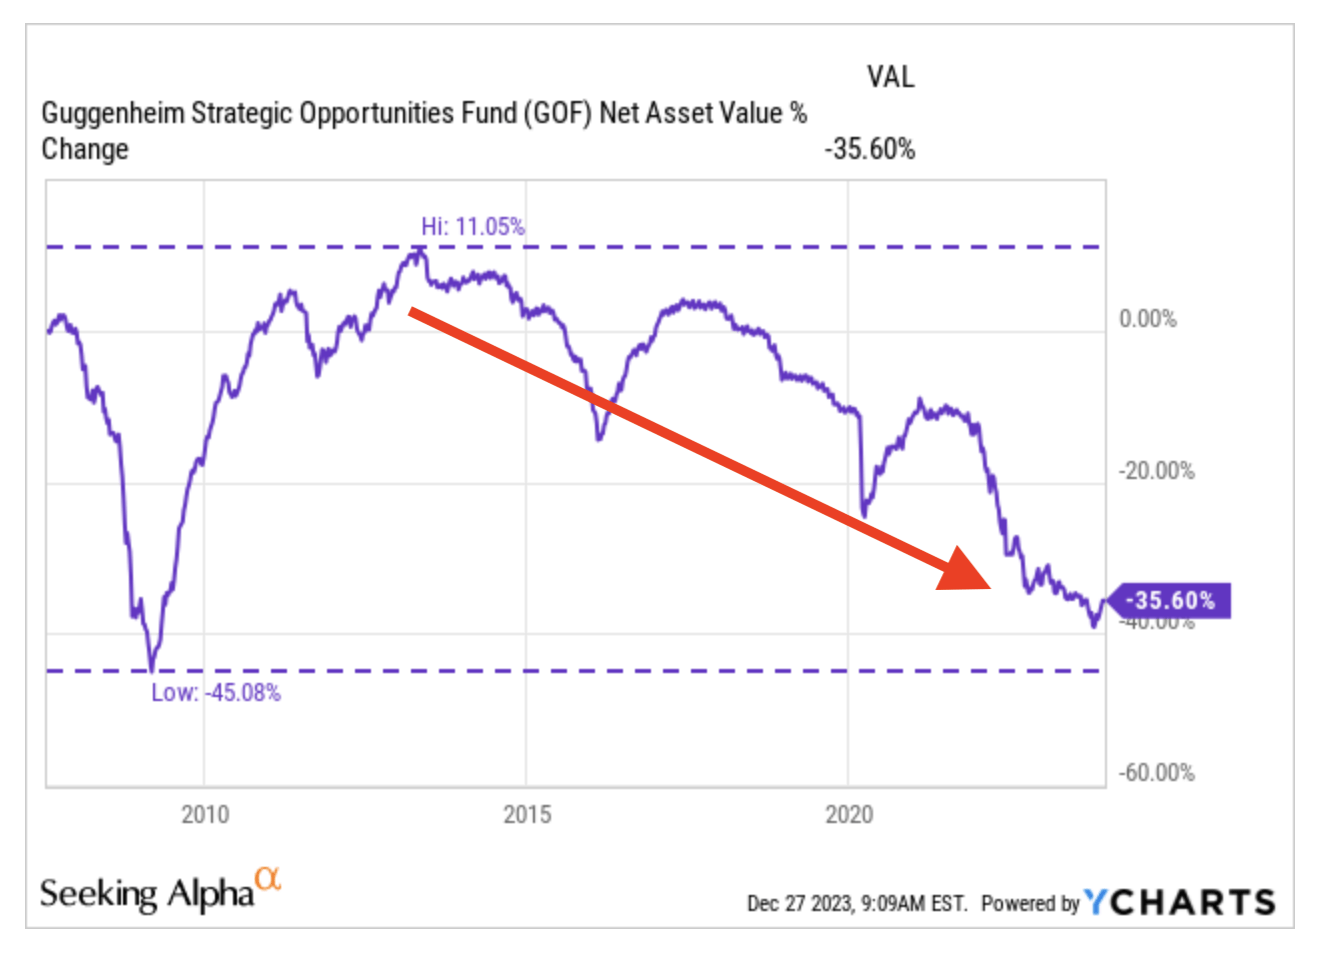
Guggenheim Strategic Opportunities
GOF ( YCharts )
As can be seen, the downward phase was inaugurated a decade ago and there is nothing to suggest that it has ended. The current distribution, at around 17% over market price, is perforce unsustainable without a continuous return of capital (ROC). Some authors on SA are optimistic about its future, but I am less positive to the extent that this CEF currently occupies only 2% of my portfolio. Getting out of it altogether would lead me to discrete losses, which are difficult to offset under the Italian tax system. So at the moment, I am holding the position, albeit with many doubts.
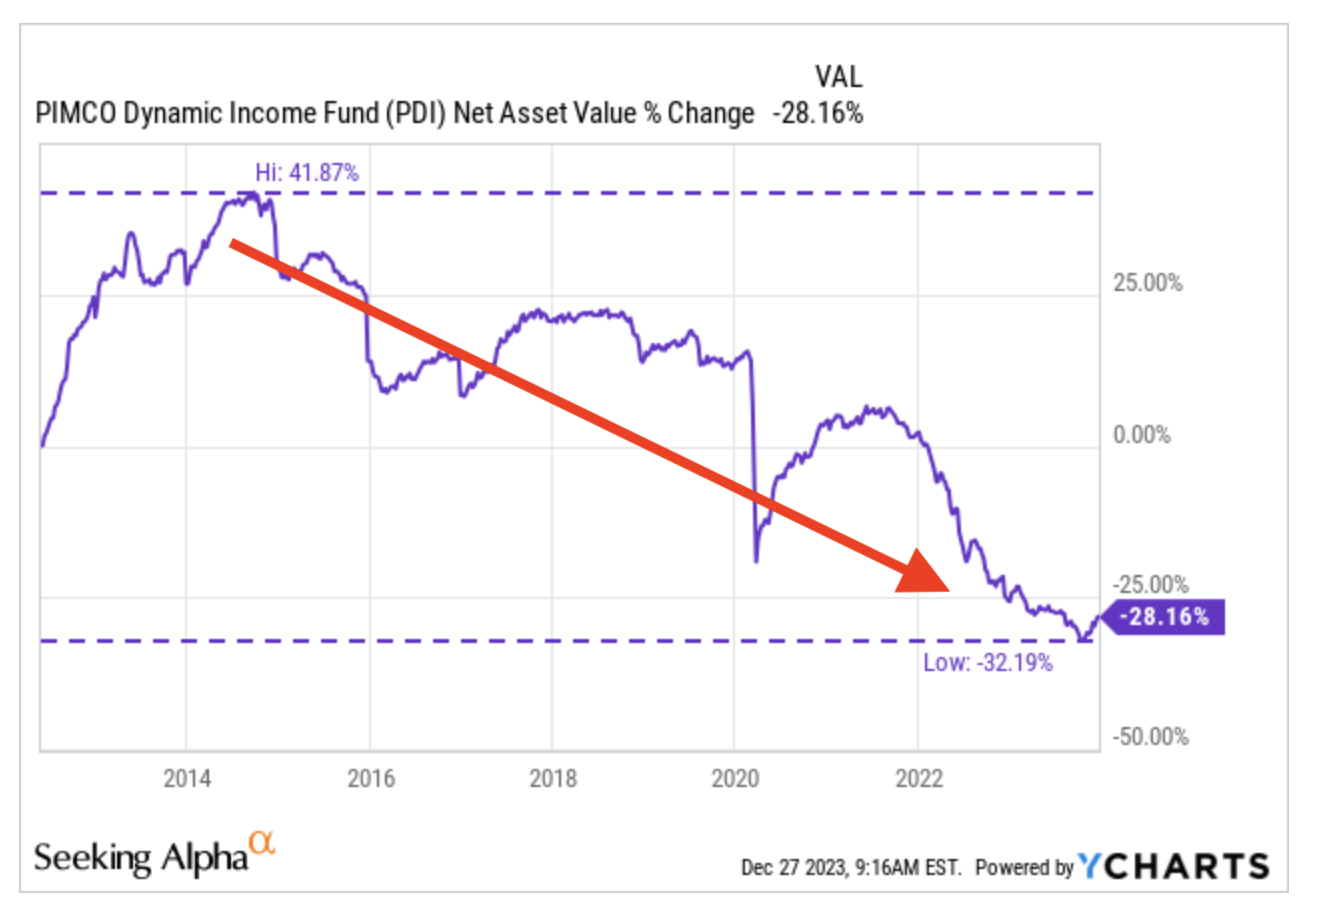
PIMCO Dynamic Income
PDI ( YCharts )
Nearly a decade of continuous descent for PDI as well, albeit interspersed with substantial rebounds. The arrow remains pointed downward, but unlike GOF (at least according to reports on CEFConnect and Morningstar), there appears to be no recourse to return of capital at the moment. This is despite a distribution of more than 14 percent raising well-founded doubts about its sustainability. The same question was asked a year ago, yet PIMCO’s managers impressed everyone with a hefty special dividend at the end of 2022, proving they can hold the baton. At the moment I maintain my position, trusting in the market’s recovery and the skill of the managers.
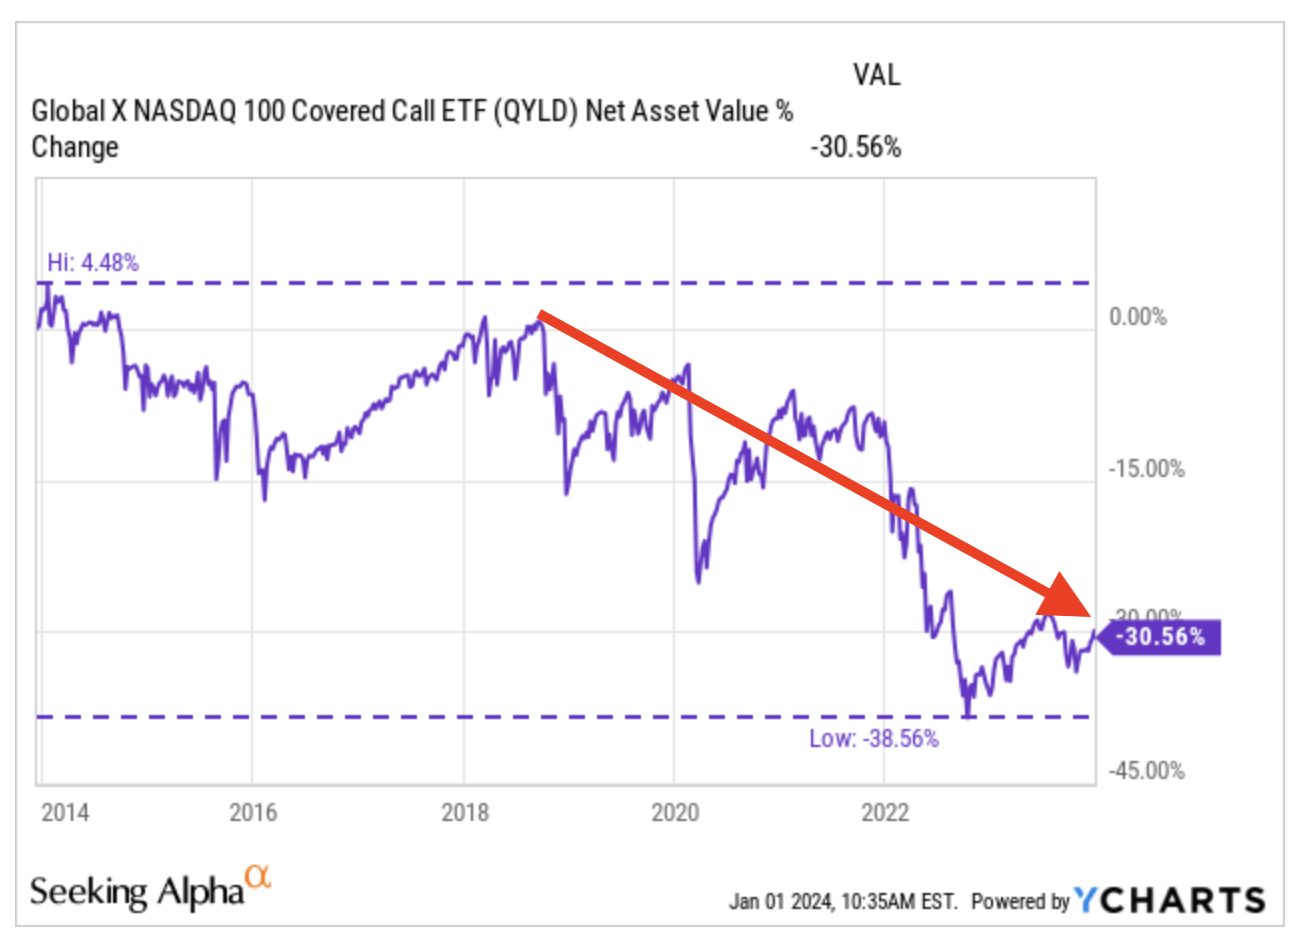
Global X Nasdaq 100 Covered Call
QYLD ( YCharts )
Heading downward is QYLD, a nearly 8 billion capitalization ETF with a covered call strategy on the NASDAQ. Despite the decline since 2018, I remain moderately confident about the possible recovery of this stock, which has nevertheless shown surprising vitality in the past few years. Nothing suggests to me that the course can be reversed, but I personally have no intention of abandoning the ship, at least for the time being.
Global X Russell 2000 Covered Call
RYLD ( YCharts )
The same goes for RYLD, an ETF with a covered call strategy on the Russell 2000. Despite the steep decline over the past two years, I remain moderately confident about the possible recovery of this stock, which has apparently suffered from the negative performance of its benchmark index. For the time being, I am holding the position, trusting in an upcoming upturn in U.S. small-cap companies.
XAI Octagon FR & Alt Income Term Trust
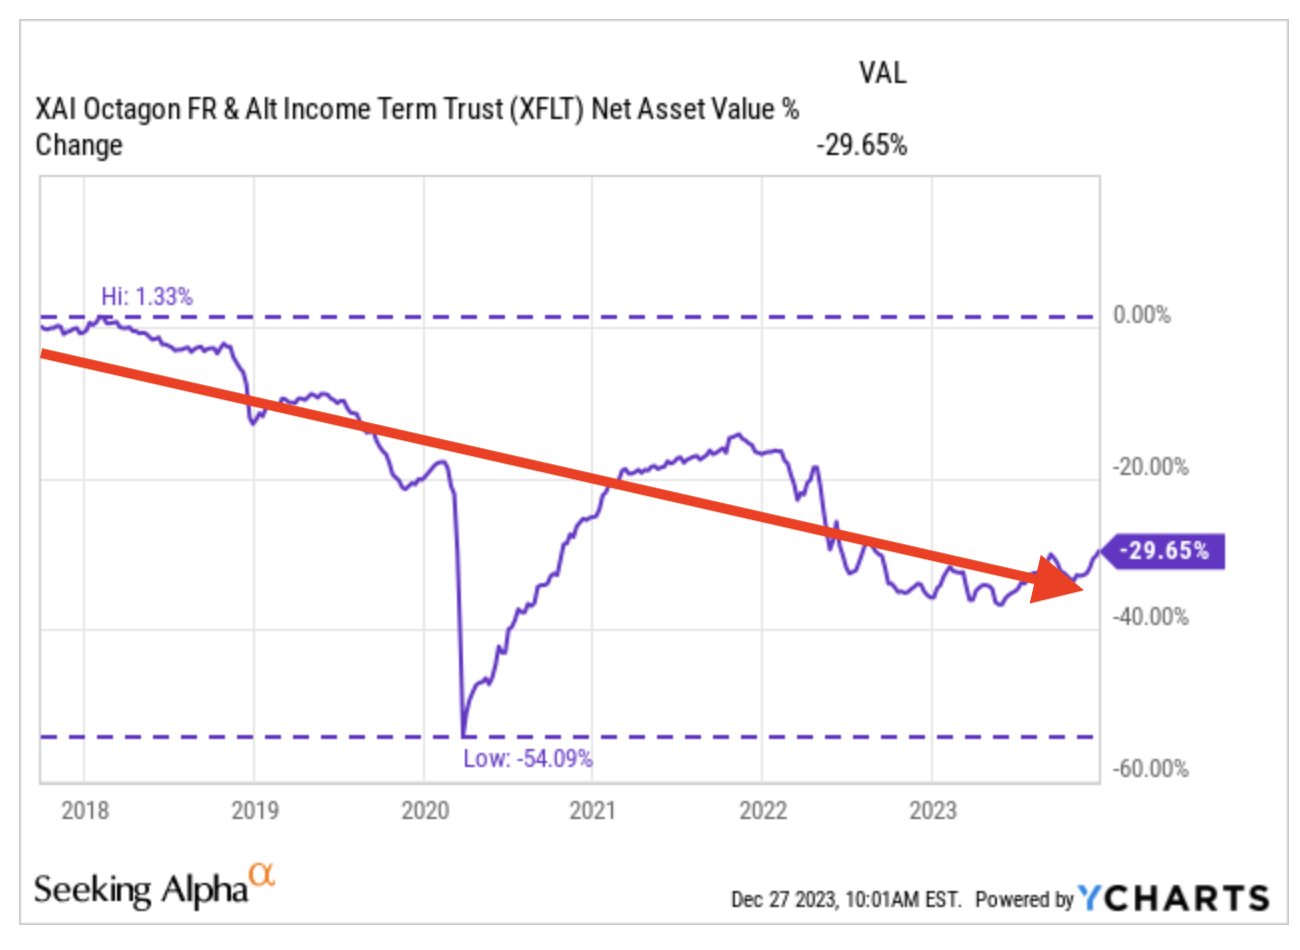
XFLT ( YCharts )
XFLT is a CEF that invests in Collateralized Loan Obligation ((CLO)). Personally, I am only at a loss of a few percentage points on this stock, having built up my position starting from the second half of 2021. In any case, which does not detract from the fact that its performance leaves me somewhat perplexed since the high was marked shortly after the launch, and only waning period highs have followed since then. The recent rise makes me confident in a possible recovery, so I have decided to hold on to my position, benefiting in the meantime from a dividend yield in excess of 13 percent. I hope the fund can afford it; other authors on SA, more knowledgeable than I am on this subject, vouch for its sustainability, and I have decided to trust them.
In this brief analysis, I have deliberately left aside USOI , an ETN also with a covered call strategy, which provides a return linked to the performance of the Credit Suisse Nasdaq WTI Crude Oil FLOWS 106 Index. Although its loss since launch exceeds 85%, its descent has slowed down a lot over the past three years, which prompted me to include a small amount in my portfolio because of its peculiar dividend feature for me as an Italian. It is the only stock in my portfolio that can offset my past losses: let’s say its coupon is “tax-free” for me.
In Midstream
For the other seven stocks with negative performance, two show a loss of less than 5 percent:
Special Opportunities Fund
SPE ( YCharts )
Global X S&P 500 Covered Call
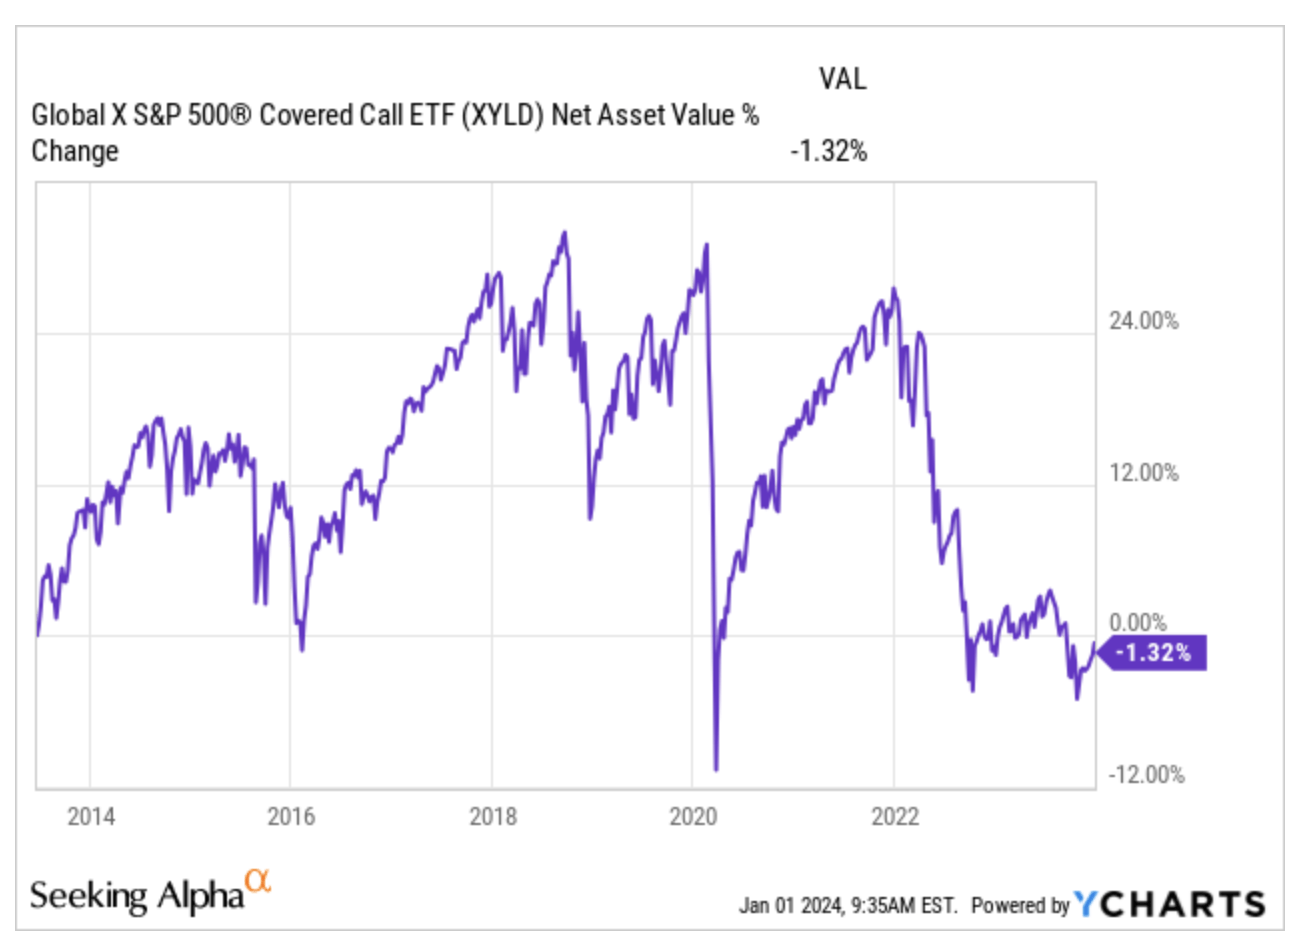
XYLD ( YCharts )
Five others instead have losses exceeding 10 percent, but I find their performance much less worrisome than that of the CEFs and ETFs just examined. Let’s also look at these five securities in detail so that I can explain why, all in all, they do not worry me that much, even though they are in midstream and the loss of nominal value relative to invested capital when added to the loss of purchasing power due to inflation would make them losing bets in the long run.
- Calamos Dynamic Convertible and Income
- Calamos Global Total Return
- PIMCO Corporate & Income Strategy
- PIMCO Corporate & Income Opportunities
- Cohen & Steers Quality Income Realty
Calamos Dynamic Convertible and Income
CCD ( YCharts )
Overall negative performance but with a notable bubble between mid-2020 and mid-2022. A vital, responsive stock, I continue to hold it in my portfolio despite its not entirely satisfactory performance.
Calamos Global Total Return
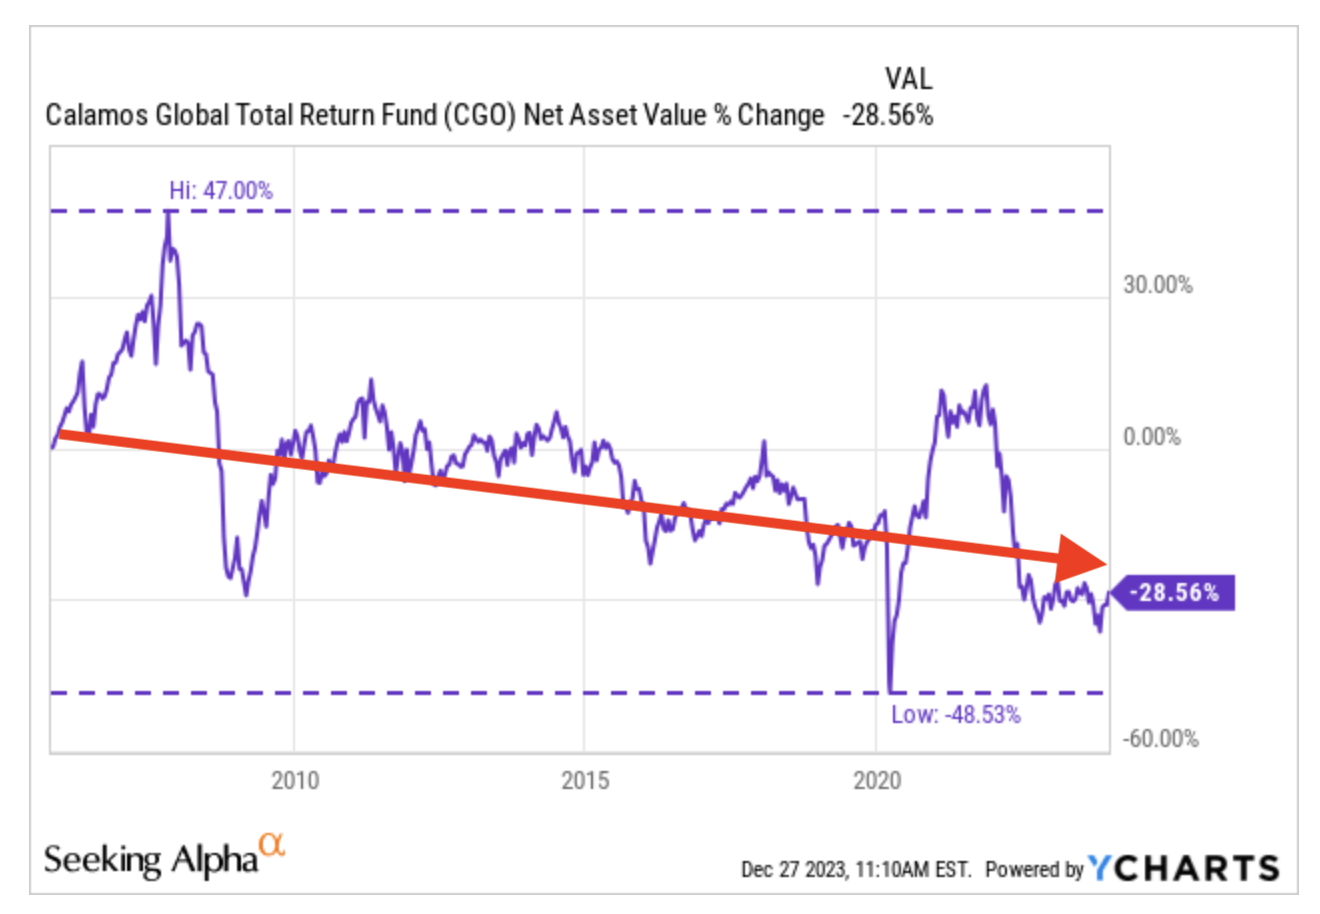
CGO ( YCharts )
A low-capitalization CEF with a more or less sideways trend until a couple of years ago, when a ruinous descent began. Currently trying to move away from recent lows. Nonetheless, a vital stock that I continue to hold in my portfolio while waiting for a reaction that will hopefully bring it back toward earlier post-covid valuations.
PIMCO Corporate & Income Strategy
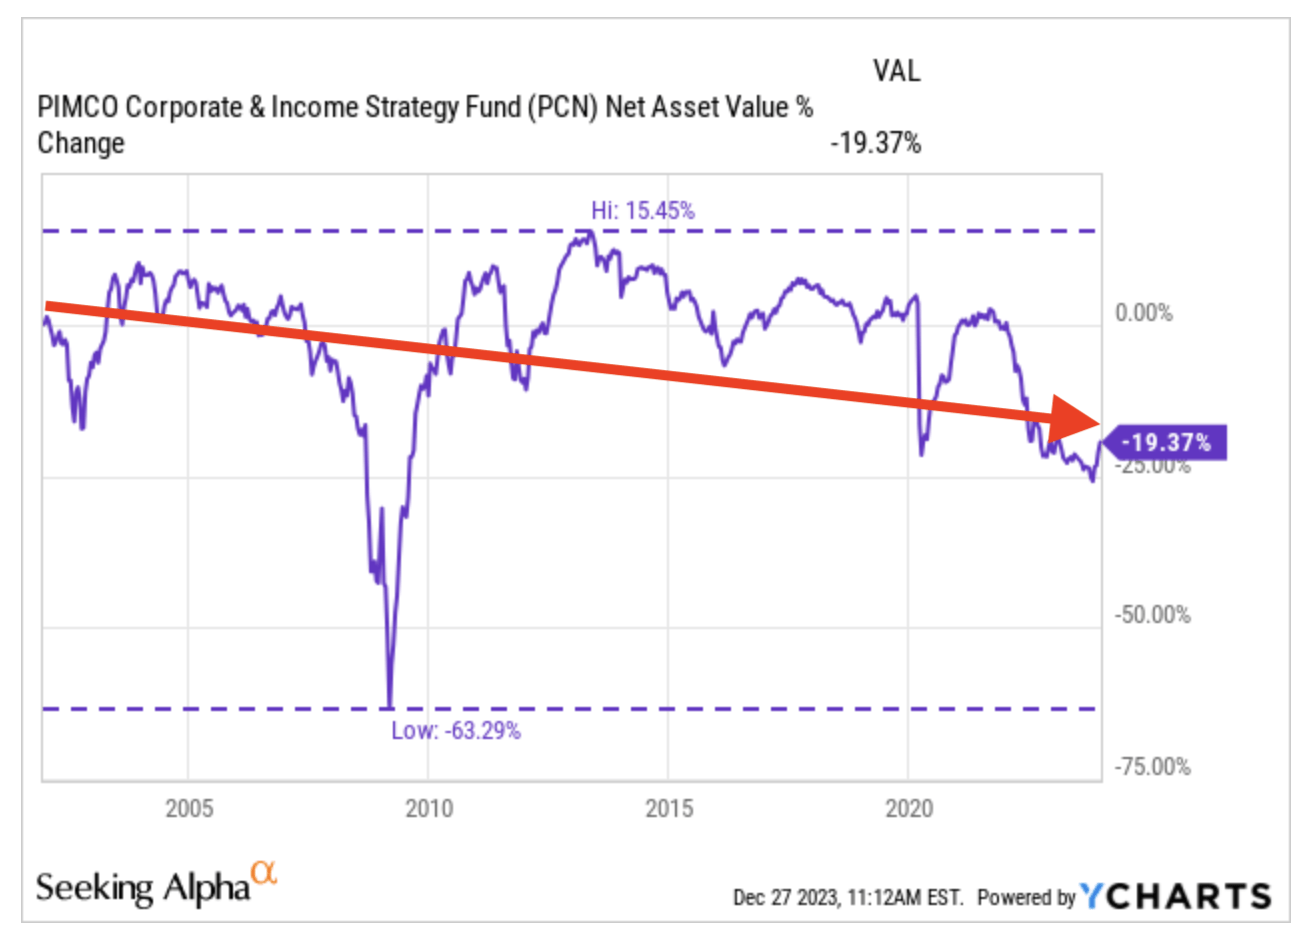
PCN ( YCharts )
Negative performance since the launch but with a very jagged path, during which repeated period highs have been in notably positive territory. Recent ups and downs related to the rate hikes have hurt it, but I remain hopeful of a possible recovery, which is why I continue to hold it serenely in my portfolio, despite the 11% loss from my purchase price.
PIMCO Corporate & Income Opportunities
PTY ( YCharts )
Again, negative performance since the launch, but with a very jagged path, during which repeated period highs have been in markedly positive territory. The recent events related to rising rates have penalized it, but I remain hopeful of a possible recovery and therefore continue to hold it serenely in my portfolio, where it marks a 6.5% loss from my purchase price.
Cohen & Steers Quality Income Realty
RQI ( YCharts )
Overall negative performance but with considerable momentum before the bursting of the 2007-2009 financial crisis. Thereafter, a long and convincing recovery brought it back to some period highs in positive territory. A viable, responsive stock, I continue to hold it in my portfolio despite a not entirely satisfactory performance, but I remain hopeful for the long term.
Obviously, all five of these securities are far from the “ideal” investment considered to be one with steady distributions and positive NAV performance since inception. But their charts nonetheless show a vitality and resilience (now a fashionable word) that distinguish them from the first five securities analyzed above, whose steady downward slopes seem instead to offer scarce hope of redemption.
News Taking Care of Itself
Finally, the good news is the 15 securities that show positive NAV performance since launch, answering the initial hypothesis from which this article was inspired.
Regarding these securities, I refer to my last two articles on CEFs and BDCs devoted to the topic (“ 38 CEFs Worth Exploring ” and “ BDCs For An Income Portfolio ”). Left out of those articles are JEPI and JEPQ , two ETFs that I have never mentioned specifically, but whose positive performance makes them register in the good news category.
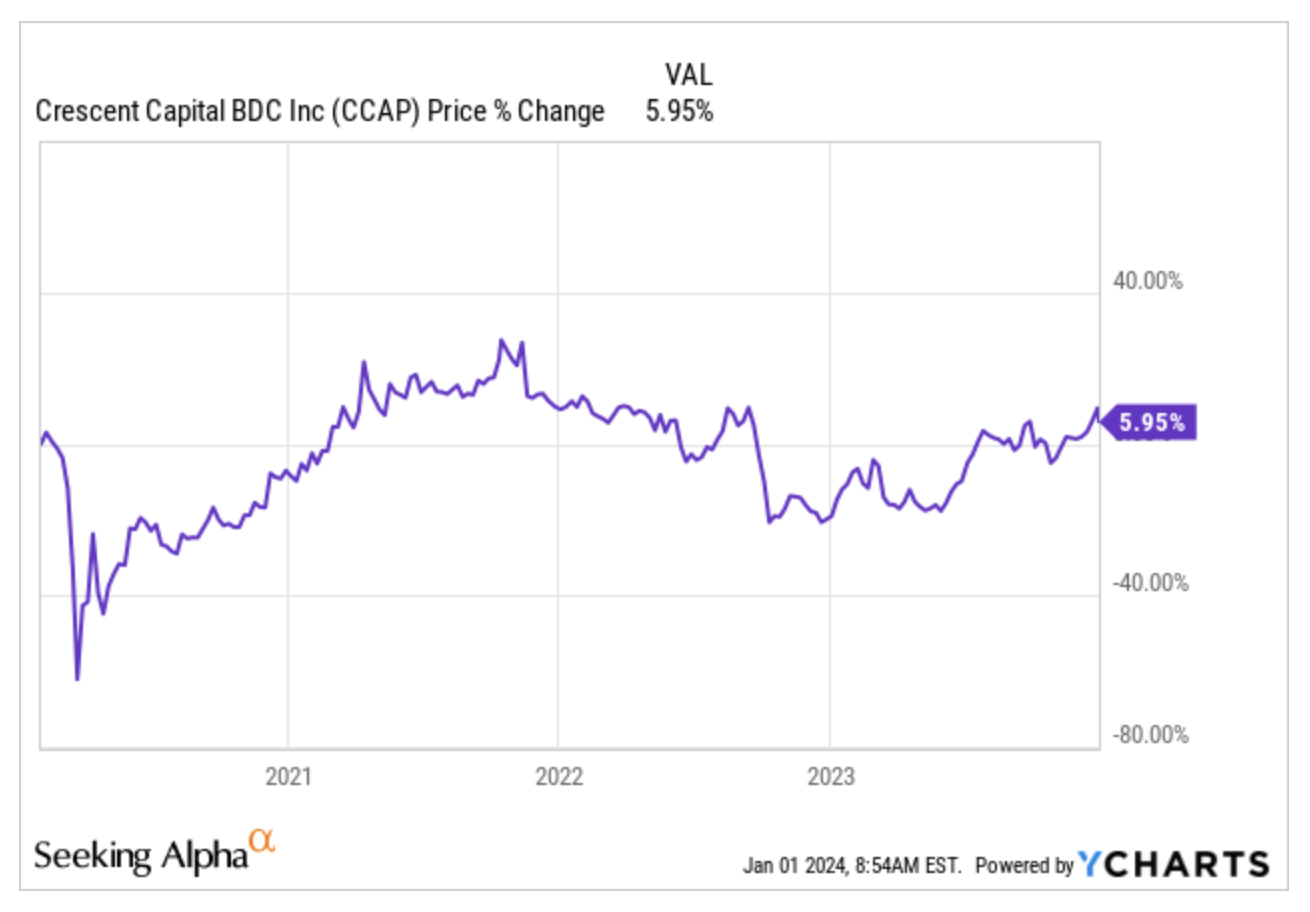
Please note that with regard to ARCC , CCAP, and FDUS I decided to report the price and not the NAV, due to the lack of charts covering the trend of the underlying assets these BDCs own.
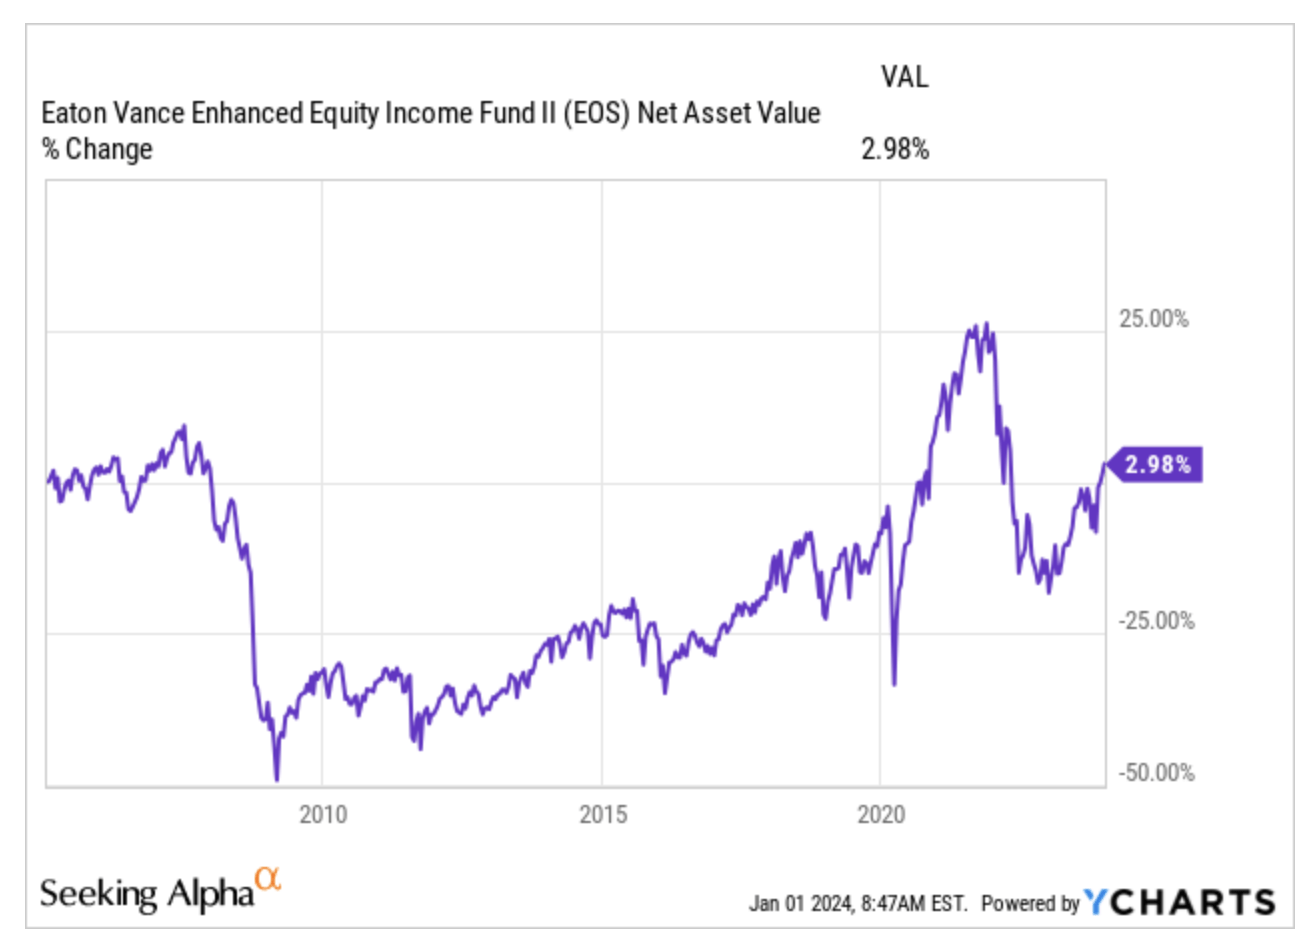
Increase between +0% and +10%
- Crescent Capital
- Eaton Vance Enhanced Equity Income II
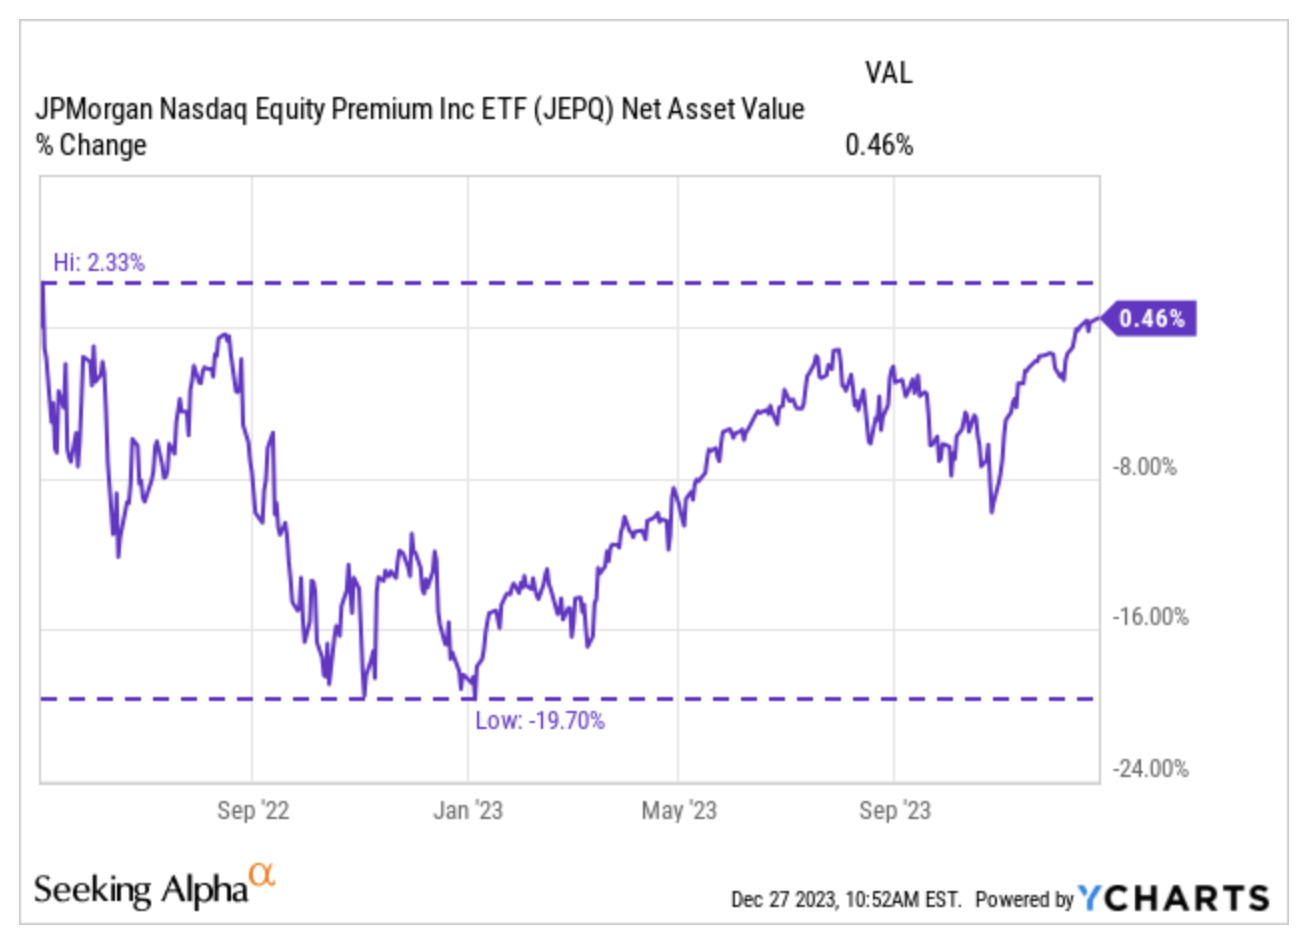
- JPMorgan Nasdaq Equity Premium Income
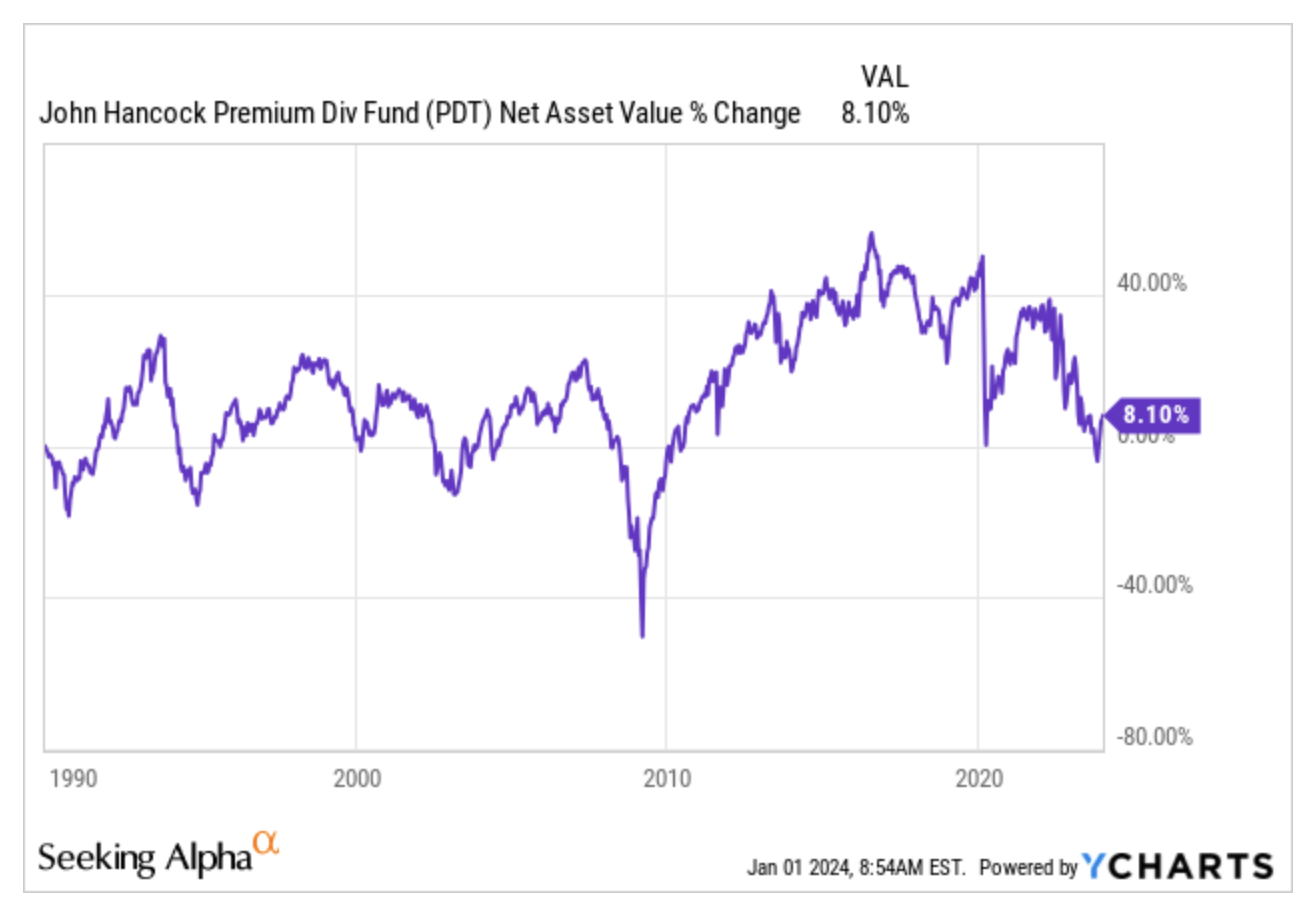
- John Hancock Premium Dividend
Crescent Capital
CCAP ( YCharts )
Eaton Vance Enhanced Equity Income II
EOS ( YCharts )
JPMorgan Nasdaq Equity Premium Income
JEPQ ( YCharts )
Launched in May 2022, JEPQ followed the markets’ descent throughout the year, then showed a mighty rebound starting in January 2023, coinciding with the recovery of its benchmark index, the NASDAQ. It is currently in slightly positive territory.
John Hancock Premium Dividend
PDT ( YCharts )
Increase between +10% and +30%
- Eaton Vance Tax-Adv. Dividend Income
- John Hancock Tax-Adv. Dividend Income
- JPMorgan Equity Premium Income
- Cohen & Steers Infrastructure
Eaton Vance Tax-Adv. Dividend Income
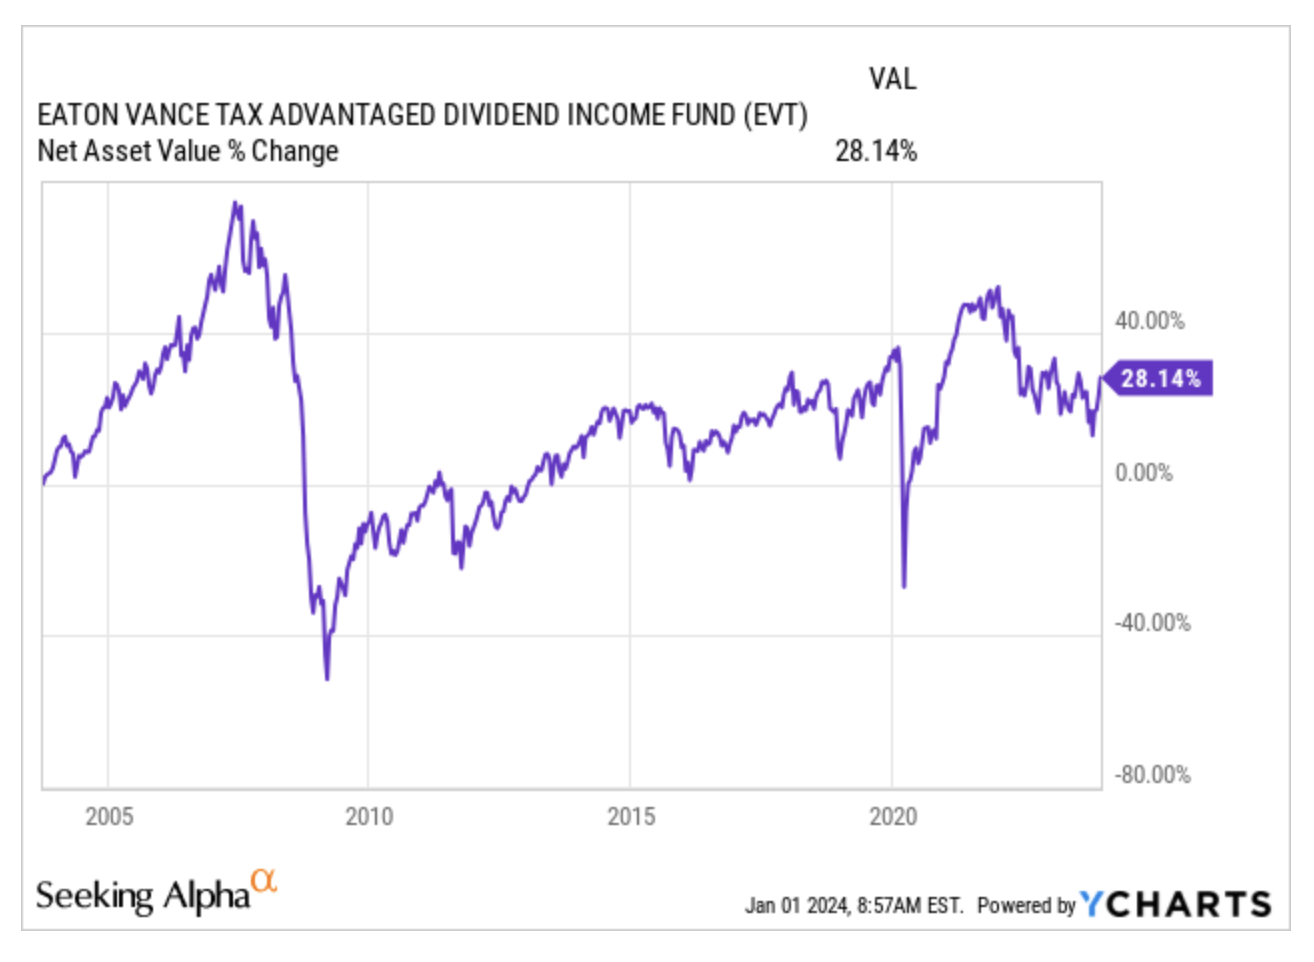
EVT ( YCharts )
John Hancock Tax-Adv. Dividend Income
HTD ( YCharts )
JPMorgan Equity Premium Income
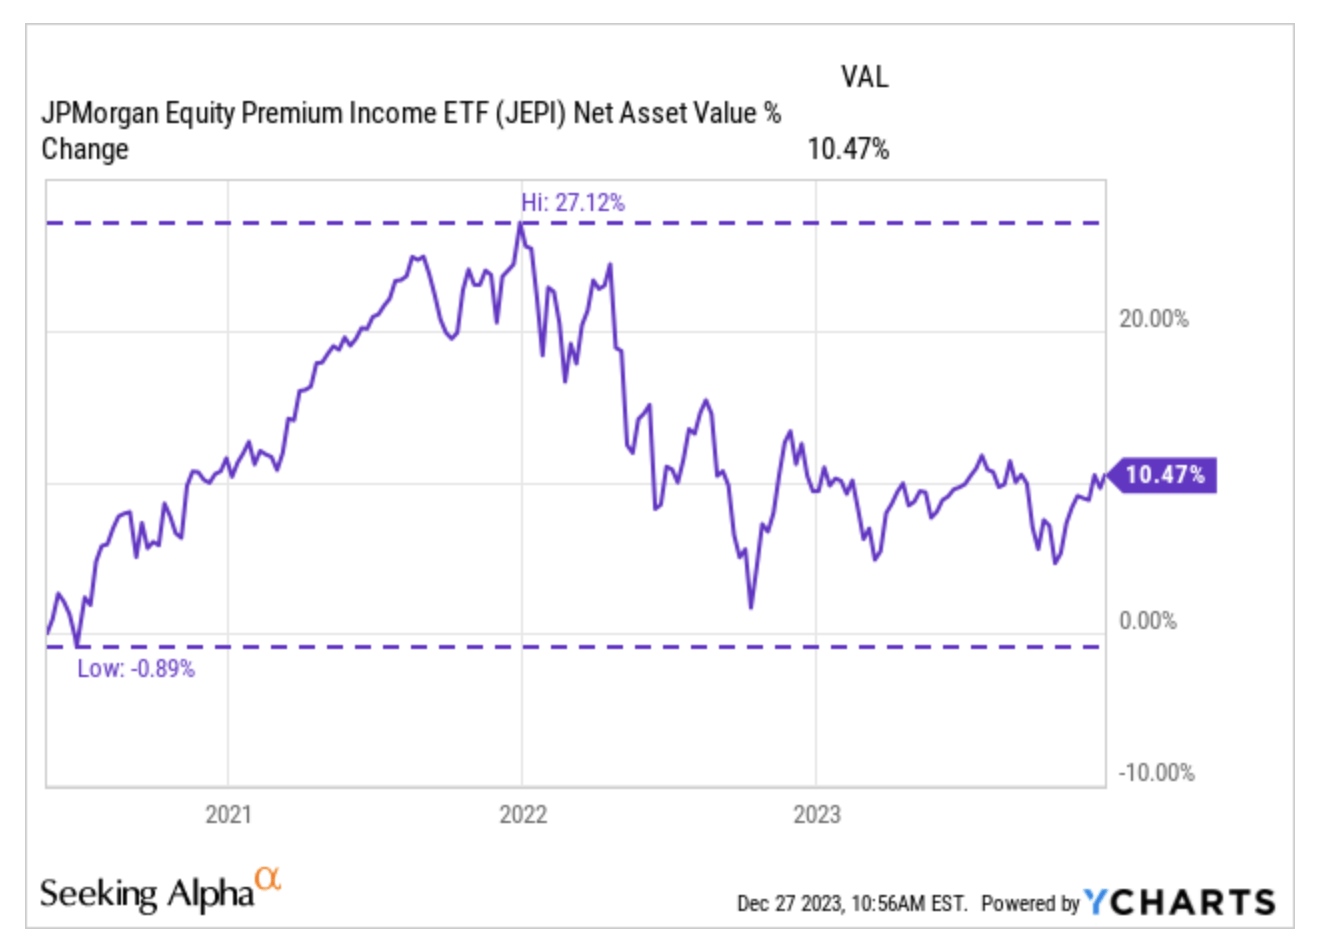
JEPI ( YCharts )
Launched in May 2020, JEPI benefited entirely from the rebound in the markets after the pandemic outbreak, which was followed during 2022 by a rapid descent and the start of a consolidation phase that continues to this day, however, in largely positive territory.
Cohen & Steers Infrastructure
UTF ( YCharts )
Increase greater than +30%
- Ares Capital
- BlackRock Science and Technology Trust
- Eaton Vance Tax-Adv. Global Dividend Opps
- Fidus Investment
- Barings Corporate Investors
- Royce Value Trust
- Reaves Utility Income Fund
Ares Capital
ARCC ( YCharts )
BlackRock Science and Technology Trust
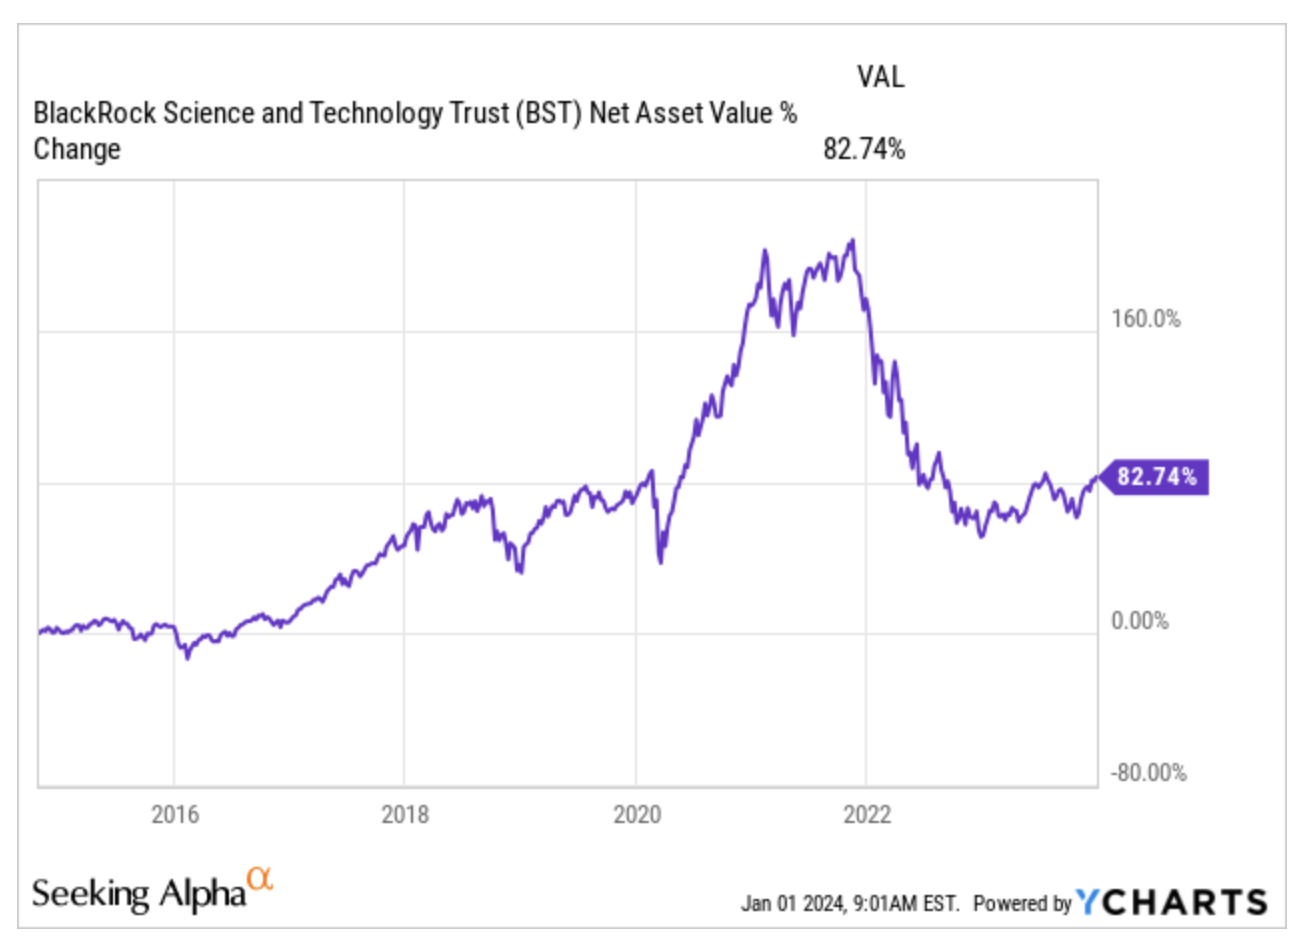
BST ( YCharts )
Eaton Vance Tax-Adv. Global Dividend Opps
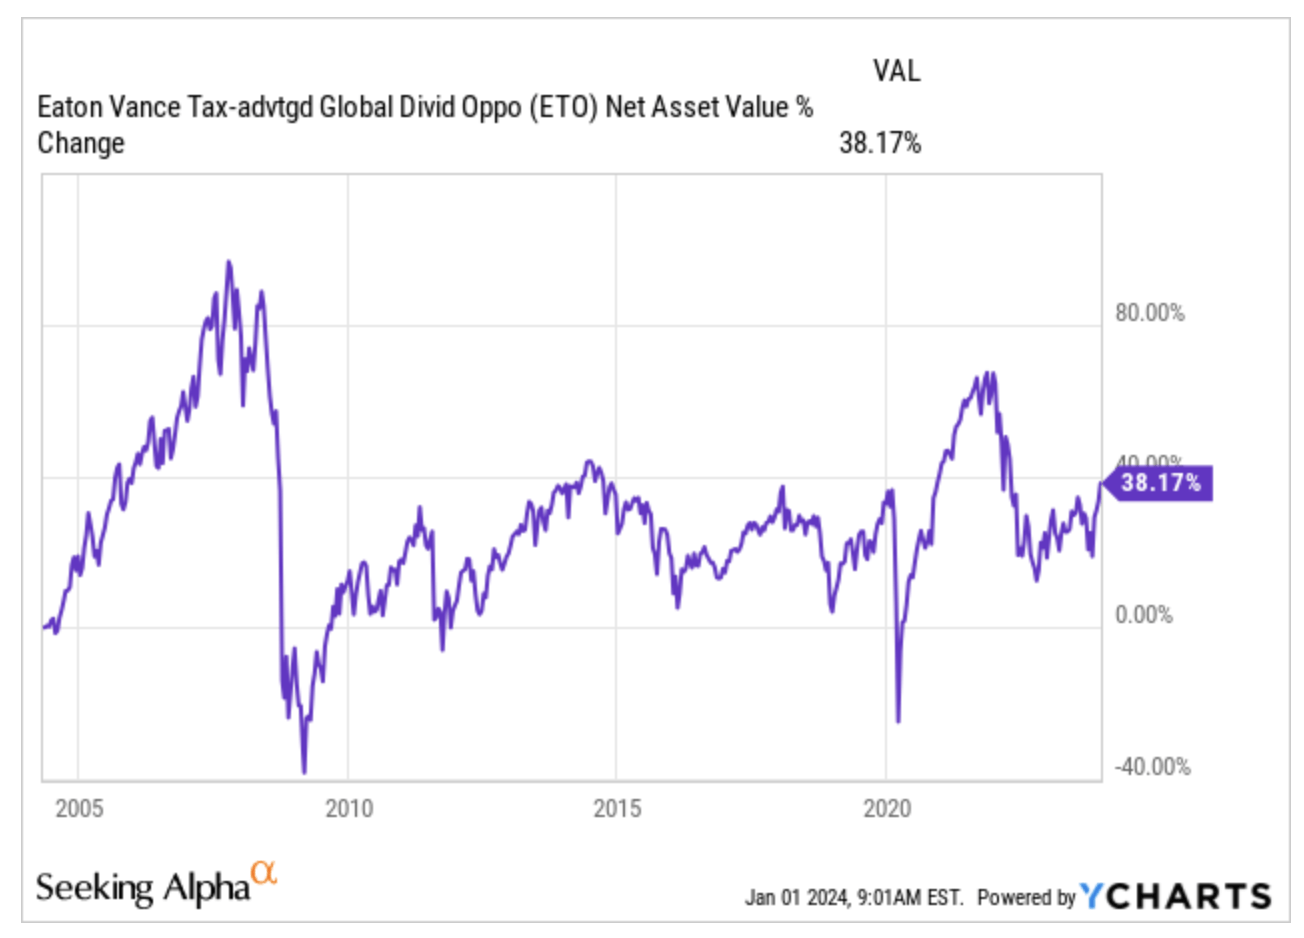
ETO ( YCharts )
Fidus Investment
FDUS ( YCharts )
Barings Corporate Investors
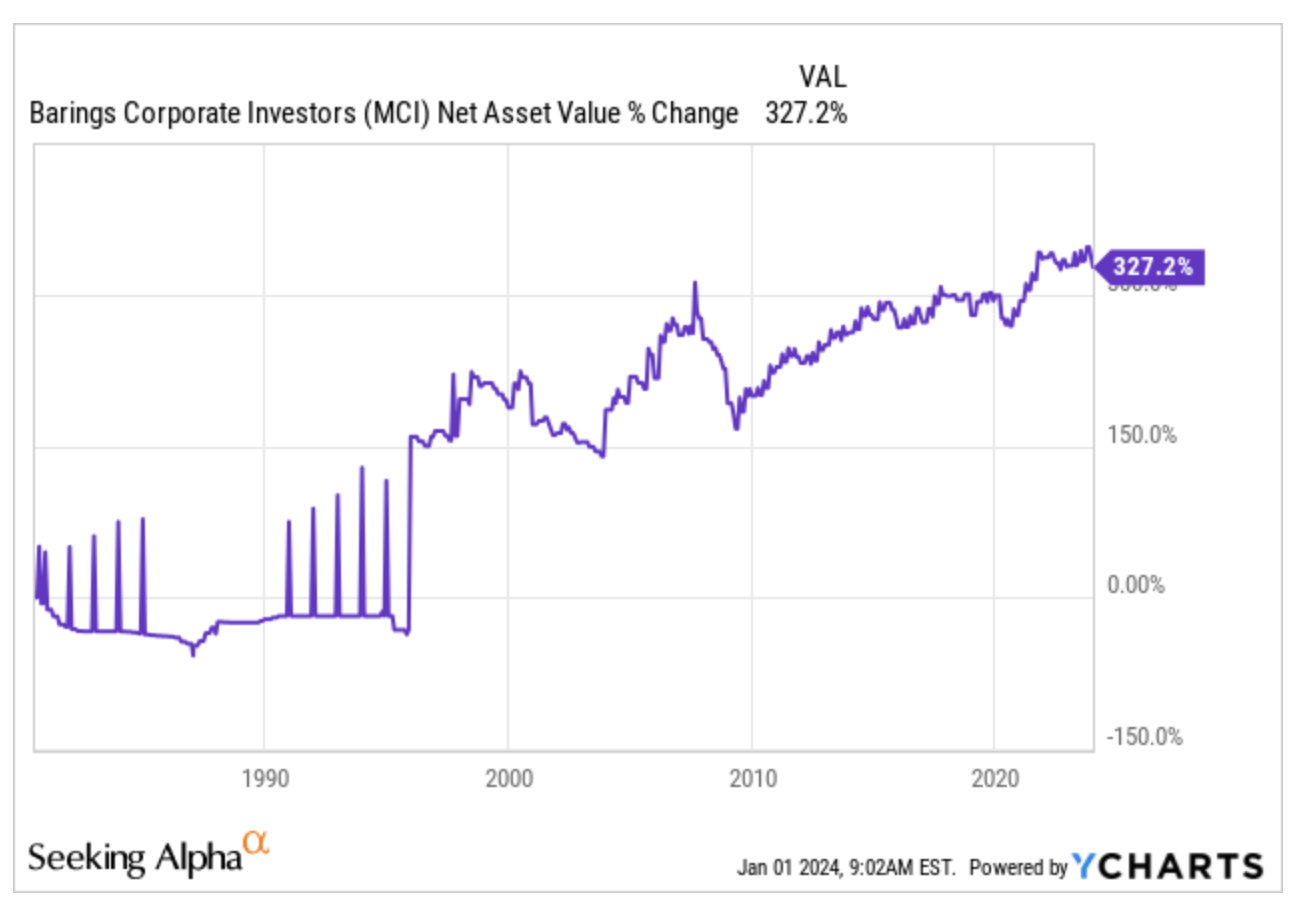
MCI ( YCharts )
Royce Value Trust
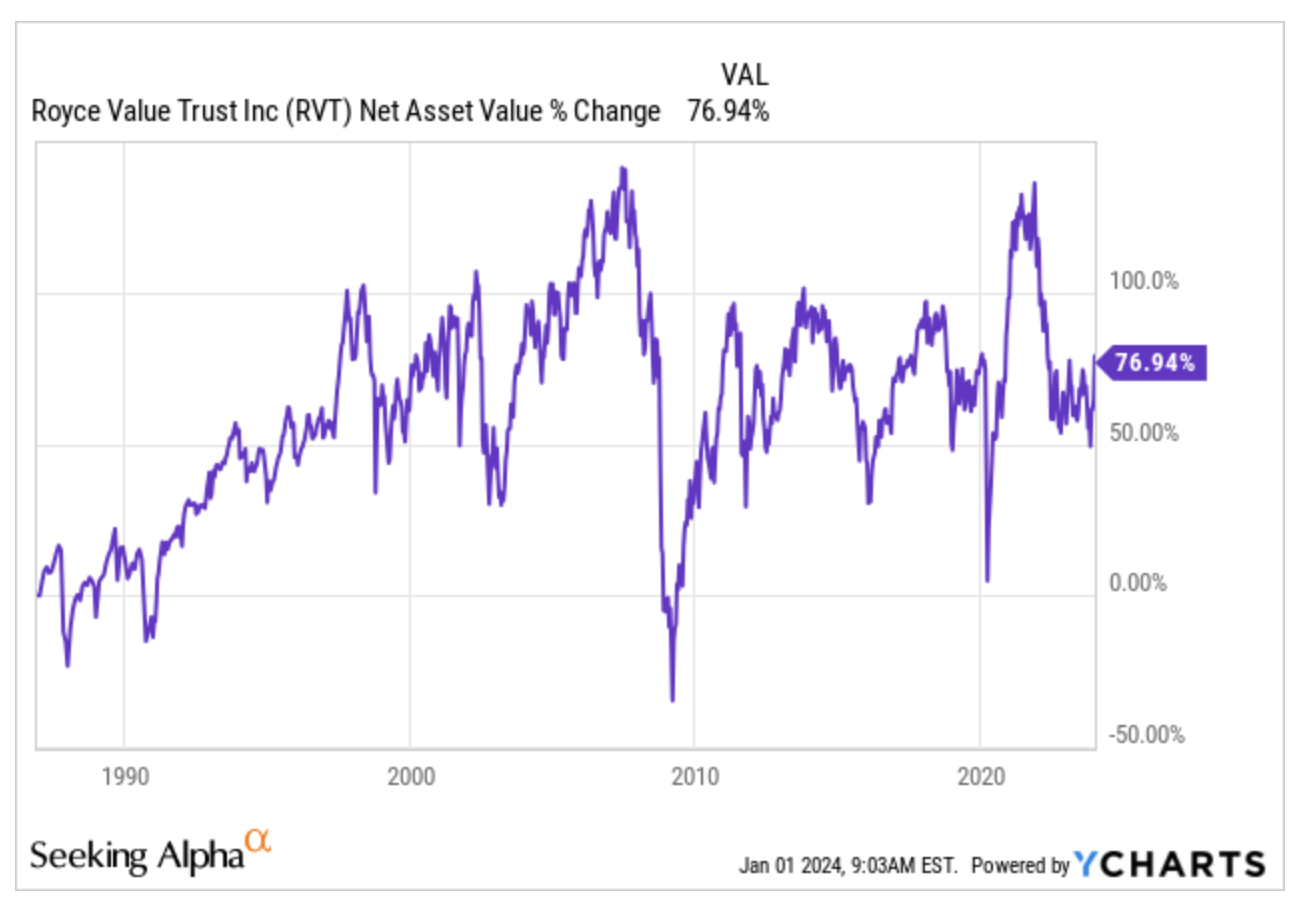
RVT ( YCharts )
Reaves Utility Income Fund
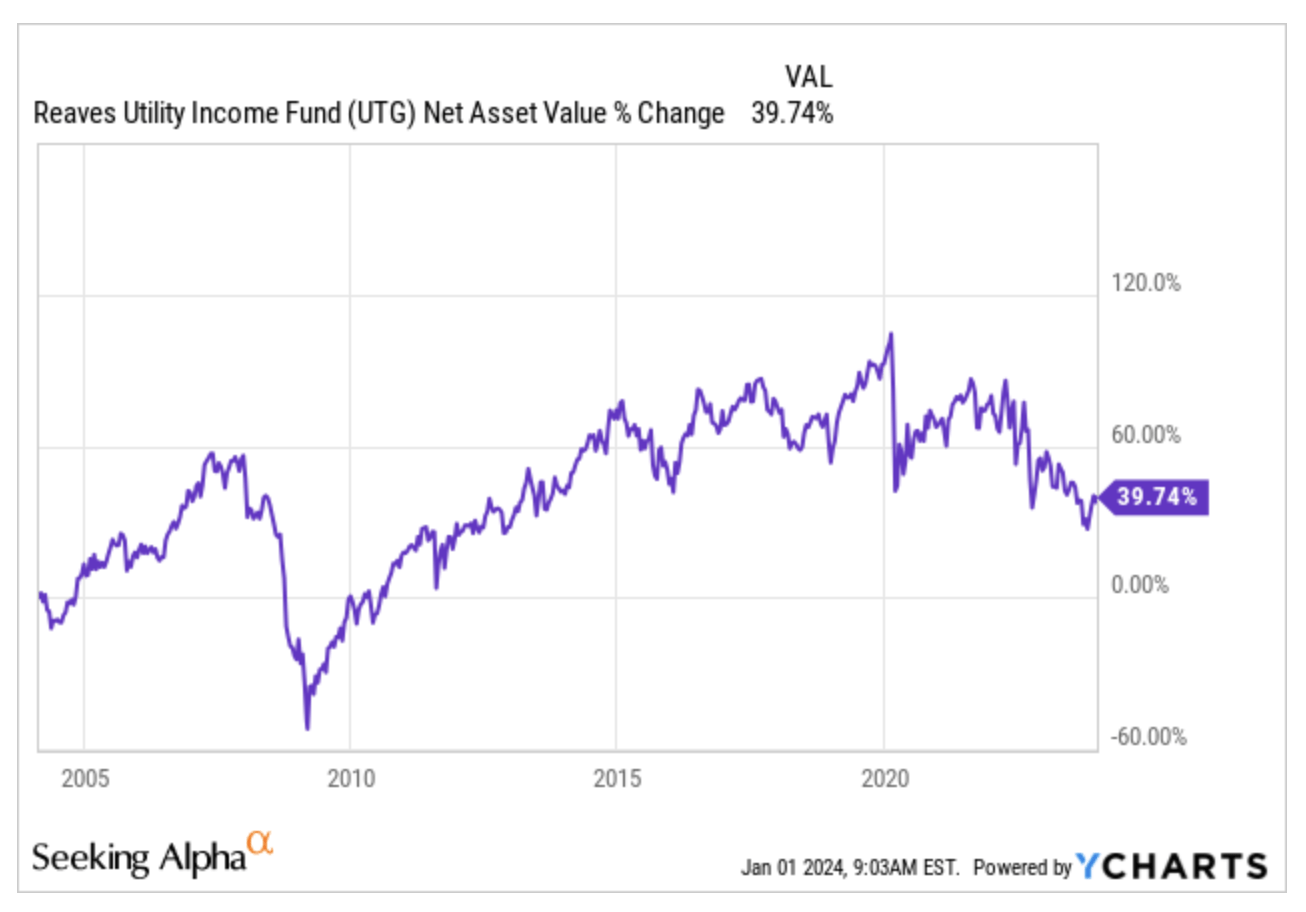
UTG ( YCharts )
Summing Up
Benjamin Graham said that the purpose of a margin of safety is to make forecasts unnecessary. In this respect, from my point of view, finding and selecting BDCs/CEFs/ETFs that have created value since their launch seems to reduce the need to guess the fate of my portfolio through fallacious predictions about scenarios to come.
Markets are constantly being called upon to imagine the future, but my personal goal is to get to the point where I can create a portfolio that will last over the years, without having to adjust it from time to time. In order to do this, I believe it is necessary to identify fixed points that will help me to gradually skim off the securities that have shown a disappointing performance, favoring instead those that, in addition to good dividends, have also offered some form of capital protection.
Now, there will be bear market phases during which it may be appropriate and even convenient to increase our positions at bargain prices by re-investing all or part of the dividends. But, if investing means usefully committing money to capital or fruitful ventures, then the idea that we must redeploy the cash flow generated by security simply to keep it from drowning seems to me to be a denial of the very concept of investing. Floundering is one thing, swimming is another.
It is obvious that there may be years in which Total Return will have a minus sign because the cash flow produced by security is less than its depreciation (including reinvestment of dividends/distributions), and their sum may be negative. However, if the stocks in which we have invested are well managed and able to generate value over time, instead of eating up capital to pay their shareholders, all we have to do is wait patiently for the market to recover, and the value of our portfolio will presumably pick up again.
To do this, we have to give ourselves time. The ever-increasing focus on news reports not only makes it difficult for us to understand the real signal but also risks causing us great confusion. The more frequently the information we receive, the more we risk making problematic assumptions along the way by mistaking noise for signal. And that makes judgment worse.
To err is human, and changing one’s mind in many cases can be the best approach, but if we focus only on short time intervals, what we would then observe is portfolio variability, i.e., noise. We would then have no reliable indication of whether our strategy is good or not. In fact, the news is full of noise; history, on the other hand, is largely devoid of it.
History has no hiding places, not even among the mysterious and enchanting Nuraghes of Sardinia.
For further details see:
My 9% Income Portfolio-Living Off Dividends