BASFY - My Dividend Stock Portfolio: New July Dividend Record - 99 Holdings With 26 Buys
2023-08-08 09:10:00 ET
Summary
- S&P 500 and Dow Jones Industrial Average both saw positive returns of around 3% in July.
- The Federal Reserve approved a quarter point interest rate hike to 5.5% to combat rising inflation. The inflation rate for the United States was 3.0% for the 12 months ended.
- Investment activity in July remained at record levels, with net investments totaling around $2,500, primarily targeted towards the financial sector and high-yielding BDCs.
- Dividend income hit a July record of $608, up 10% annually and up 1% sequentially, with the goal of adding at least $100 in forward dividend income every month hit.
- Gifted Working Time in 2023: Around 189.5 hours or 23.7 days of active work have been replaced with passive income in 2023, equivalent to almost 5 weeks of work.
The S&P 500 was up 3.11% in July, bringing its YTD return to 19.52%. The Dow Jones Industrial Average increased 3.35% for the month and was up 7.28% YTD. The Federal Reserve approved a quarter point interest rate hike to combat rising inflation. The inflation rate for the United States was 3.0% for the 12 months ended June, while the euro area had an inflation rate of 4.6% in July. The Fed dot plot showed that most FOMC members expected two more rate hikes in 2023, bringing the median federal funds rate to 5.6% by the end of the year.
There is still some doubt regarding a soft landing, but, in my opinion, there won't be any type of recession (at most a technical one) and if it will be as short-lived as the brief 2022 bear market in stocks, which, in my opinion, was also a non-noteworthy event.
Portfolio Changes in July
Investment activity in July stayed on a very high level comparable to June as I remained busy deploying dividends, income and capital earned in June as well as additional income from other sources. Unfortunately, the markets are pushing my favorite BDCs higher almost every single day, but there are still some 10%+ dividend yields available and ready to be taken. As a result, buying opportunities continue to fade, but even with lower yields, I still very much favor BDCs and won't stop buying.
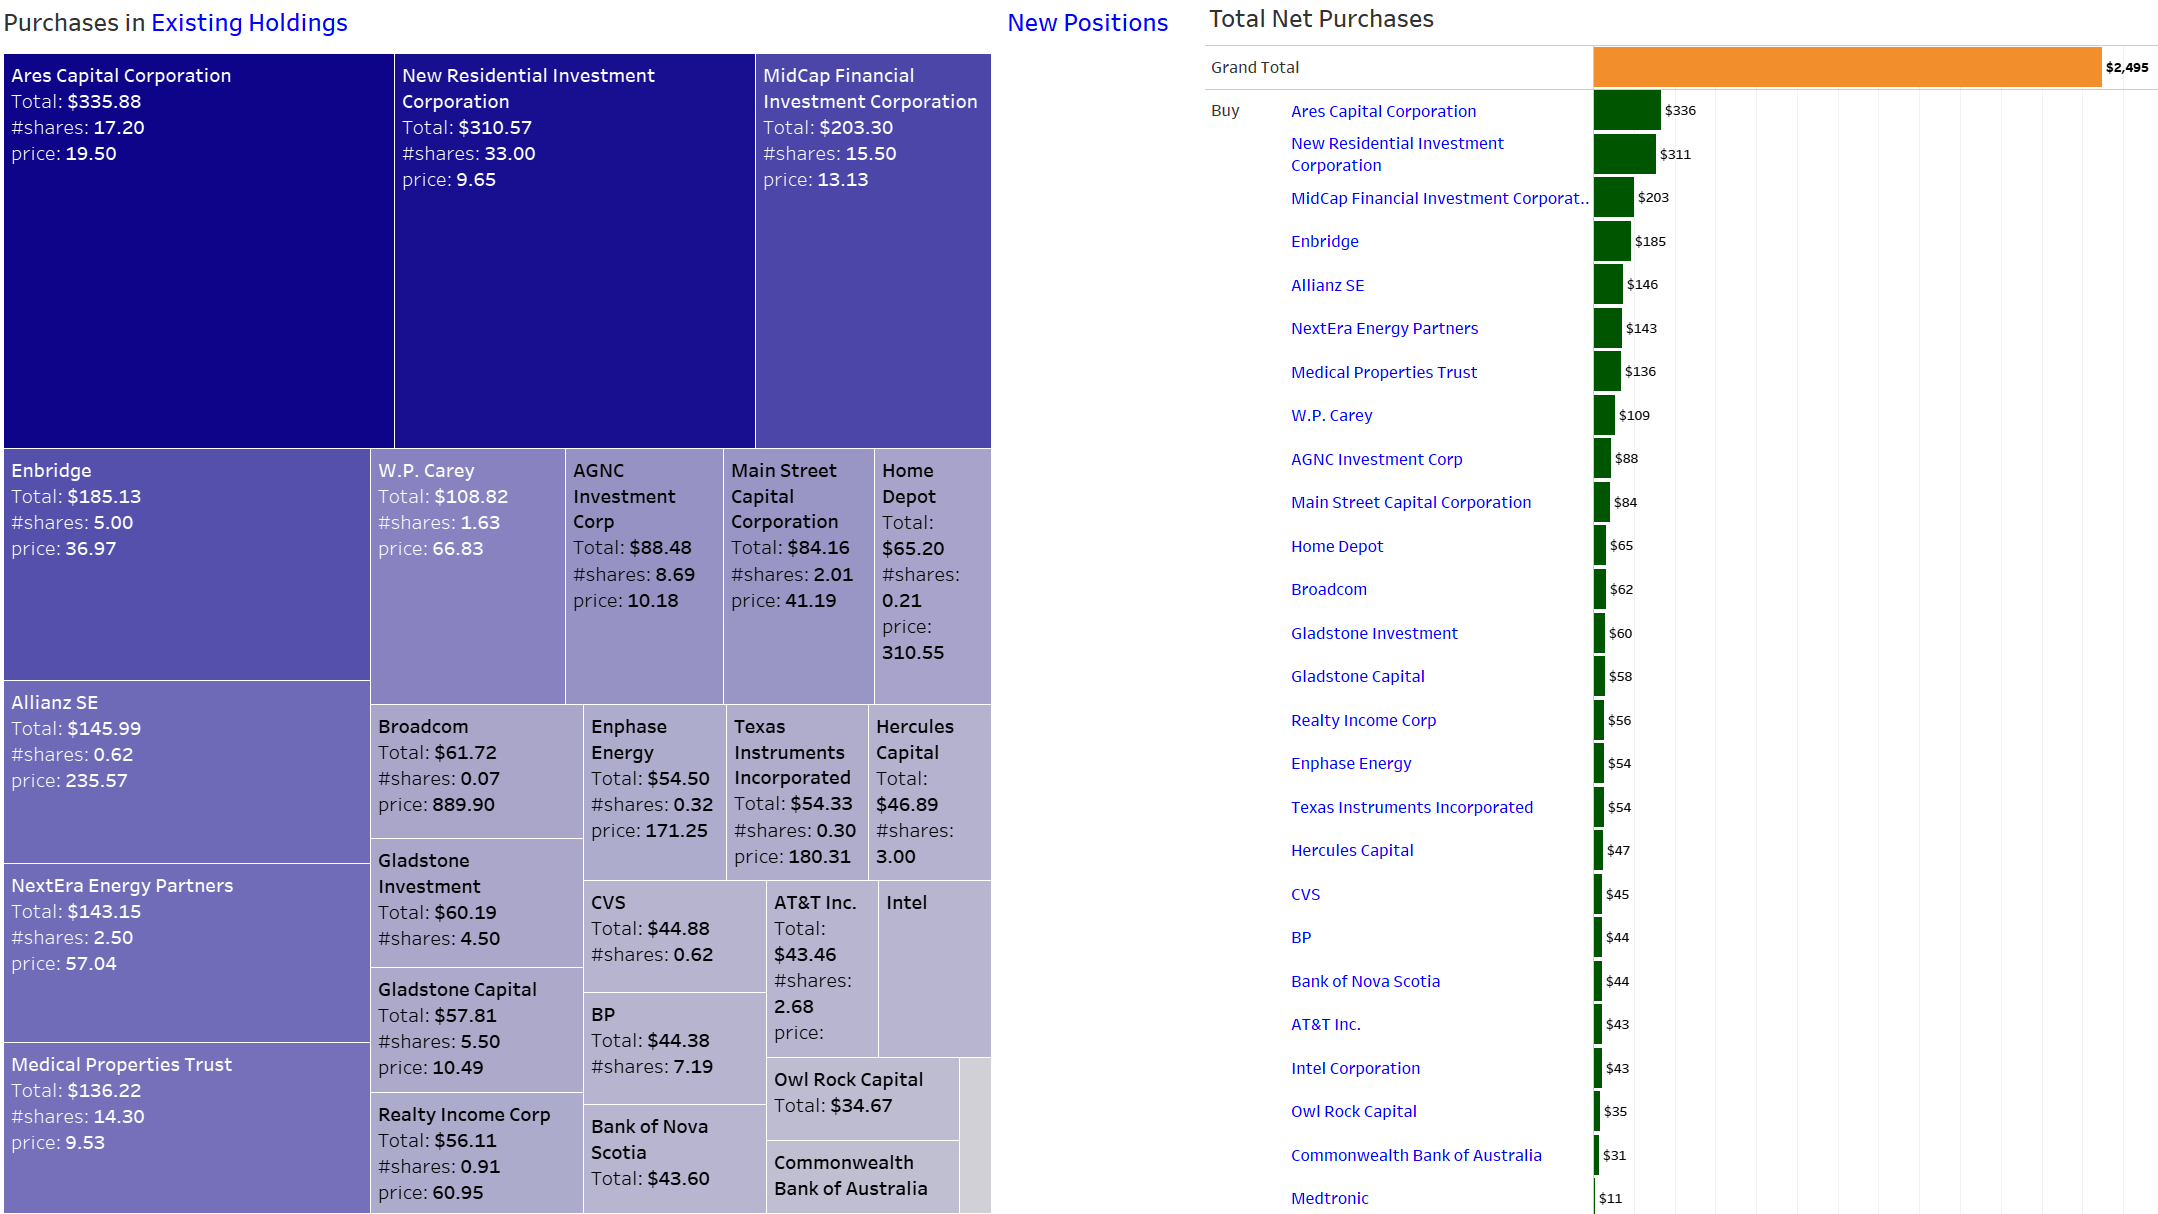
Overall, net investments totaled around $2,500 with the majority of those purchases targeted towards the financial sector in general and high-yielding BDCs and other stocks in particular. I was really surprised to see W. P. Carey ( WPC ) trade below $70 again for no apparent reason given that their most recently reported earnings and investment activity continue to show the highest quality.
I used that recent stock price weakness to continue to add to my holdings in WPC. My biggest purchase in June 2023 were several small transactions to acquire more shares of Ares Capital Corporation ( ARCC ) which remains my #1 dividend payer in the entire portfolio and will lead to record dividend income in September. I also continue to like Rithm Capital Corporation ( RITM ) and MidCap Financial Investment Corporation ( MFIC ). Most of the BDCs I am invested in are on fire this year easily outperforming the S&P500 while at the same time providing double-digit or close to double-digit yields.
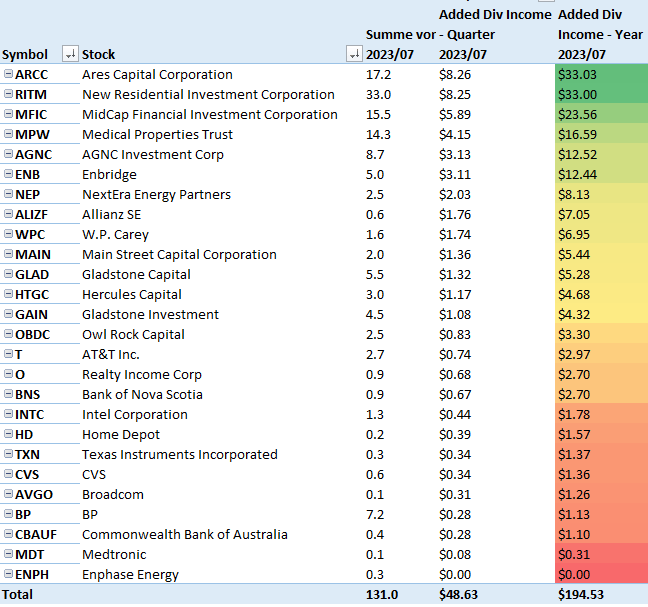
Overall, I did manage to add $195 in forward annual dividend income this month, which brings YTD added annual dividend income to more than $900 already. My goal is to be able to add at least $100 in forward dividend income every month and as things are developing right now, this is a very reasonable and realistic target to achieve and overachieve as long as BDCs remain part of my asset allocation.
All these purchases break down as follows:
Added Dividend Income (Designed by author)
All net purchases in July can be found below:
Net Purchases in July (Designed by author)
Dividend Income June 2023
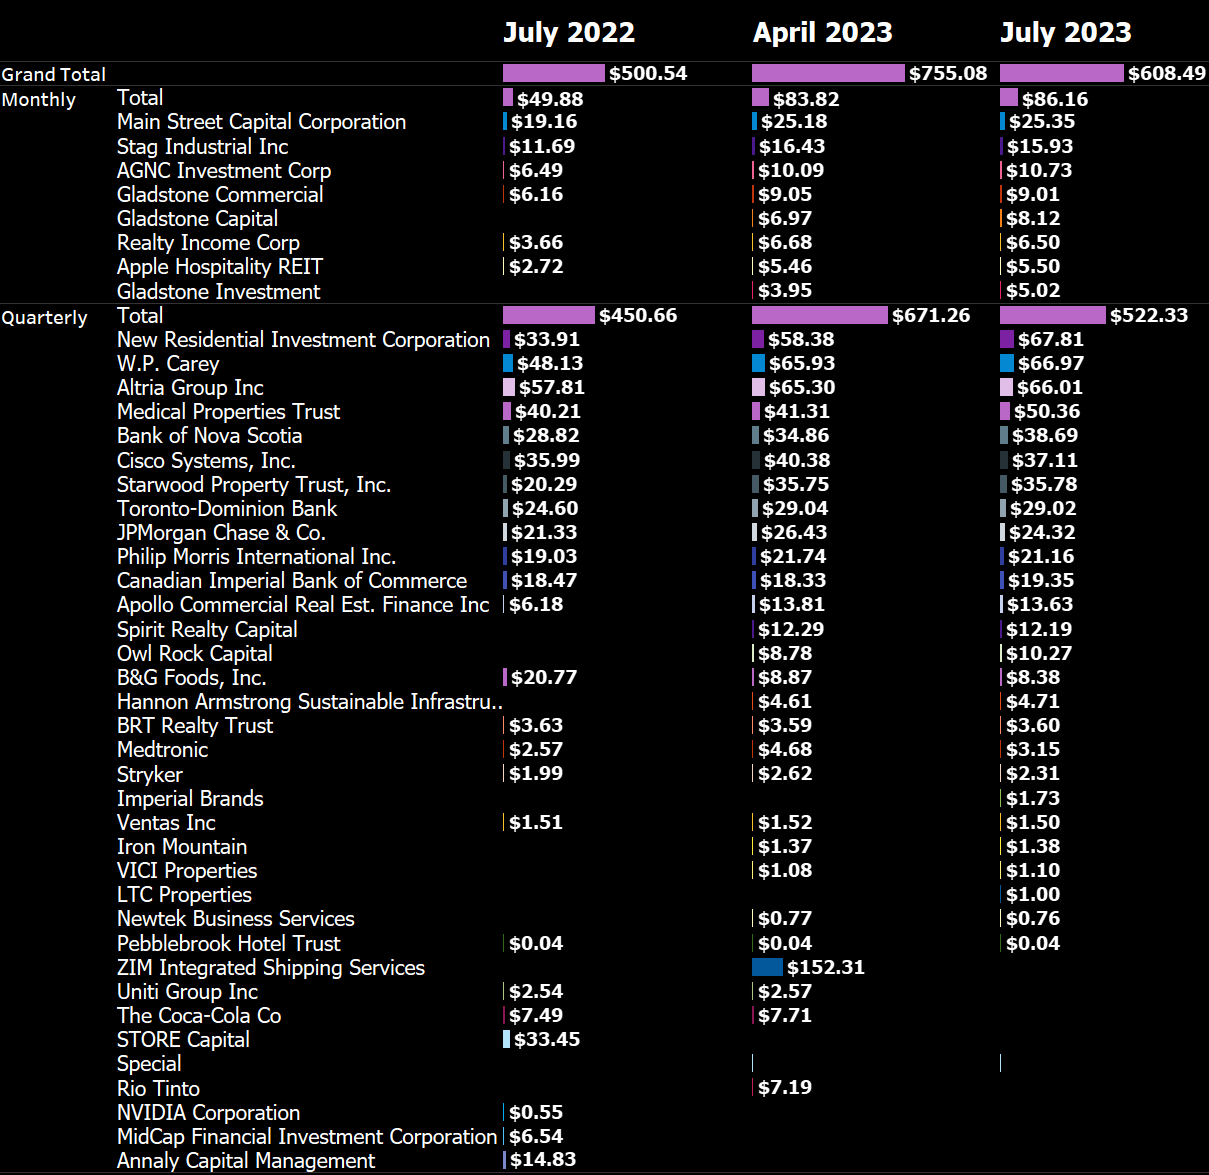
Dividend income hit a new all-time record for June of $608, up 11% annually and down 20% sequentially. Year-over-year performance is slightly distorted by the fact that dividend income from Store Capital in July 2022 did not reoccur in 2023 following the takeover of the company. Quarterly performance is heavily affected by the giant dividend from ZIM Integrated Shipping Services ( ZIM ) paid in April 2023. ZIM did not pay any dividend thereafter and it remains to be seen when they will reinstate the dividend and at what level. Accounting for that unique April 2023 dividend payment turns quarterly performance into a marginal 1% gain.
Given no special dividends this month, dividend income from my monthly dividend payers has fallen back below $100 in April but its current baseline of $86 is very strong as well and slowly creeping up every future month.
Following ongoing investments into high-yielding RITM helped dividend income from RITM to push higher than that of W.P. Carey for the first time but I intend to build up both positions to at least generate $100 in quarterly dividend income each.
July 2023 Dividend Income (Designed by author)
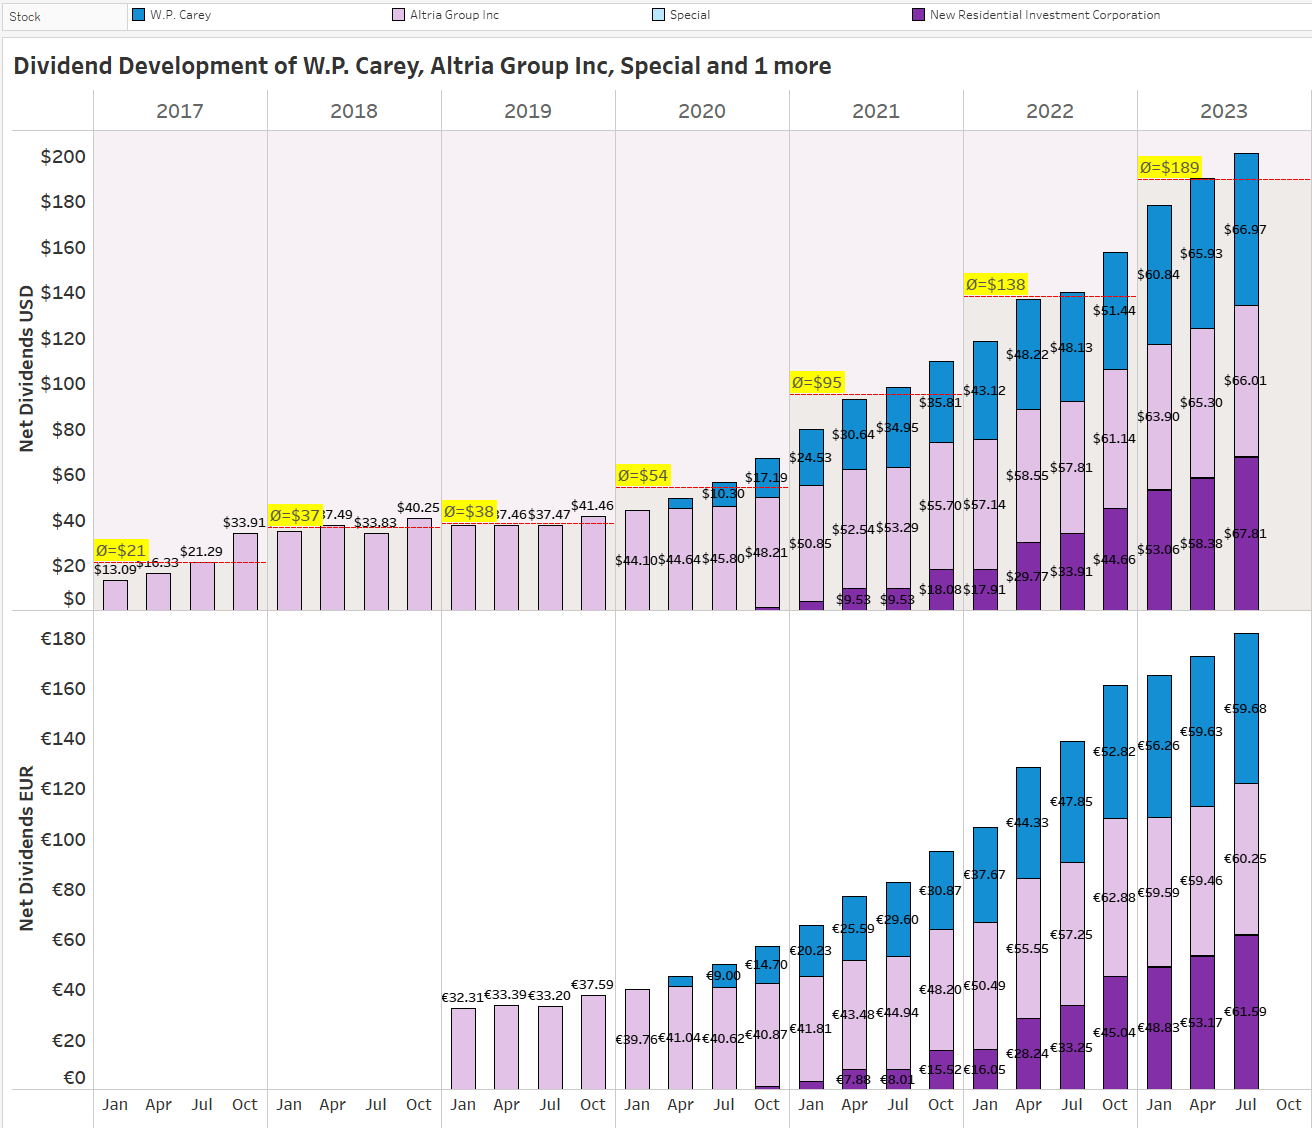
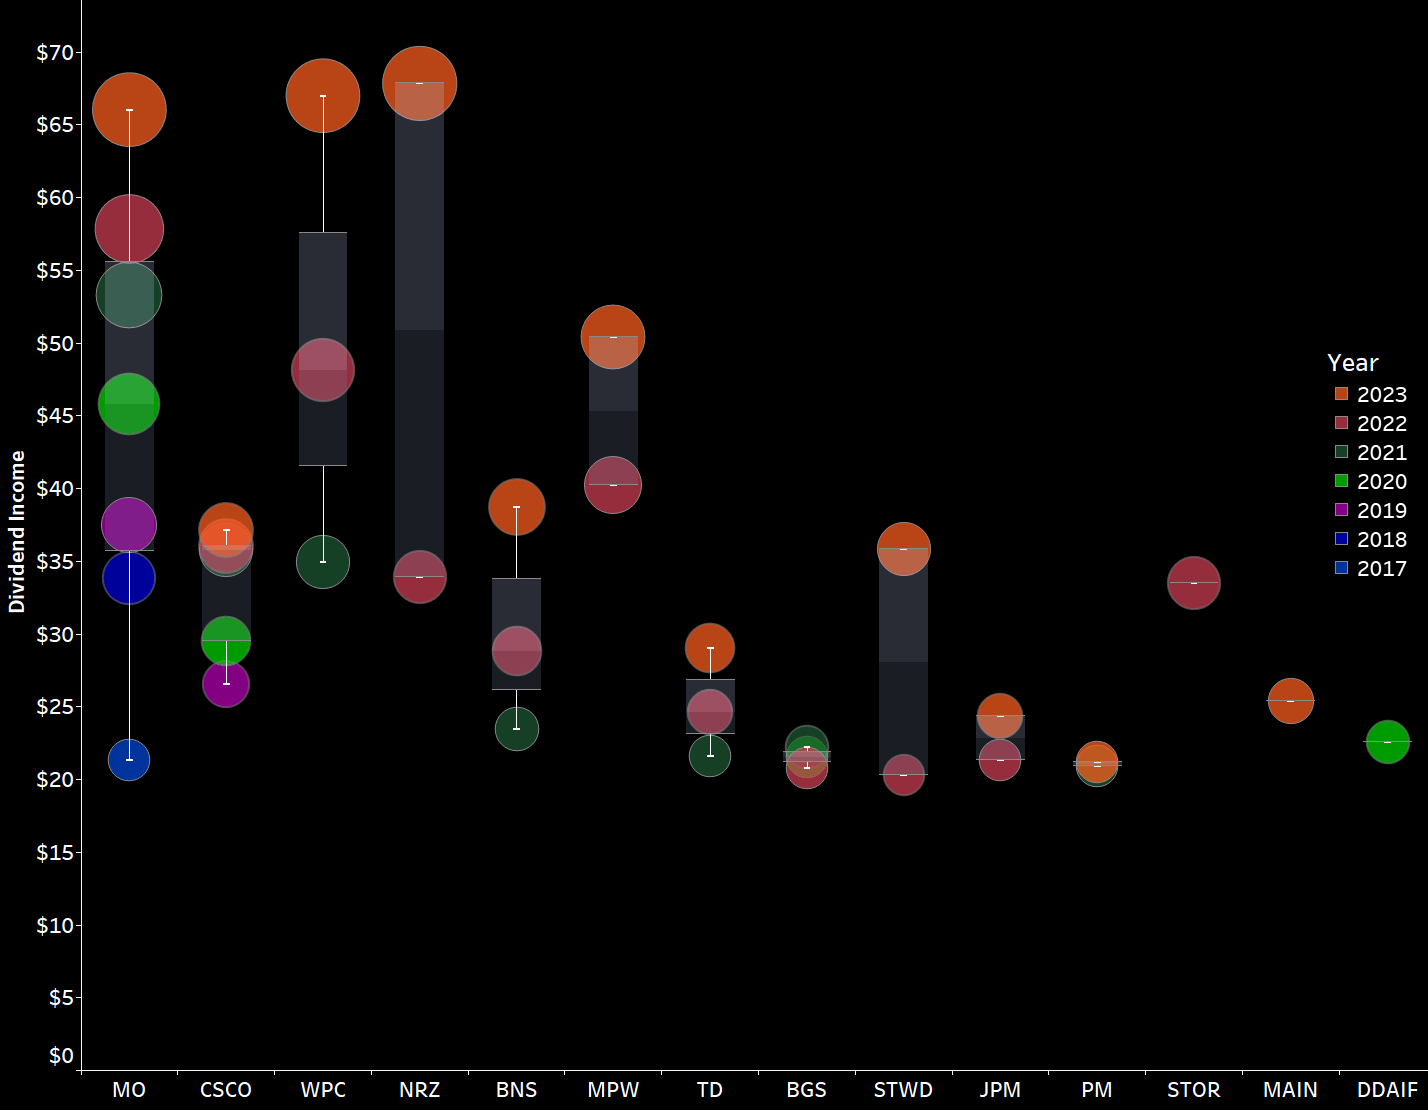
The dividend income from my top 3 regular dividend payers in July has now passed the $200 mark (up from $190 in April) and the YTD average of $189 is up substantially from the $138 in 2022 which is mainly driven by regular investments in both W. P. Carey and Rithm Capital.
All this is depicted below:
Top 3 Dividend Payers (Designed by author)
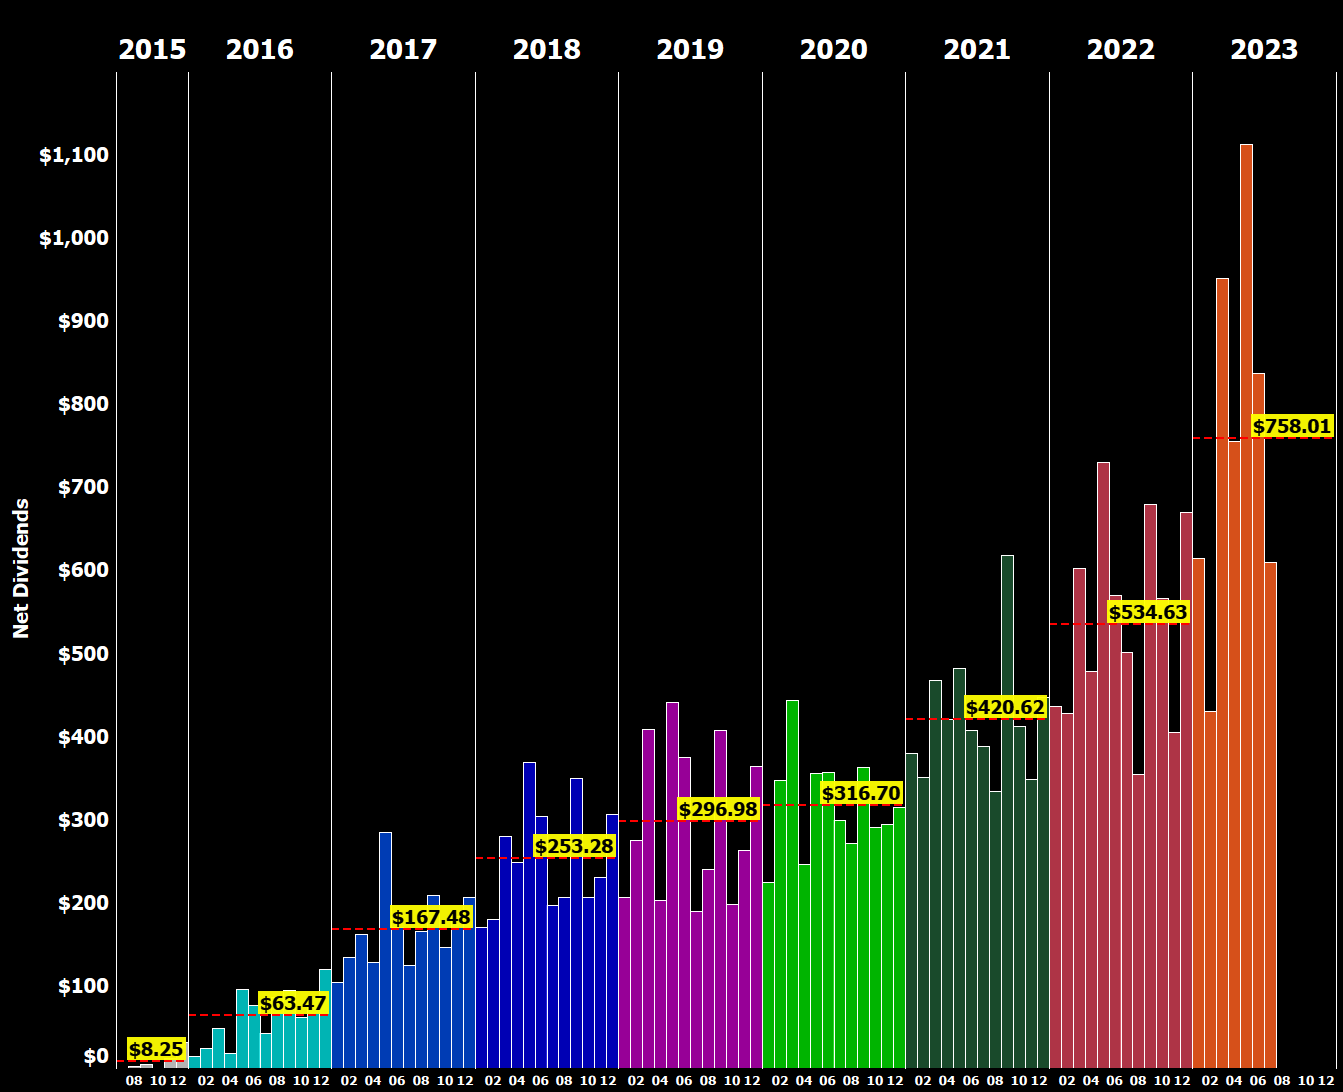
Here is a chart that shows the development of my net dividend income by month over time between 2015 and 2023. You can see the growth of my dividend income and the average annual dividend for each year:
All-time Dividend Development (Designed by author)
This chart is my favorite because it illustrates the progression of my dividend income over time and allows me to easily see the average annual dividend for each year.
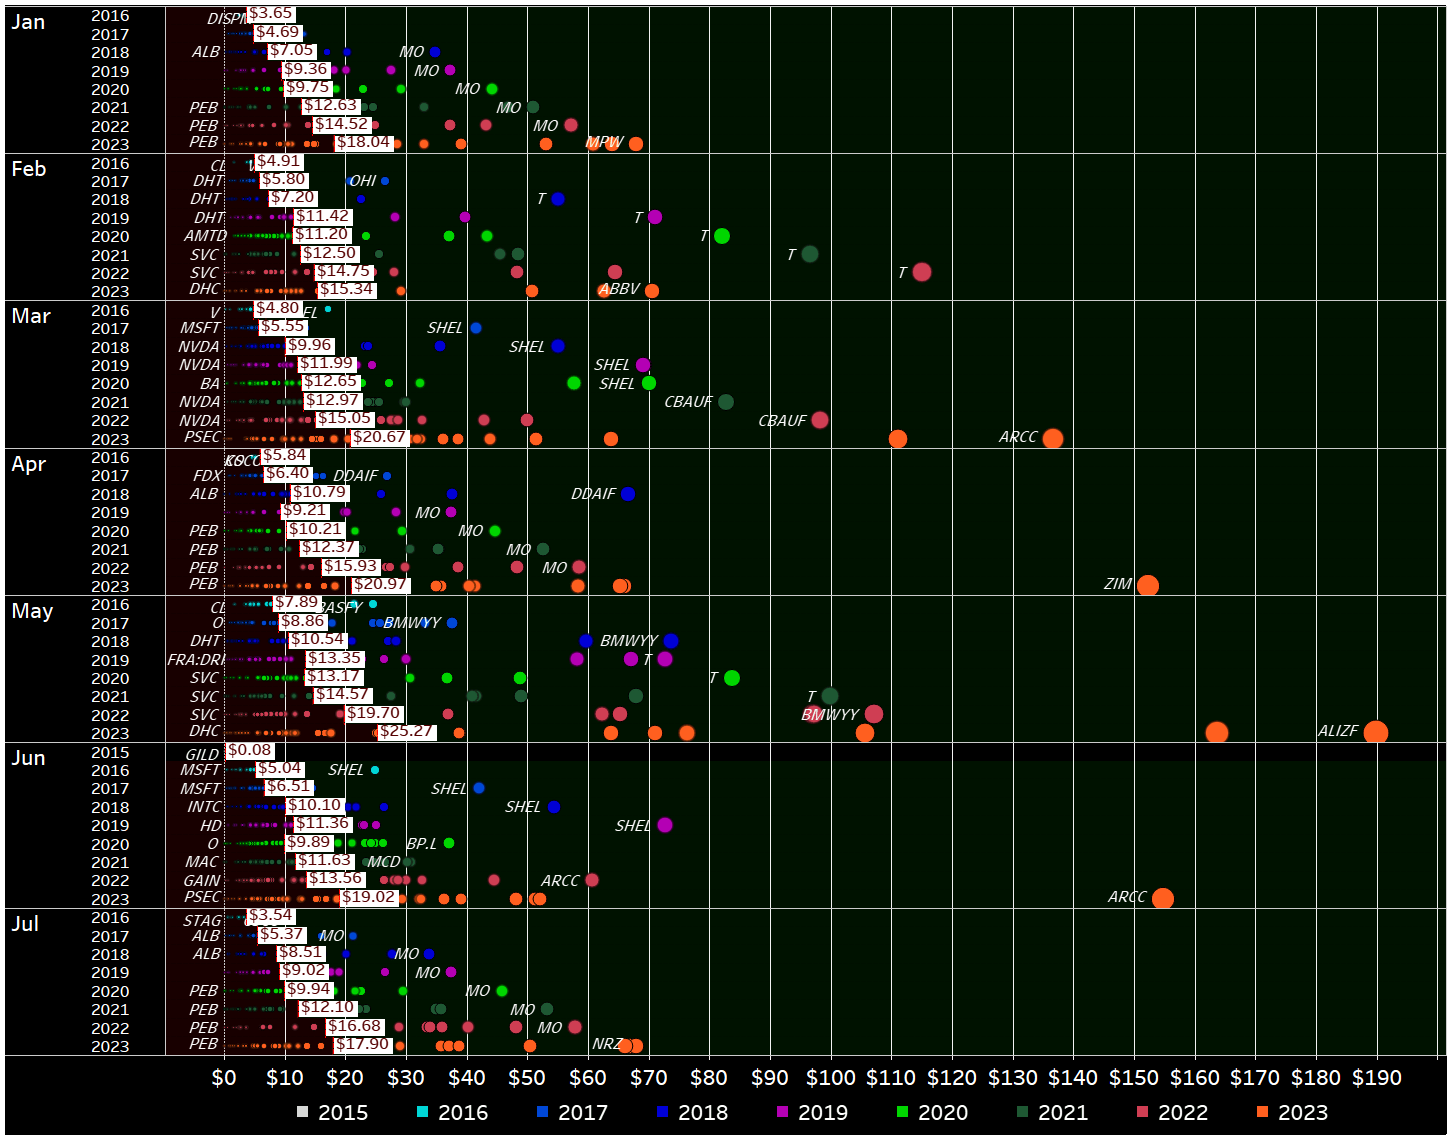
Next, I have plotted all of the individual dividend payments I have received, coloring them by year and arranging the years side by side instead of horizontally as in previous updates. This visualization allows for a more comprehensive analysis of the distribution of my dividend payments over time.
Dividend Payment Bubbles (Designed by author)
By plotting the data in this way, we can easily see the distribution of dividend payments across different years and gain insights into the overall growth of my dividend income over time.
This visualization is initially quite cluttered, but it contains a wealth of information. It shows every individual dividend payment I have received since I began my investment journey in 2015, represented as a circle that is colored and sized according to its contribution. The view is organized by month and year, allowing for a more comprehensive analysis of the development of my dividend income over time. For each year and month, a white rectangle indicates the average monthly dividend. The area where dividends fall below the average is filled in dark red, while the area above the average is colored dark green. I greatly prefer this redesigned version of my old "bubbles chart" because it makes it much easier to identify trends and developments in my dividend income. This type of data visualization allows for a detailed examination of the distribution of my dividend payments over time and enables me to more easily identify trends and patterns in my income growth.
July 2023 Dividends (Designed by author)
Now zooming in on July , we can immediately see a number of big green circles in a sea of black. The bigger the circle and the bigger the distance to the previous circle for the same stock, the bigger is the change in dividend income compared to the prior years.
We can clearly see the dominance and significance of Altria ( MO ), W. P. Carey, and Rithm Capital. They have a strong presence in the visual representation.
When it comes to the dividends for 2023, I notice mostly orange circles at the top of the scale, which is exactly what I want to see. These big orange circles represent a rising dividend income, and my goal is to have as many of them as possible at the top of the chart.
Overall, my aim is to observe numerous large orange circles positioned at the highest point on the scale. This signifies a positive trend of increasing dividend income, which is precisely what I'm striving for.
Another way to express the monthly dividend income is in terms of Gifted Working Time (GWT). Assuming an average hourly rate of $32.34 for 2023, my GWT and annual net dividends have been as follows:
- 2018: 121 hours GWT, $3,000 in annual net dividends
- 2019: 142 hours GWT, $3,600 in annual net dividends
- 2020: 152 hours GWT, $3,800 in annual net dividends
- 2021: 180 hours GWT, $5,050 in annual net dividends
- 2022: 229 hours GWT, $6,400 in annual net dividends
- 2023: Targeting at least 216 hours GWT, $7,000 in annual net dividends
I expect overall GWT to decrease in 2023 due to higher calculated hourly rates, as I project a 10% increase in the hourly rate due to inflation.
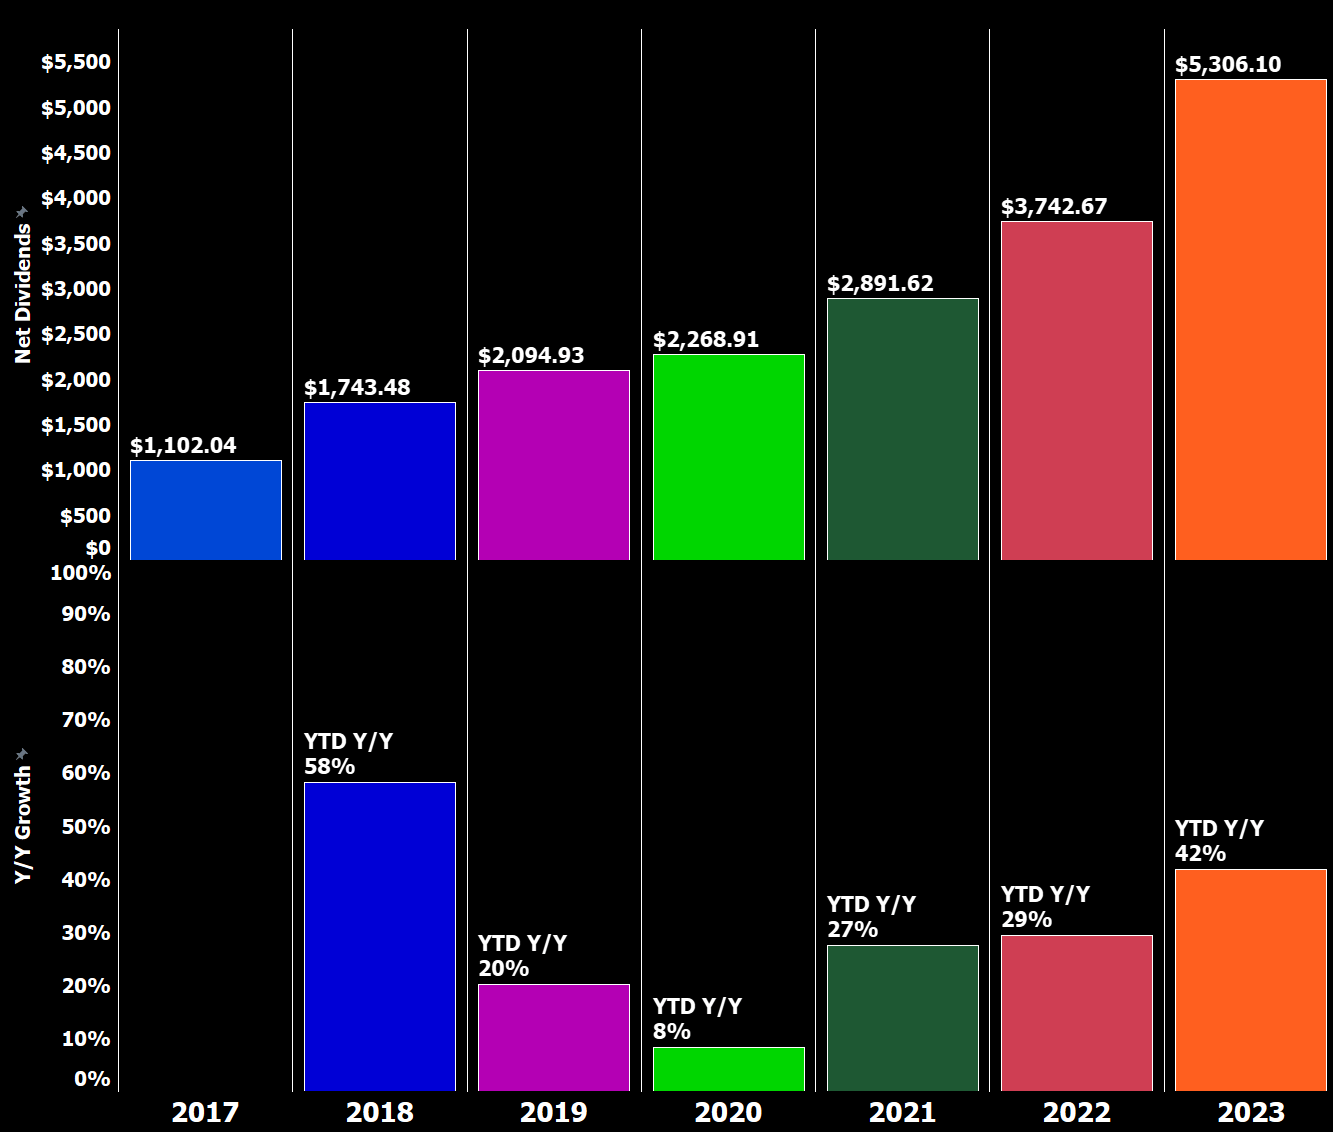
The overall target for the year with $7,000 in annual net dividends is very conservative, but I expect that I will have to take out some risk from my portfolio as mentioned above. Also, the stronger euro (I am receiving dividends in EUR and then converting those to USD at current exchange rates for these updates) will have adverse impact. Still, as the year unfolds, I expect to be able to pass that target and potentially even reach my next milestone of $8,000 as well. By the end of July 2023, my realized dividend income has been blowing away my expectations by several dimensions with YTD net dividend growth coming in at a sizzling and unsustainable 42% Y/Y (down only marginally from the 45% growth rate at the end of June). That growth will certainly come down substantially as the year unfolds, but given I am only targeting a low single-digit growth rate, it is already clear that barring a major disaster I will easily achieve a double-digit growth rate in dividend income, which is fantastic and should thus easily smash my original target of $7,000 in annual net dividends.
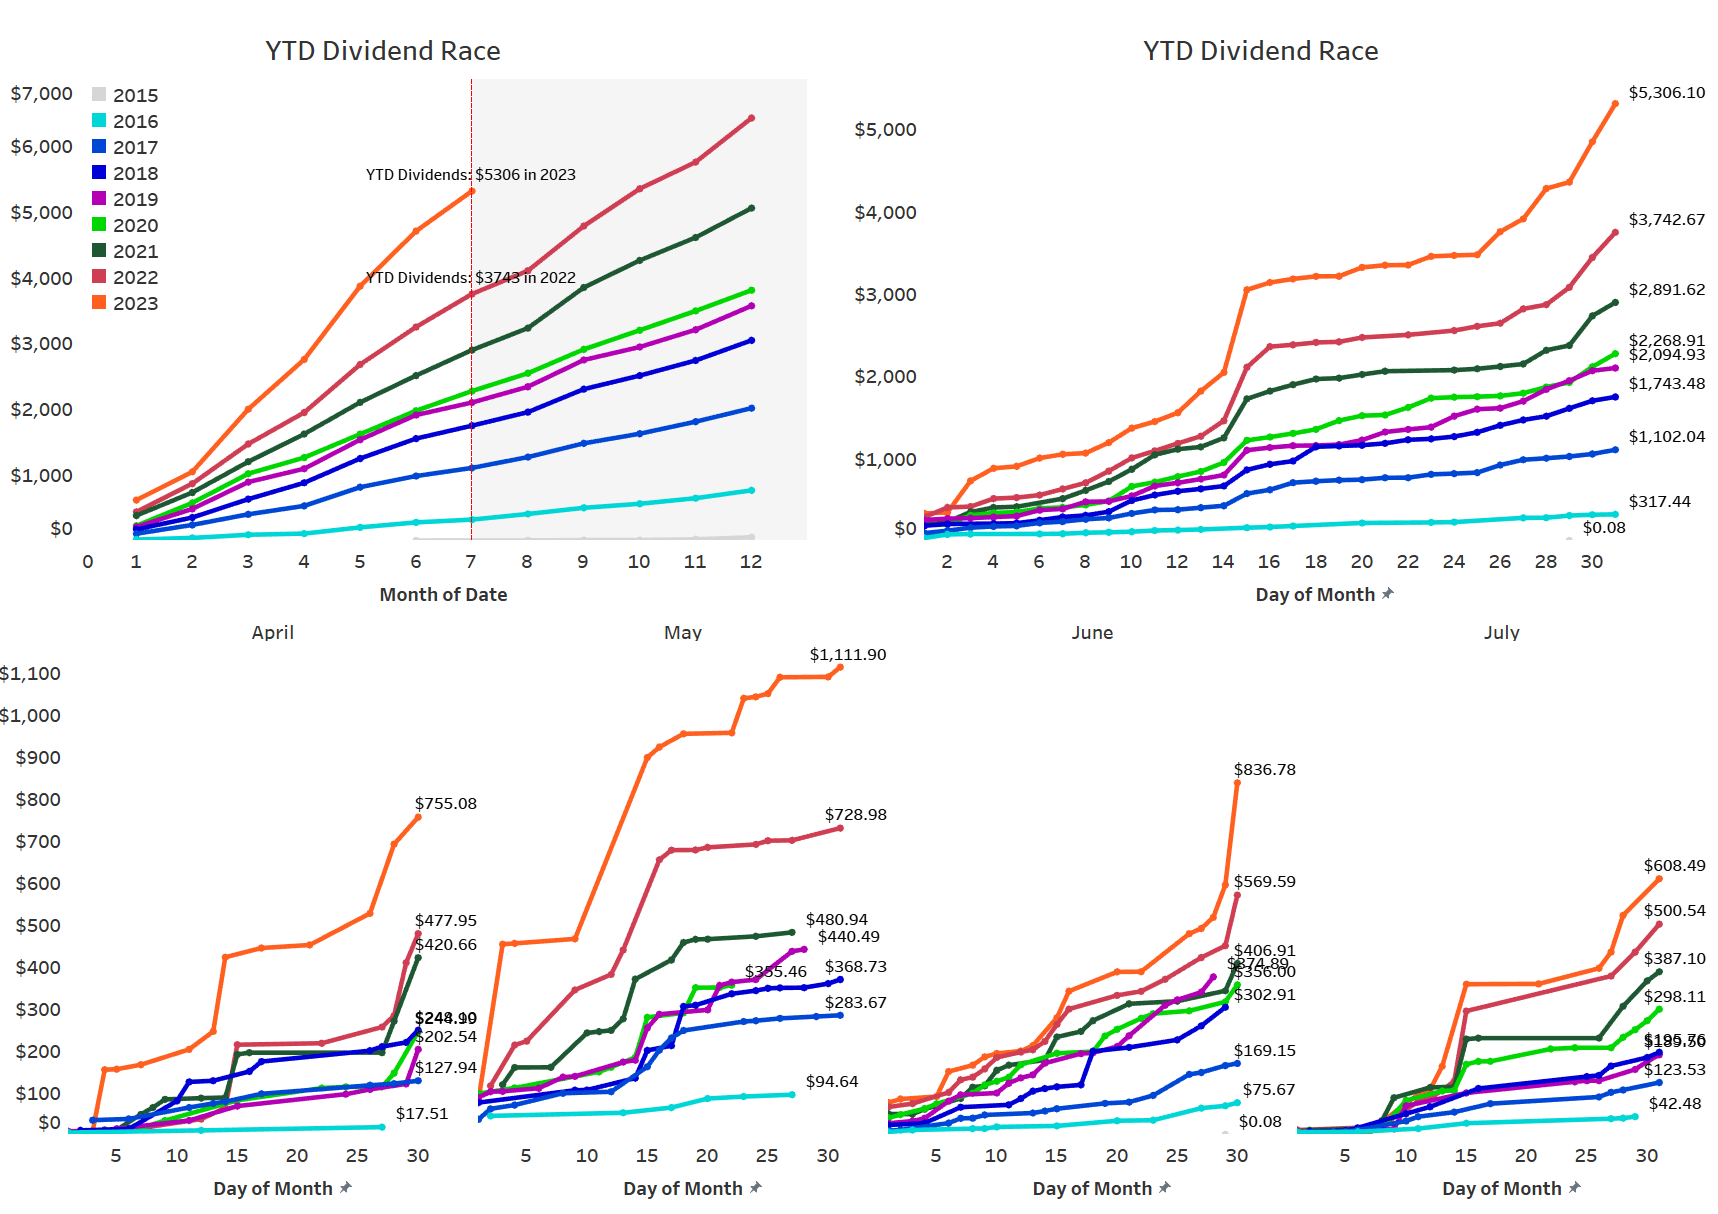
Across the years, my YTD Dividend Race has been as follows:
- 2018: Disappointing
- 2019: Phenomenal, benefiting from a low baseline in the prior year
- 2020: Fairly disappointing
- 2021: Phenomenal
- 2022: Much better than expected fueled by the very weak euro
- 2023: Targeting a conservative low single-digit growth rate (the more likely scenario is now a 10-15% increase in dividend income, possibly even 20%+)
YTD Dividend Growth (Designed by author)
I have updated the YTD Dividend Race chart to show the development of YTD dividend income on a daily basis, allowing us to see that most of my dividend income is generated mid-month and towards the end of the month. The chart also breaks down the development by month for the current year, making it easy to identify significant jumps in income.
YTD Dividend Race (Designed by author)
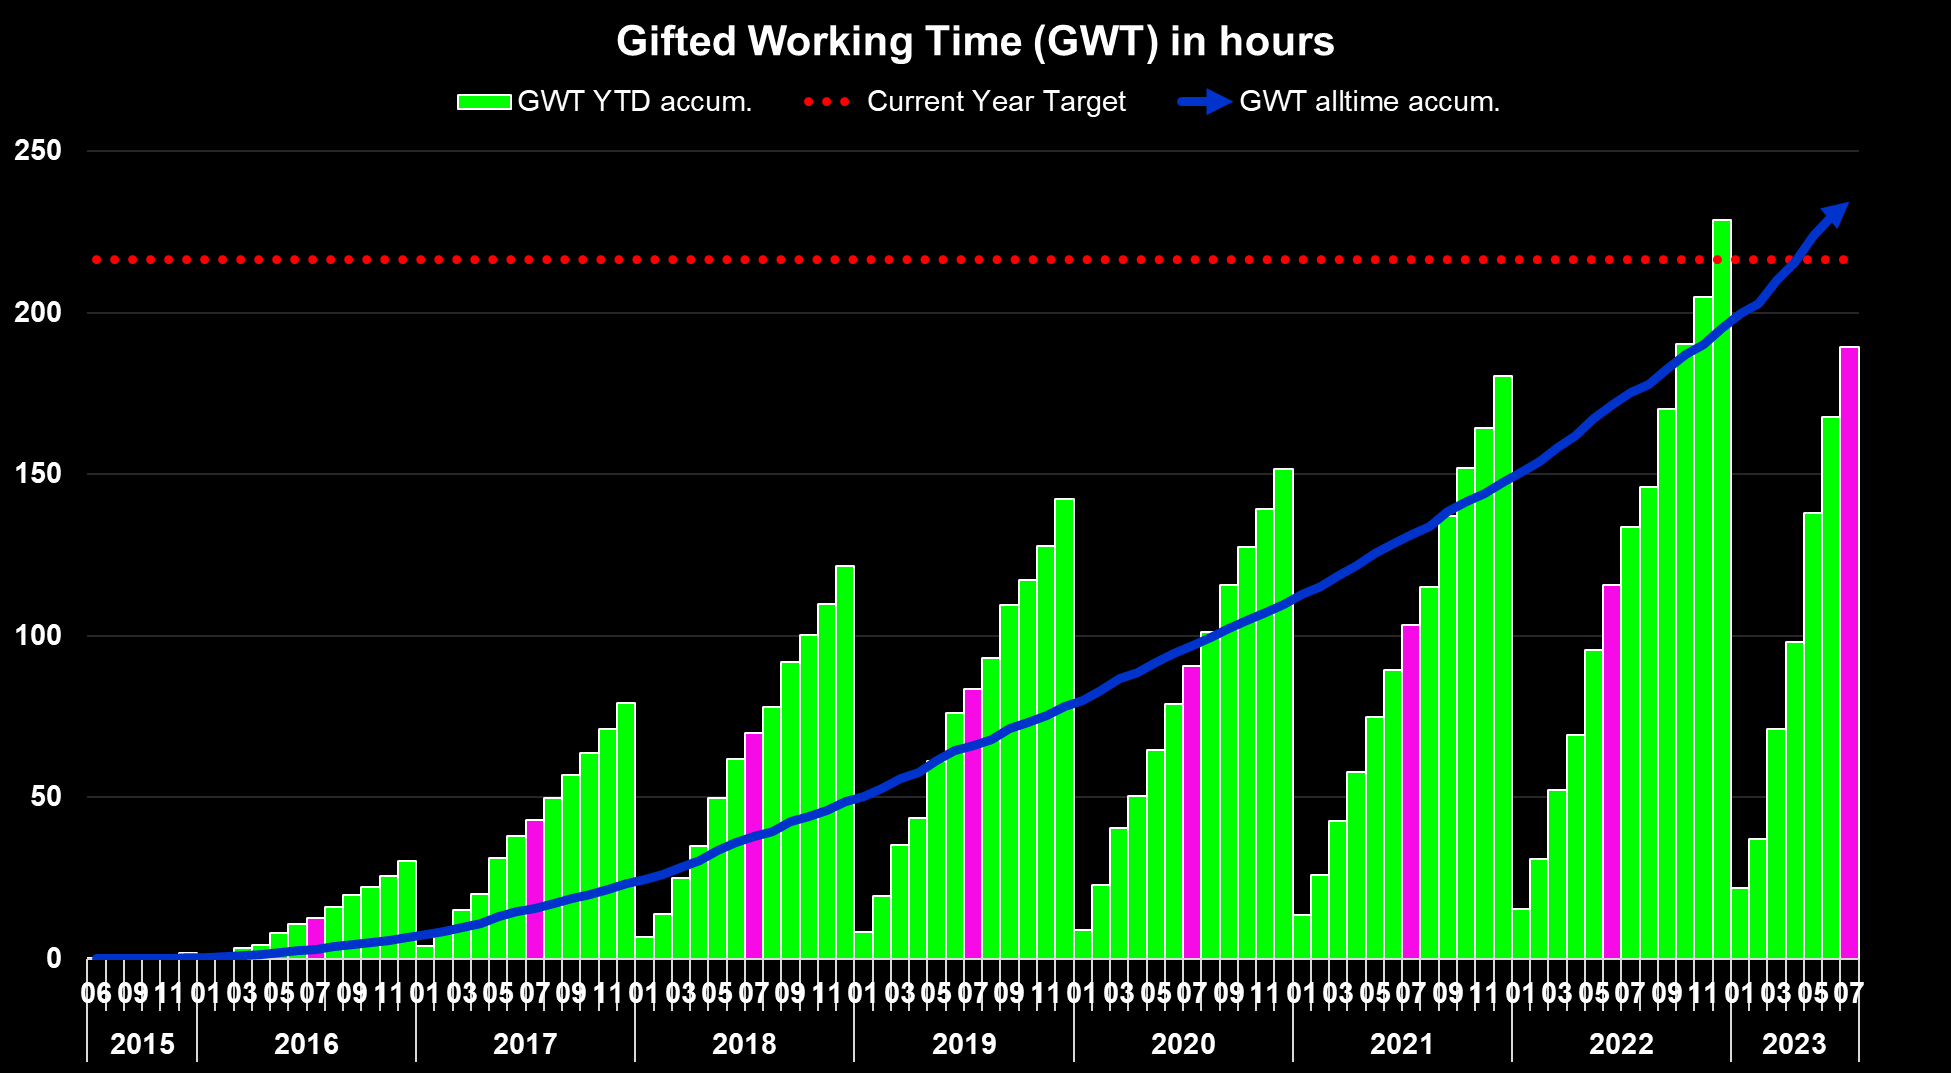
Expressed in GWT, it presents itself as follows:
Gifted Working Time in Hours (Designed by author)
What this shows is as follows:
- All time (blue area) - Around 1,126 hours, or 141 days, of active work have been replaced with passive income since the start of my dividend journey. Assuming a five-day workweek, this translates into more than 28 weeks of vacation funded via dividends, which itself is equal to more than half a year in total.
- Full-year 2023 (green bars) - Around 189.5 hours, or 23.7 days, of active work have been replaced with passive income in 2023 already, which is basically equivalent to four full-time working weeks funded with dividends, or to put differently, the YTD dividends have so far provided me with an extra monthly salary and if this trend continues, it will accumulate to over two monthly salaries by year-end even though the second part of the year is expected to be weaker than the first half due to the volume of annual dividend payers in Q2.
- Highlighted in pink is the accumulated YTD total at the end of the current reporting month ( July ).
This visualization allows us to see the overall impact of my dividend income on the amount of active work I am able to replace with passive income. It also enables us to see the progress made year-to-date, as well as the accumulated total at the end of the current reporting month.
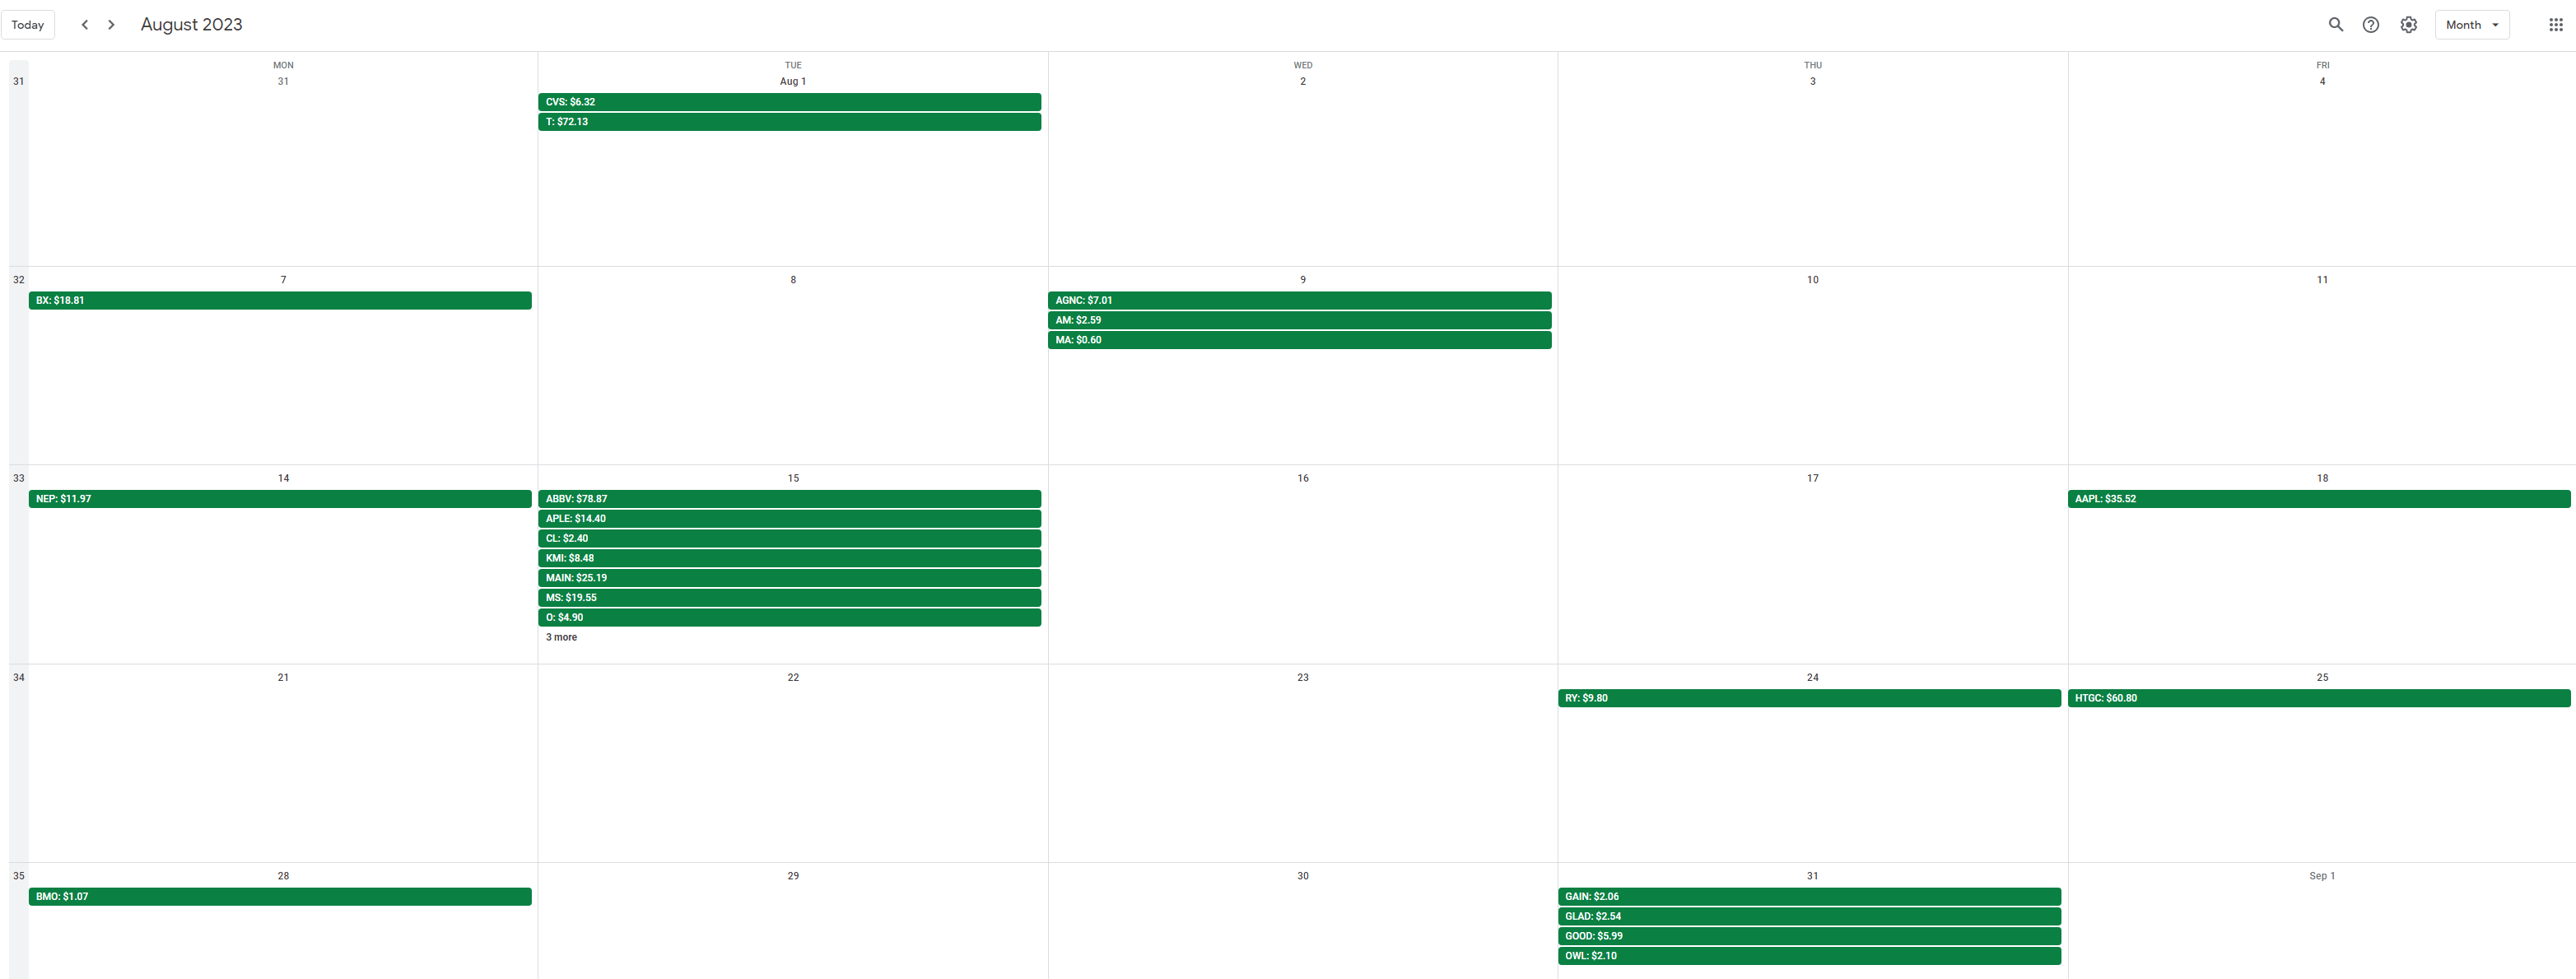
Upcoming August Dividends
Contrary to July, August features significantly fewer dividend payers but among them are the big annual dividends from German companies as well as the still sizable dividend from AT&T ( T ). Beyond that dividend payments are overall concentrated in the first half of the month with only 1 meaningful dividend payment from the Royal Bank of Canada ( RY ) expected in the second half of August.
The snapshot below is taken from my free-for-all released Dividend Calendar (make sure to follow instructions in the video) and shows my expected dividend payments in August.
My Dividend Calendar (Designed by author)
At the end of July, my dividend portfolio is composed as follows:
| Company Name |
| Ticker |
| % Market Value |
| Market Value (€) |
| Apple Inc. |
| ( AAPL ) |
| 11.60% |
| 24,507 |
| Visa Inc. |
| ( V ) |
| 4.17% |
| 8,805 |
| Microsoft Corporation |
| ( MSFT ) |
| 3.68% |
| 7,765 |
| McDonald's Corp |
| ( MCD ) |
| 3.62% |
| 7,655 |
| AbbVie Inc. |
| ( ABBV ) |
| 3.54% |
| 7,475 |
| NVIDIA Corporation |
| ( NVDA ) |
| 3.20% |
| 6,751 |
| Ares Capital Corporation |
| ((ARCC)) |
| 2.92% |
| 6,173 |
| Cisco Systems, Inc. |
| ( CSCO ) |
| 2.73% |
| 5,766 |
| Commonwealth Bank of Australia |
| ( CBAUF ) |
| 2.44% |
| 5,160 |
| Main Street Capital Corporation |
| ( MAIN ) |
| 2.28% |
| 4,813 |
| Johnson & Johnson |
| ( JNJ ) |
| 2.27% |
| 4,804 |
| STAG Industrial, Inc. |
| ( STAG ) |
| 2.20% |
| 4,649 |
| W. P. Carey |
| ((WPC)) |
| 2.14% |
| 4,525 |
| JPMorgan Chase & Co. |
| ( JPM ) |
| 2.01% |
| 4,242 |
| Shell |
| ( SHEL ) |
| 2.00% |
| 4,215 |
| Home Depot |
| ( HD ) |
| 1.80% |
| 3,803 |
| Allianz SE |
| ( ALIZF ) |
| 1.74% |
| 3,666 |
| Texas Instruments Incorporated |
| ( TXN ) |
| 1.72% |
| 3,636 |
| AT&T Inc. |
| ((T)) |
| 1.65% |
| 3,485 |
| Broadcom Inc. |
| ( AVGO ) |
| 1.53% |
| 3,225 |
| Gilead Sciences, Inc. |
| ( GILD ) |
| 1.52% |
| 3,204 |
| Altria Group, Inc. |
| ((MO)) |
| 1.50% |
| 3,160 |
| Toronto-Dominion Bank |
| ( TD ) |
| 1.49% |
| 3,149 |
| Wells Fargo & Co |
| ( WFC ) |
| 1.49% |
| 3,148 |
| Southern Co |
| ( SO ) |
| 1.49% |
| 3,138 |
| Hercules Capital |
| ( HTGC ) |
| 1.45% |
| 3,066 |
| New Residential Corporation |
| ( RITM ) |
| 1.37% |
| 2,902 |
| Blackstone Group LP |
| ( BX ) |
| 1.24% |
| 2,622 |
| Bank of Nova Scotia |
| ( BNS ) |
| 1.24% |
| 2,609 |
| Siemens Healthineers |
| ( SEMHF ) |
| 1.23% |
| 2,600 |
| BMW |
| ( BMWYY ) |
| 1.16% |
| 2,448 |
| Intel Corporation |
| ( INTC ) |
| 1.09% |
| 2,299 |
| Enbridge |
| ( ENB ) |
| 1.07% |
| 2,256 |
| Apollo Investment |
| ((MFIC)) |
| 0.95% |
| 2,006 |
| PepsiCo, Inc. |
| ( PEP ) |
| 0.92% |
| 1,954 |
| Morgan Stanley |
| ( MS ) |
| 0.88% |
| 1,852 |
| Procter & Gamble Co |
| ( PG ) |
| 0.86% |
| 1,821 |
| BP2 |
| ( BP ) |
| 0.84% |
| 1,784 |
| BP1 |
| ( BP ) |
| 0.74% |
| 1,555 |
| Philip Morris International Inc. |
| ( PM ) |
| 0.72% |
| 1,520 |
| Starwood Property Trust, Inc. |
| ( STWD ) |
| 0.71% |
| 1,497 |
| Medical Properties Trust |
| ( MPW ) |
| 0.69% |
| 1,455 |
| Daimler |
| (DDAIF) |
| 0.68% |
| 1,440 |
| Realty Income Corp |
| ( O ) |
| 0.66% |
| 1,386 |
| Honeywell International Inc. |
| ( HON ) |
| 0.65% |
| 1,373 |
| Bank of America Corp |
| ( BAC ) |
| 0.60% |
| 1,277 |
| NextEra Energy Partners LP |
| ( NEP ) |
| 0.52% |
| 1,092 |
| Brookfield Renewable Partners |
| ( BEP ) |
| 0.52% |
| 1,092 |
| The Coca-Cola Co |
| ( KO ) |
| 0.52% |
| 1,091 |
| Stryker |
| ( SYK ) |
| 0.51% |
| 1,075 |
| Gladstone Commercial Corporation |
| ( GOOD ) |
| 0.50% |
| 1,062 |
| Unilever NV ADR |
| ( UL ) |
| 0.49% |
| 1,035 |
| Target Corporation |
| ( TGT ) |
| 0.46% |
| 962 |
| 3M Co |
| ( MMM ) |
| 0.45% |
| 957 |
| Gladstone Capital |
| ( GLAD ) |
| 0.44% |
| 929 |
| Annaly Capital Management |
| ( NLY ) |
| 0.42% |
| 881 |
| Royal Bank of Canada |
| ( RY ) |
| 0.41% |
| 869 |
| Gladstone Investment |
| ( GAIN ) |
| 0.40% |
| 843 |
| CVS Health Corp |
| ( CVS ) |
| 0.39% |
| 820 |
| Apple Hospitality REIT |
| ( APLE ) |
| 0.39% |
| 817 |
| AGNC Investment Corporation |
| ( AGNC ) |
| 0.34% |
| 721 |
| General Electric Company |
| ( GE ) |
| 0.34% |
| 718 |
| Medtronic |
| ( MDT ) |
| 0.33% |
| 695 |
| Sino AG |
| (X T P.F) |
| 0.33% |
| 690 |
| Spirit Realty Corporation |
| ( SRC ) |
| 0.32% |
| 677 |
| BASF |
| ( OTCQX:BASFY ) |
| 0.32% |
| 672 |
| Dominion Energy Inc |
| ( D ) |
| 0.32% |
| 669 |
| Verizon Communications Inc. |
| ( VZ ) |
| 0.30% |
| 638 |
| B&G Foods, Inc. |
| ( BGS ) |
| 0.30% |
| 625 |
| Canadian Imperial Bank of Commerce |
| ( CM ) |
| 0.29% |
| 617 |
| Antero Midstream Corporation |
| ( AM ) |
| 0.28% |
| 585 |
| Exxon Mobil Corporation |
| ( XOM ) |
| 0.27% |
| 575 |
| NextEra Energy |
| ( NEE ) |
| 0.25% |
| 536 |
| Walgreens Boots Alliance Inc |
| ( WBA ) |
| 0.24% |
| 506 |
| Vonovia |
| ( OTCPK:VONOY ) |
| 0.23% |
| 483 |
| Kinder Morgan Inc |
| ( KMI ) |
| 0.22% |
| 472 |
| Apollo Commercial Real Est. Finance Inc |
| ( ARI ) |
| 0.21% |
| 447 |
| Pfizer Inc. |
| ( PFE ) |
| 0.21% |
| 445 |
| Alibaba Group Holding Ltd |
| ( BABA ) |
| 0.21% |
| 439 |
| Sixt |
| ( OTC:SXTSY ) |
| 0.19% |
| 402 |
| ZIM Integrated Shipping Services |
| ( ZIM ) |
| 0.19% |
| 396 |
| Mastercard |
| ( MA ) |
| 0.18% |
| 375 |
| Colgate-Palmolive Company |
| ( CL ) |
| 0.16% |
| 346 |
| Omega Healthcare Investors Inc |
| ( OHI ) |
| 0.16% |
| 344 |
| Bayer AG |
| ( OTCPK:BAYZF ) |
| 0.15% |
| 318 |
| BRT Realty Trust |
| ( BRT ) |
| 0.14% |
| 297 |
| Blue Owl Capital |
| ( OWL ) |
| 0.08% |
| 167 |
| Fresenius SE |
| ( OTCPK:FSNUF ) |
| 0.08% |
| 162 |
| Boeing |
| ( BA ) |
| 0.07% |
| 155 |
| Owl Rock Capital Corporation |
| ( OBDC ) |
| 0.06% |
| 134 |
| Equitrans Midstream Corporation |
| ( ETRN ) |
| 0.06% |
| 123 |
| Diversified Healthcare Trust |
| ( DHC ) |
| 0.05% |
| 105 |
| Uniti Group Inc. |
| ( UNIT ) |
| 0.05% |
| 95 |
| Fresenius Medical Care |
| (F MS ) |
| 0.04% |
| 94 |
| Newtek Business Services |
| ( NEWT ) |
| 0.04% |
| 84 |
| Bank of Montreal |
| ( BMO ) |
| 0.04% |
| 81 |
| Walt Disney Co |
| ( DIS ) |
| 0.04% |
| 78 |
| The GEO Group Inc |
| ( GEO ) |
| 0.02% |
| 46 |
| Service Properties Trust |
| ( SVC ) |
| 0.02% |
| 37 |
For further details see:
My Dividend Stock Portfolio: New July Dividend Record - 99 Holdings With 26 Buys