TGT - My Dividend Stock Portfolio: New October Record - 103 Holdings With 27 Buys
Summary
- Inflation and (expected) actions by the Federal Reserve continue to dominate market movements.
- Markets remain very volatile following record inflation readings paired with an aggressive Fed and negative consumer sentiment.
- US-China relations remain tense but so far don't really seem to impact the stock markets as long as no further escalation occurs.
- My dividend income amounted to a new October record of $566, which is up 63% Y/Y and up 16% sequentially.
- Gifted Working Time in 2022: Around 190 hours, or 23.8 days, of active work have been replaced with passive income in 2022 already.
Portfolio Changes in October
October was another very busy month as I made another partial sale of STORE Capital ( STOR ) following the acquisition news that will take STORE private at $32.25. I still don't understand as to why they sold out the company at such a firesale price and although it smells shady there that is just my opinion regarding that matter. STORE produced great Q3 figures but all that is in vain. The best thing to do if one wants to benefit from such a strong business is probably just to buy Blue Owl ( OWL ). That said my investment in STORE was very profitable and I will the remaining half probably very soon as the appreciating euro is now hurting my overall proceeds when the position gets eventually liquidated. Unfortunately, the bargain prices for BDCs and REITs are nowhere to be seen anymore following a very strong earnings season and enormous buying across the entire sector.
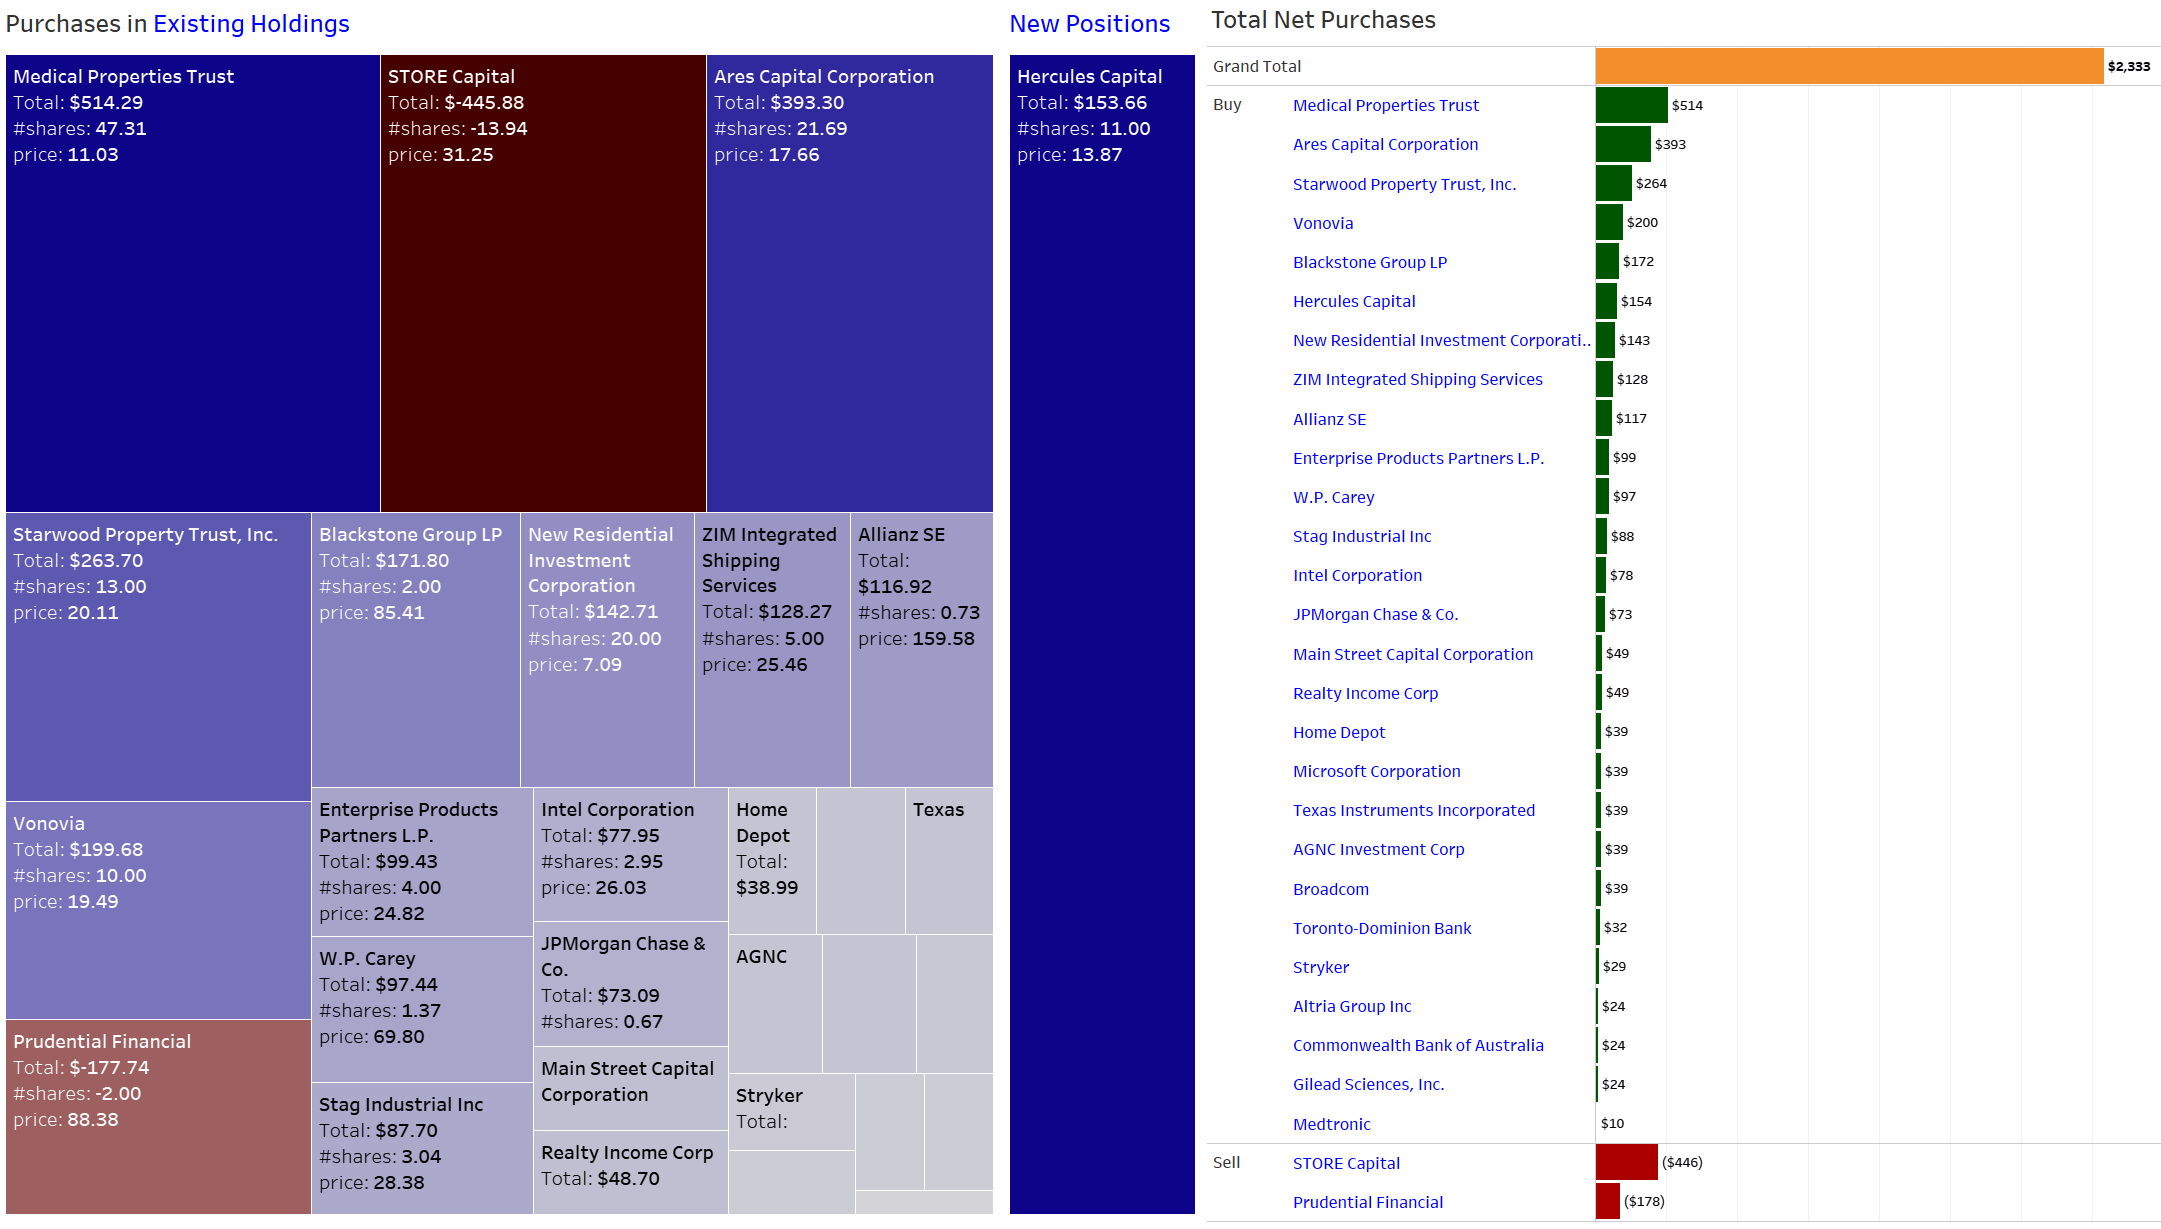
Net investment activity in October amounted to a very solid $2,300 following reduced buying in July. The proceeds from my partial sale of STORE were invested into Ares Capital Corporation ( ARCC ) and Medical Properties Trust ( MPW ). Both of them were and are yielding well in excess of 5% which is warranted in that rising interest rate environment.
I also purchased a couple of additional shares in Vonovia ( OTCPK:VONOY ) and ZIM Integrated Shipping Services ( ZIM ) after the latter had been beaten down to extreme levels. The dividend is sky-high right now but that is obviously backward-looking and future dividend payments will be way lower following a significant decline in freight rates amid a deteriorating global economy. A recession is probably coming latest next year but the company is paying a strong dividend even though that will have to be cut in subsequent quarters as freight rates will likely come down. The current quarterly dividend of $4.75 is eye-watering but probably comes at the peak of the cycle. Even the $2.00 quarterly dividend of 2021 is more than enough to keep me patient as the company navigates through troubled economic waters as shipping rates are coming down hard. Stocks fluctuate which creates buying opportunities and I believe this is one, maybe too early but certainly much better than when the stock was twice the price not too long ago.
I also initiated a new position in Hercules Capital ( HTGC ) as I figured BDCs are in great shape and actually benefitting from rising rates unless it reaches extreme levels. Shortly after my purchase news broke about an unexpected dividend increase from Hercules and the declaration of another juicy supplemental dividend. Needless to say the stock has been racing higher ever since further fueled by some great earnings as well. I intend to expand that position to at least 100 shares by the end of the year and turn it into a sizable dividend payer in the traditionally low-income months of February, May, August and November.
Apart from that all other purchases were triggered by the almost weekly savings plans.
Due to the nature of how the monthly investment plan process works, I am investing relatively equally into these stocks at two points of time during the month - at the beginning of the month and mid-month - which breaks down as shown below. Figures are in Euro and show that, for instance, at the beginning of the month, I am investing between 50 and 75 EUR each into Microsoft, The Home Depot (NYSE: HD ), Visa (NYSE: V ), W. P. Carey ( WPC ), and BP (NYSE: BP ). Mid-month, I am adding between 33 and 40 EUR each into STAG Industrial (NYSE: STAG ), AT&T ( T ), NextEra Energy (NYSE: NEE ), Toronto-Dominion Bank (NYSE: TD ), Main Street Capital (NYSE: MAIN ) and JPMorgan (NYSE: JPM ).
I have added several investment plans starting mid-September 2020 which include AGNC Investment Corp. (NASDAQ: AGNC ), Ares Capital (NASDAQ: ARCC ), Medical Properties Trust (NYSE: MPW ), The Bank of Nova Scotia (NYSE: BNS ) and The Trade Desk (NASDAQ: TTD ). Investments here will be focused on high-yield as well as high-growth stocks in the technology, therapeutic and renewables sectors.
All those purchases substantially raised my forward annual dividend income, breaking down as follows:
Added Dividend Income (Designed by author)
All net purchases in October can be found below:
October 2022 Net Purchases (Designed by author)
Dividend Income: What Happened on the Dividend Side?
Dividend income hit a new July record of $566 and is up an explosive 63% annually and up 16% sequentially.
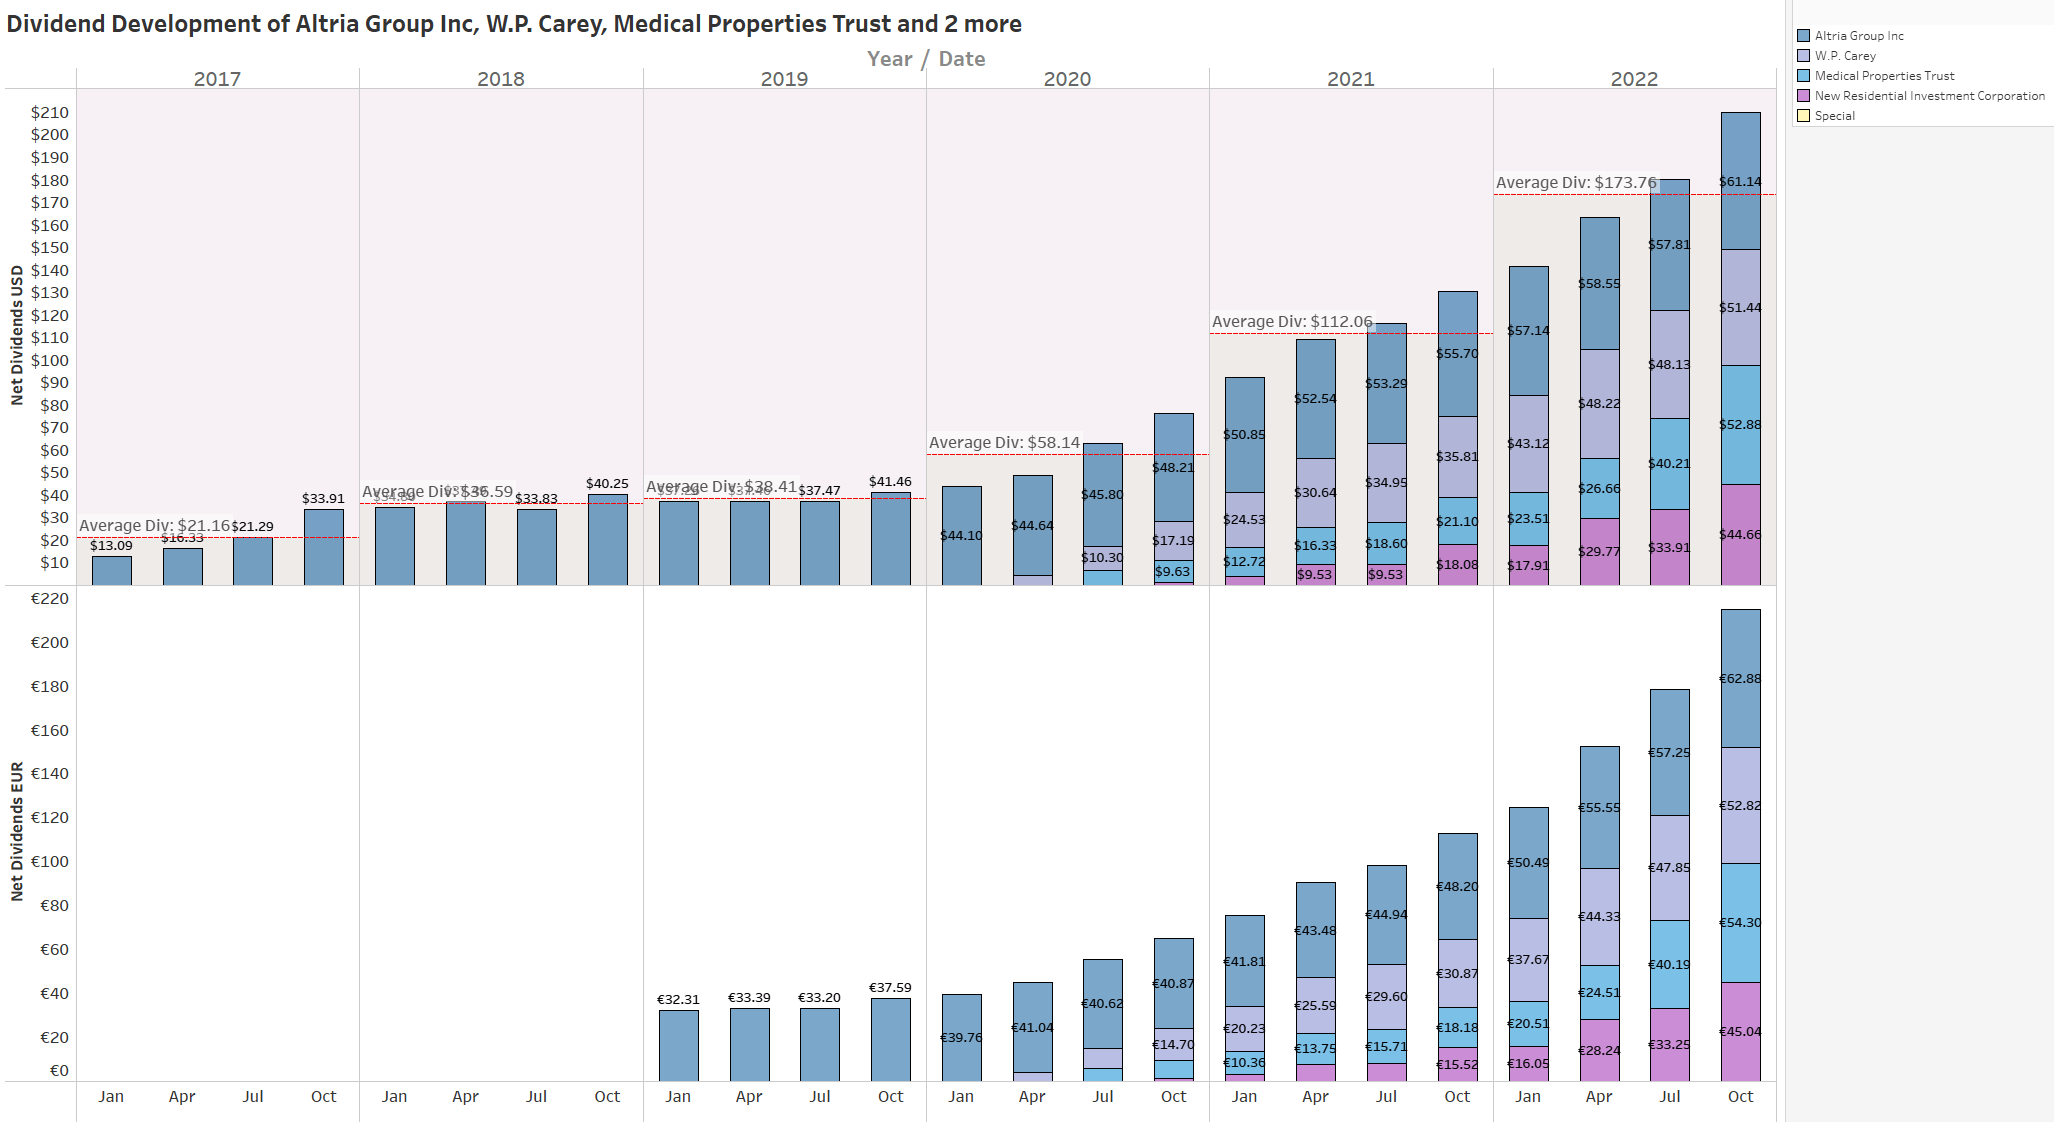
The main income drivers are the 5 of the 6 dividend stocks (Ares Capital Corporation is the 6th one) that I am buying at least once every month: STAG Industrial ( STAG ), STORE Capital ( STOR ), Medical Properties Trust and New Residential Corporation now known as Rithm ( RITM ) and W. P. Carey ( WPC) .
The near-term goal for each of these positions is to reach at least $100 in quarterly dividend income with further big increases expected thereafter. I have no hesitation in buying them for the long-term even though I understand that rising rates and relatively high leverage for MPW and RITM and not everyone's taste. Obviously, as far as STOR is concerned, this dividend will disappear in the future but I plan for HTGC to assume STOR's role even though it pays in different months.
October 2022 Dividend Income (Designed by author)
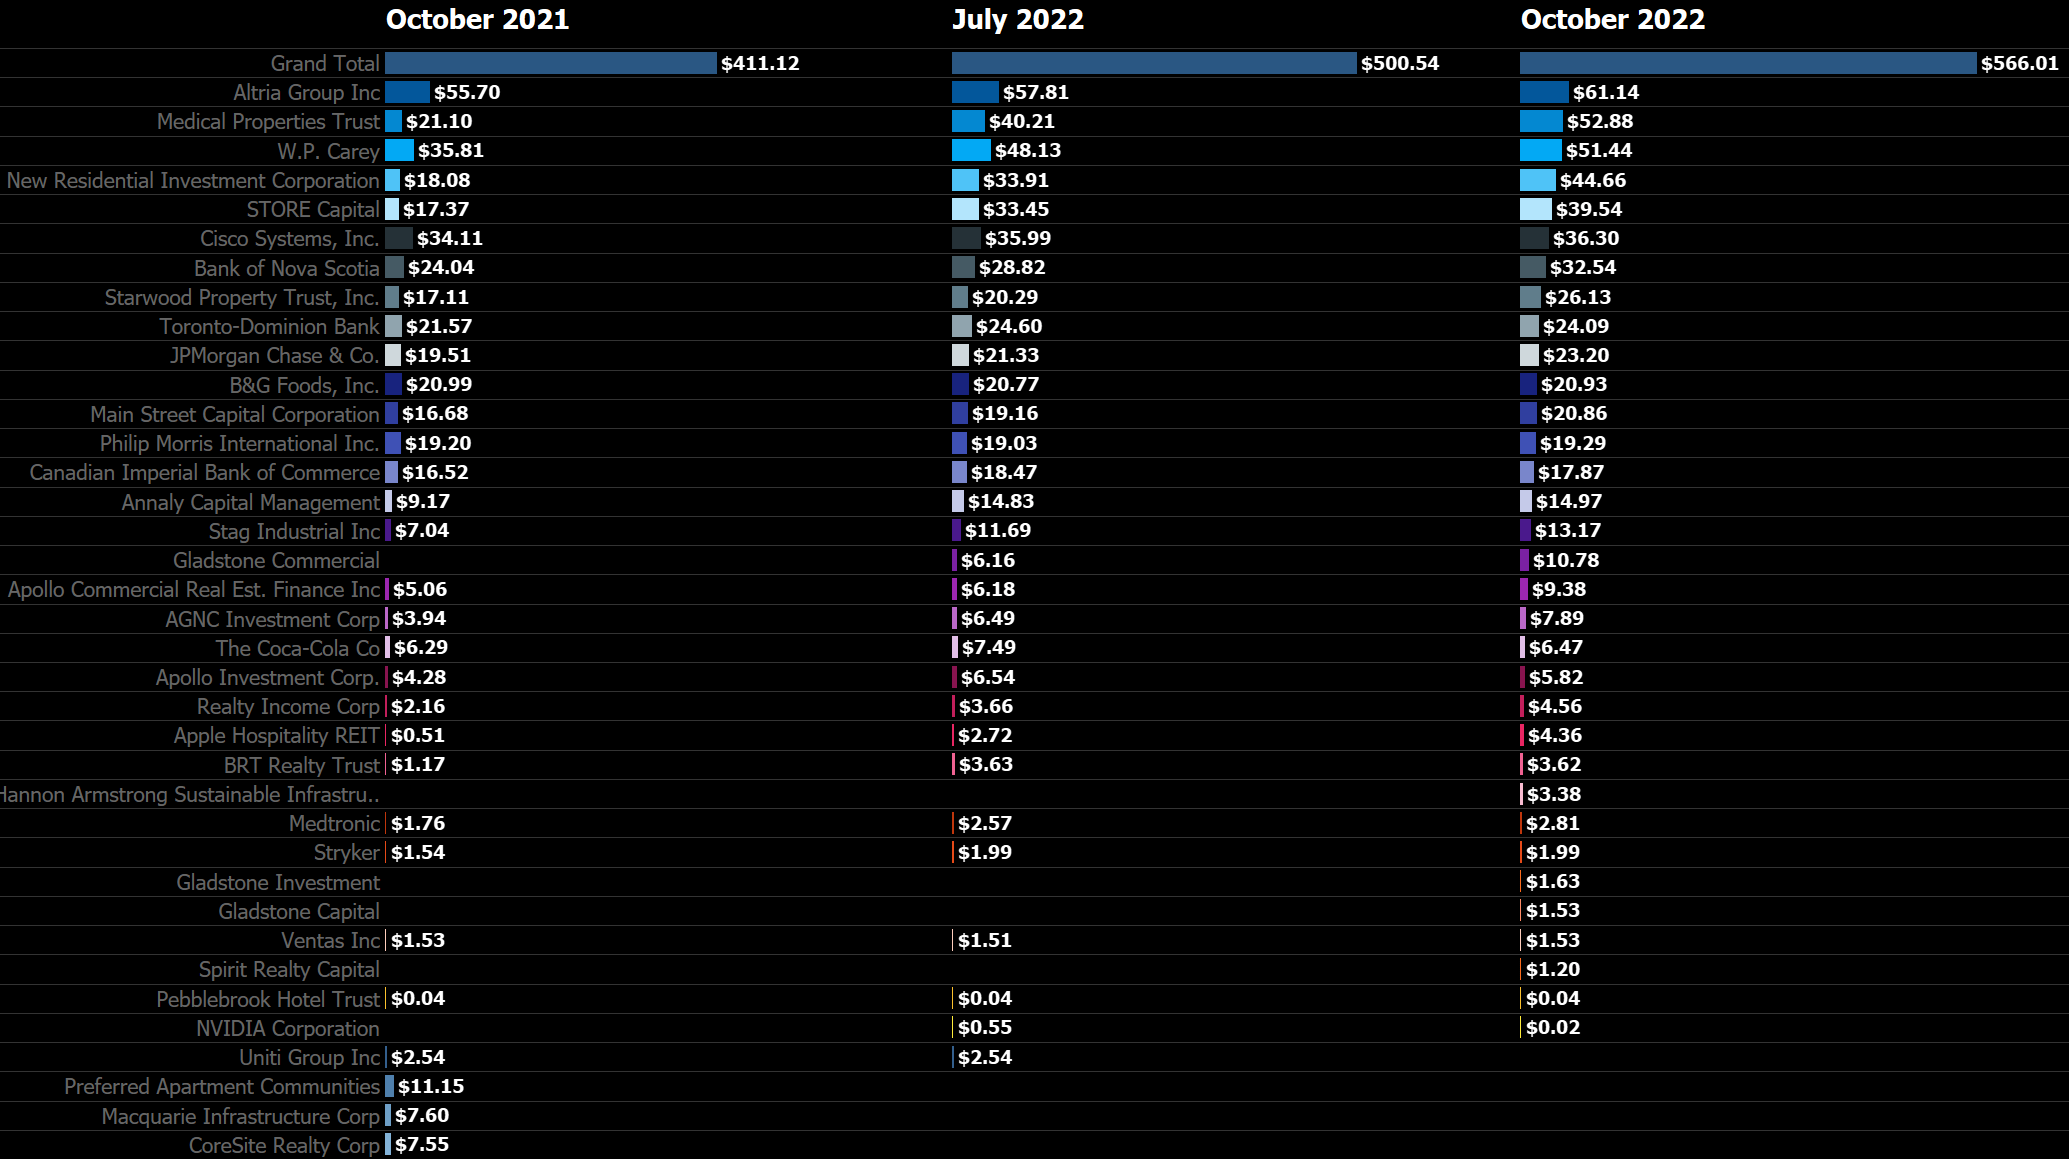
That said I already have three dividend payers with at least $50 in net dividends in October which I am really excited about.
The focus on these stocks also shows when looking at the Top 4 Dividend Payers in October featuring MPW, WPC and RITM and one of them will soon take Altria's top spot.
Top 4 Dividend Payers (Designed by Author)
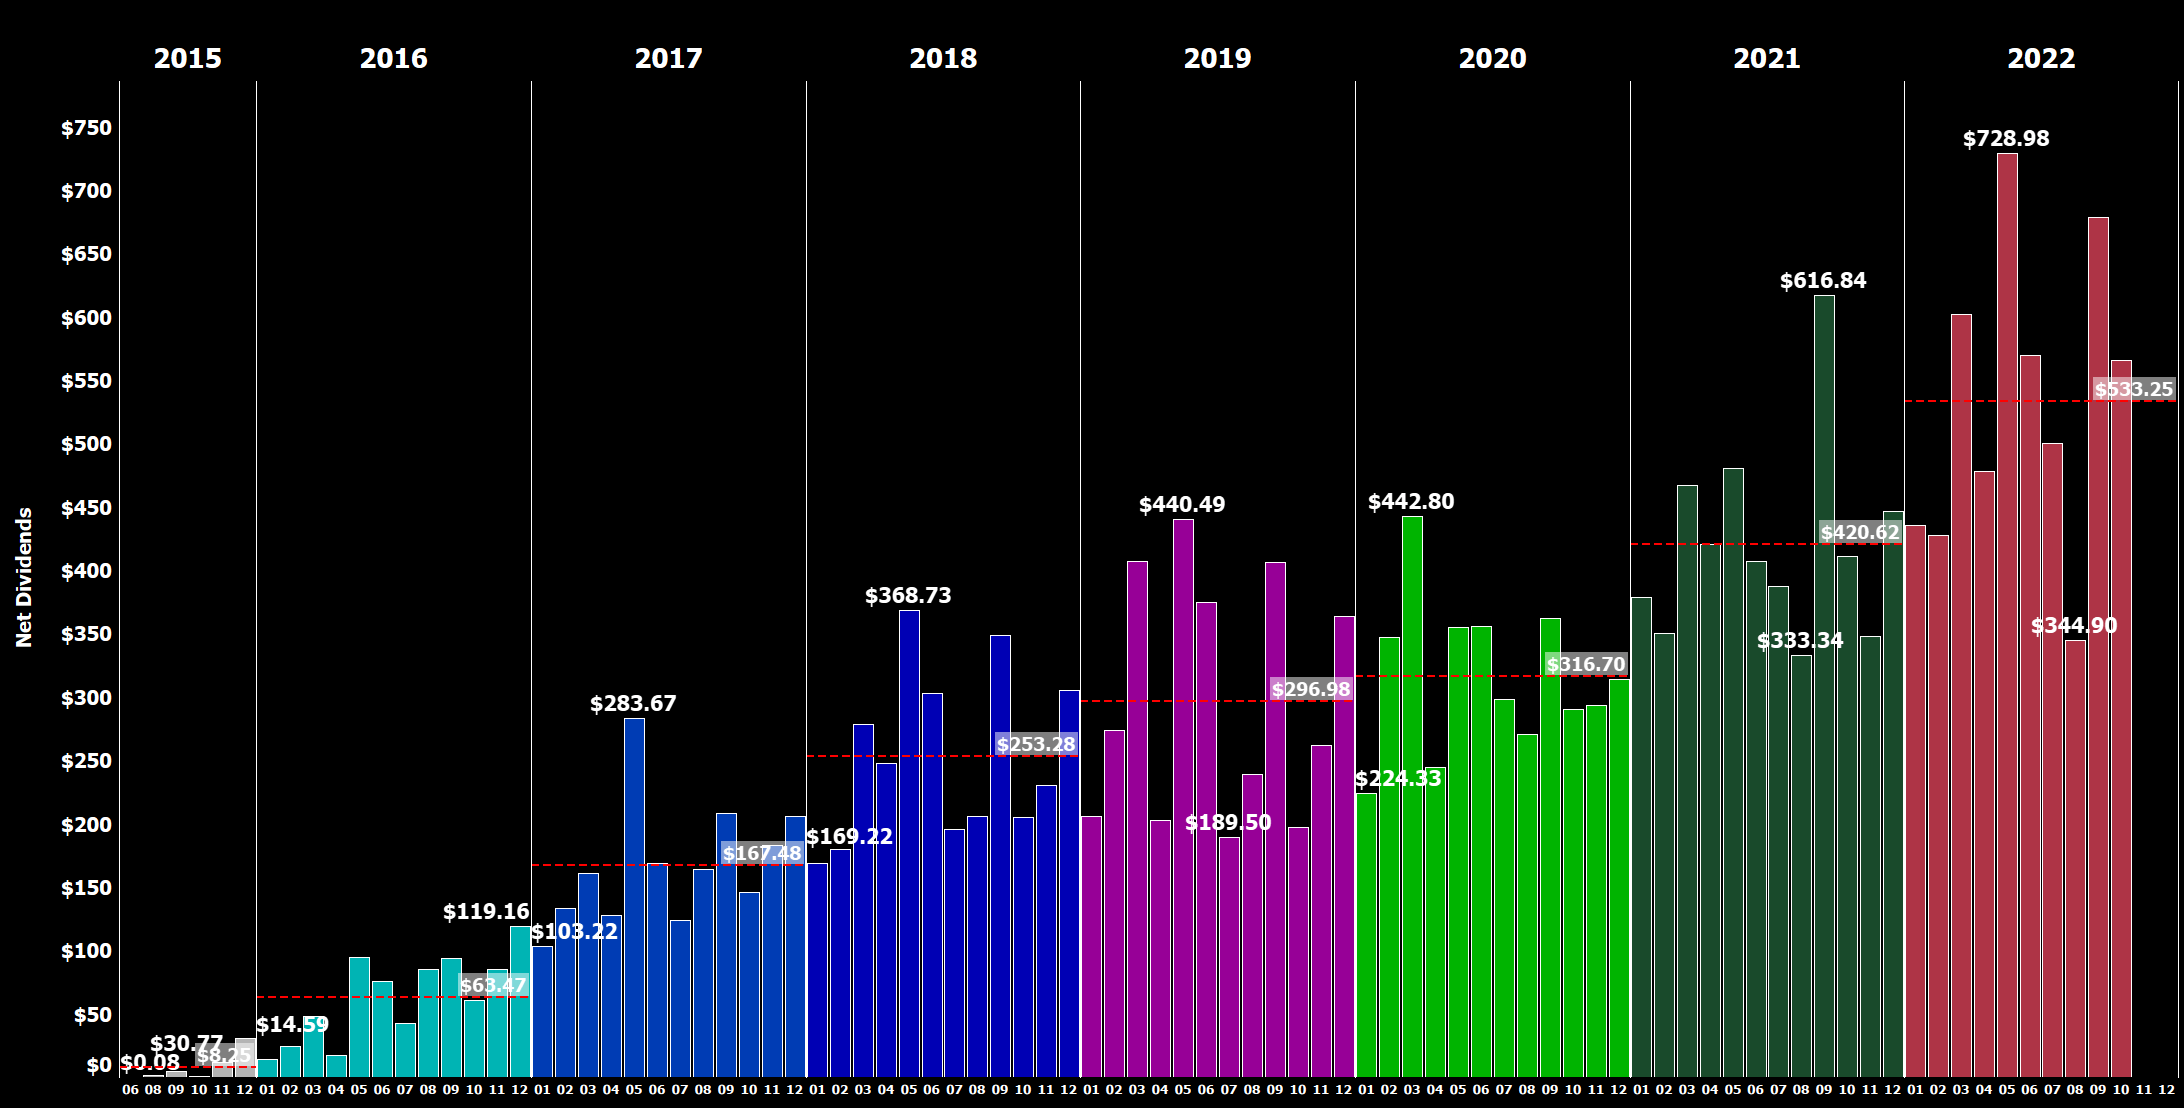
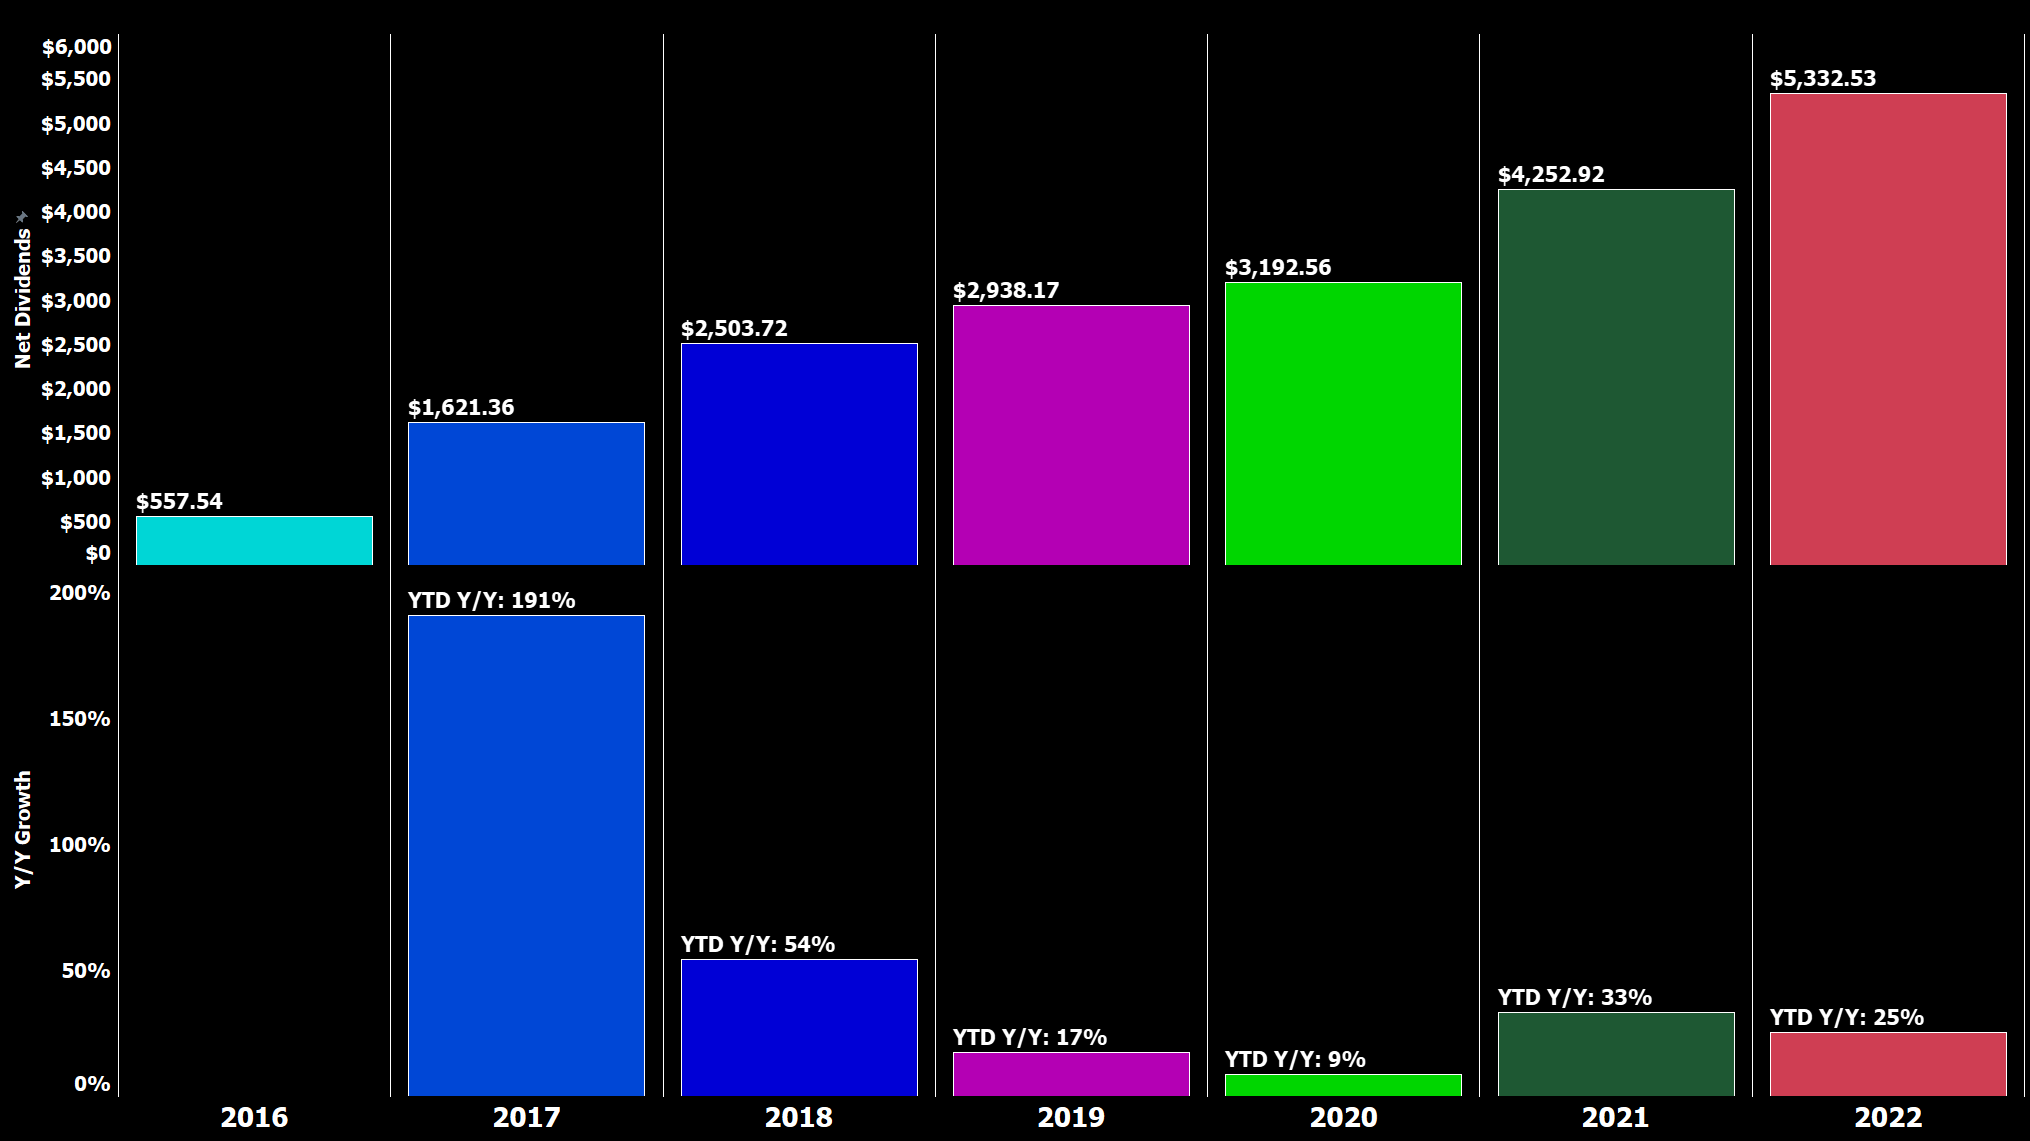
Here is a look at my favorite chart: the net dividend income development by month over time between 2015 and 2022, where you can easily see the development of my dividend income as well as the average annual dividend in a given year:
All-time Dividend Development (Designed by author)
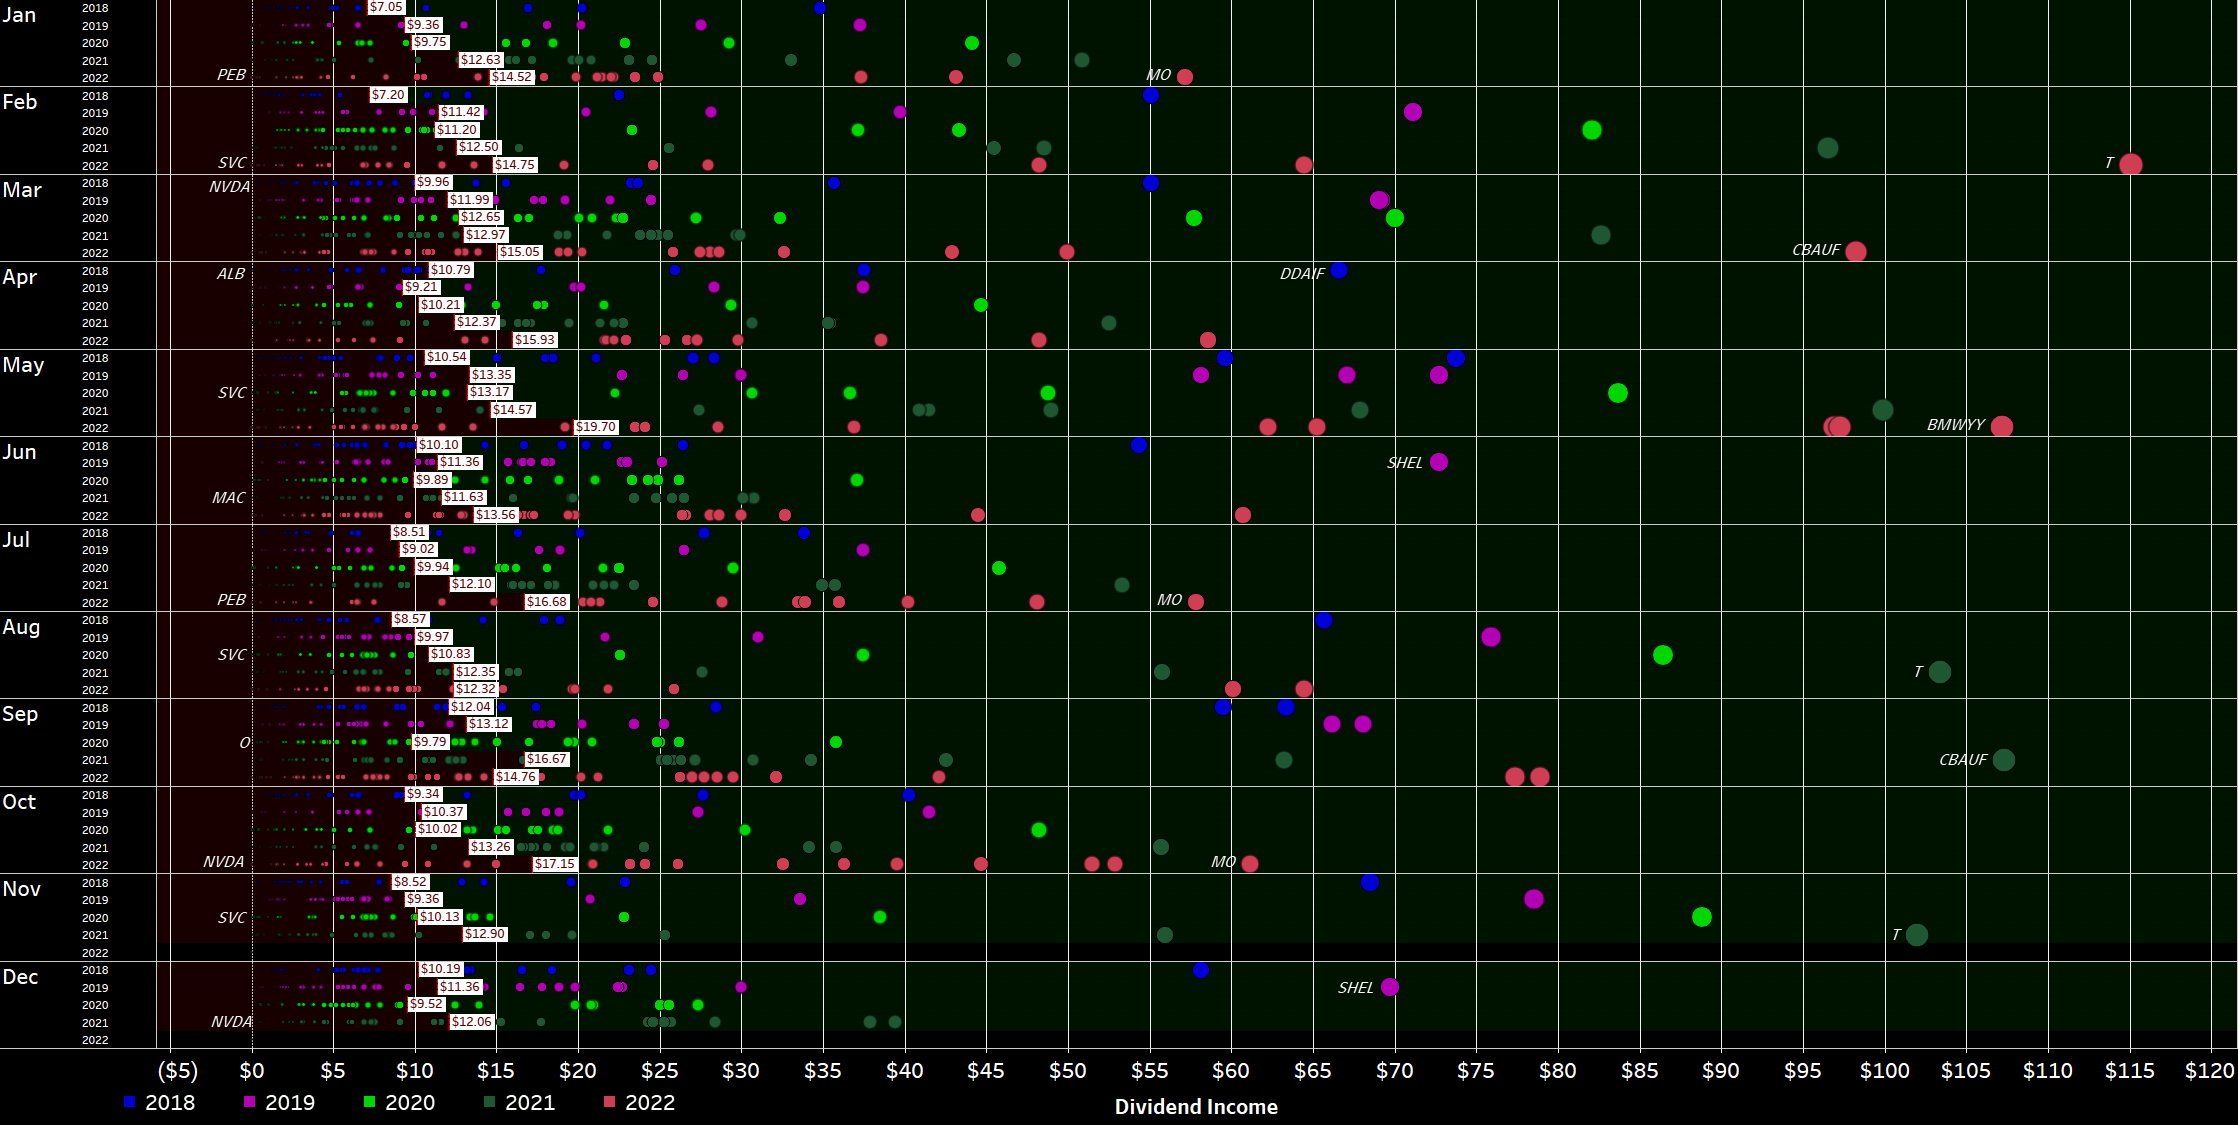
Next, I have scattered all the individual dividend payments I have ever received and colored them by year, rearranging the years side by side rather than horizontally as in previous updates:
Dividend Bubbles (Designed by author)
This view looks very cluttered at first, but it is very rich in information. It shows every single dividend payment I have received since I started my journey in 2015 in the shape of a circle colored differently by year and size, based upon their contribution. The view is broken down by month and by year (not by year and by month), and thus allows to better see the development over time. For every year of a certain month, a white rectangle indicates the average monthly dividend. The area where dividends fall below that average is filled dark red, whereas the area above is colored dark green. Personally, I absolutely love this redesigned view of my old "bubbles chart," as it is much clearer to identify developments and trends in my dividend income.
October 2022 Dividends (Designed by author)
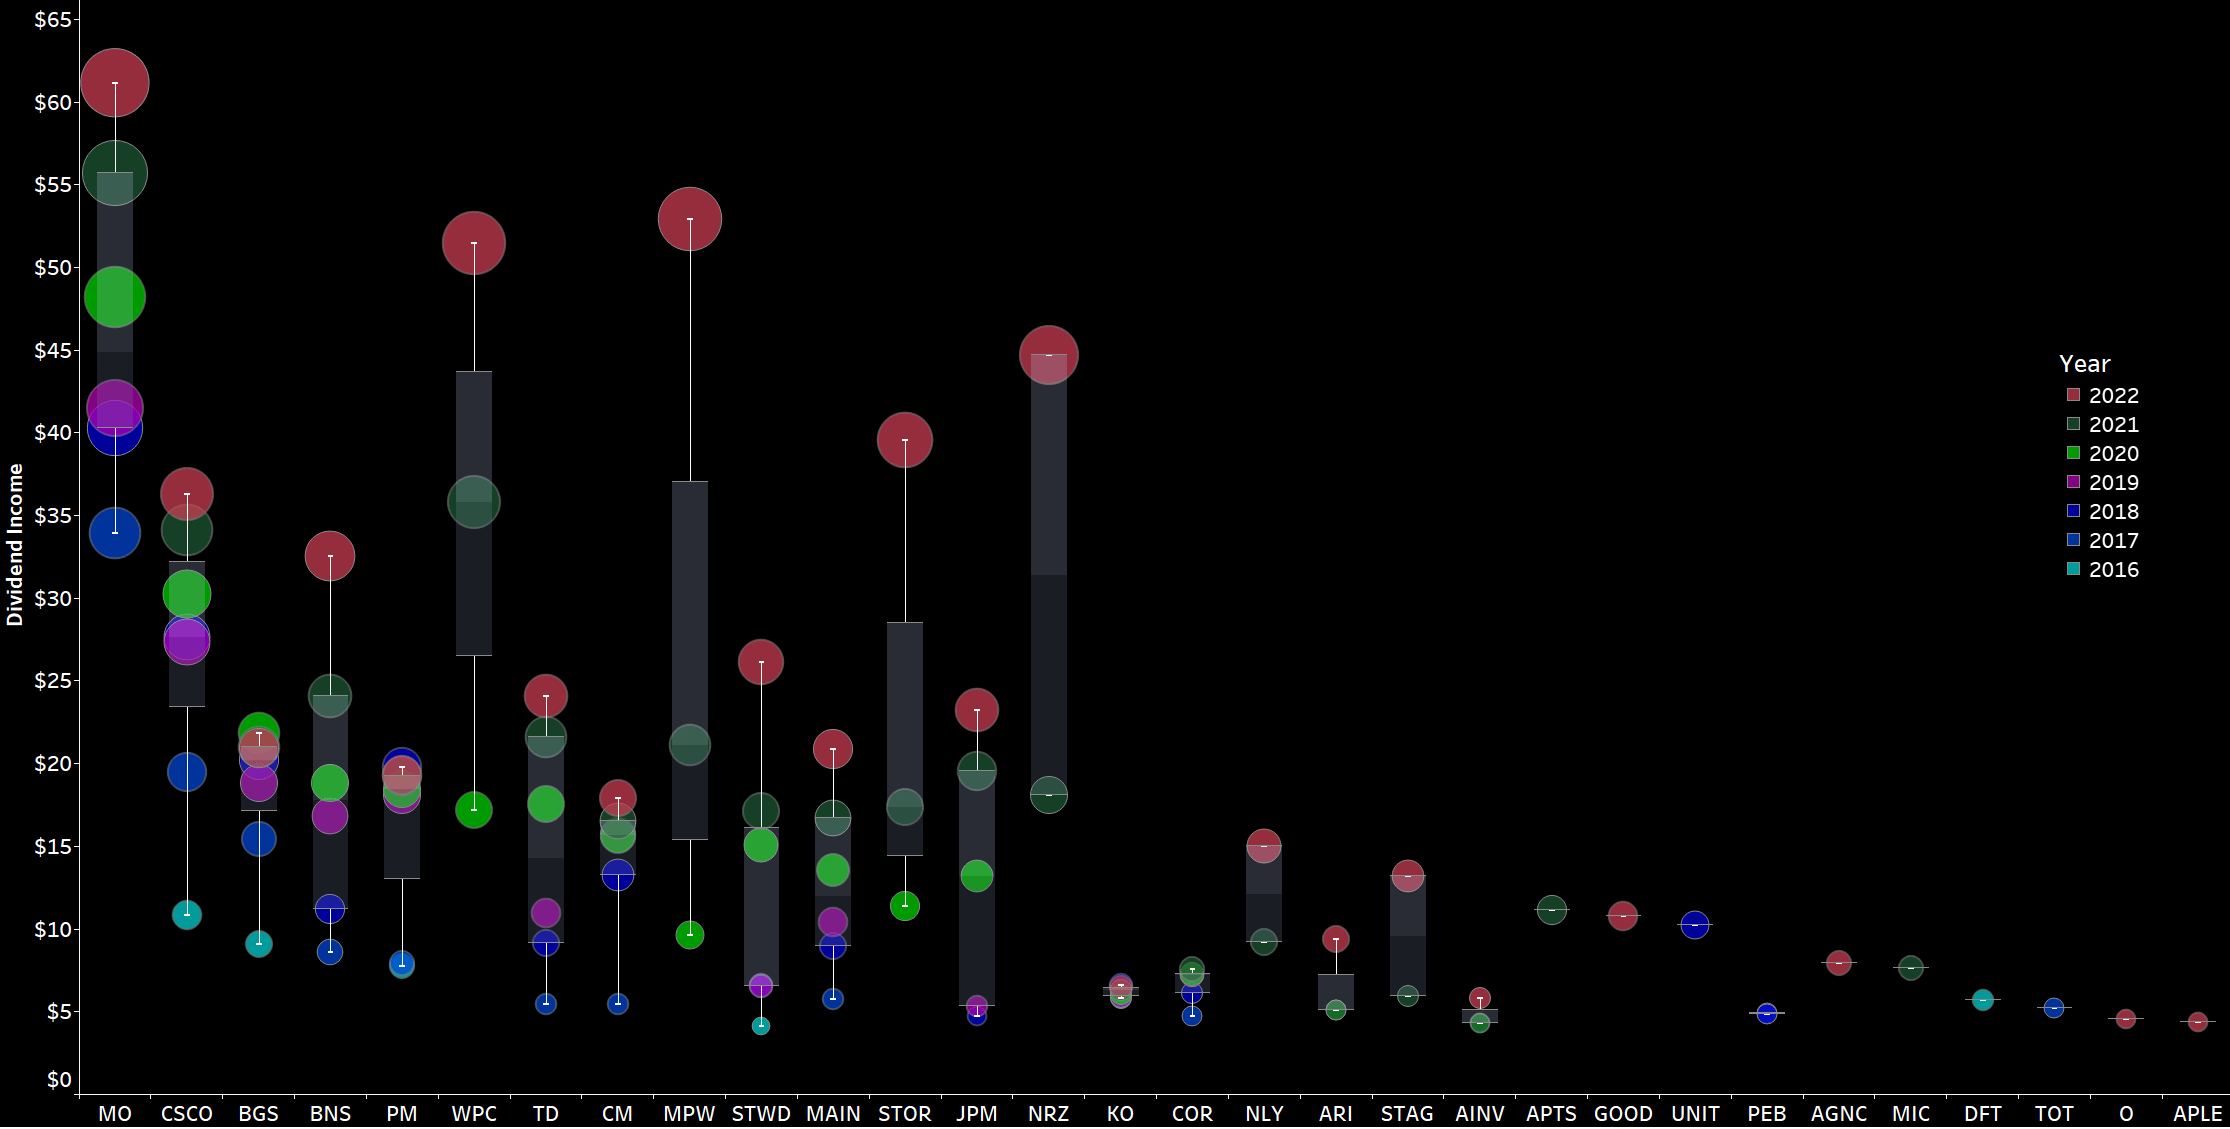
Now, zooming in on October , we can immediately see a number of big green circles in a sea of black. The bigger the circle and the bigger the distance to the previous circle for the same stock, the bigger is the change in dividend income compared to the prior years.
The biggest observations are the huge distances between the respective data points for 2022, 2021 and 2020 for WPC, RITM, MPW and STOR which is a testament to the very aggressive and consistent monthly purchasing of these stocks ever since the outbreak of the pandemic. All four of them are slowly getting towards (with the exception that STOR will be discontinued soon) that illustrious $100 net dividend milestone. Overall, what I like to see in that chart is obviously big red circles at the top of the scale for as many stocks as possible as that means rising dividend income.
Another way to express the monthly dividend income is in terms of Gifted Working Time (GWT).
I am assuming an average hourly rate of $30.8 for 2022 here:
- In 2018, I generated 121 hours in GWT, equaling slightly more than $3,000 in annual net dividends.
- In 2019, I generated 142 hours in GWT, equaling almost $3,600 in annual net dividends.
- In 2020, I generated 152 hours in GWT, equaling roughly $3,800 in annual net dividends.
- In 2021, I generated 180 hours in GWT, equaling roughly $5,050 in annual net dividends.
- In 2022, I am targeting to reach at least $5,500 in annual net dividends, which equals roughly 179 hours in GWT. Despite the projected increase in annual net dividends I expect overall GWT to decrease following higher calculated hourly rates, a figure I project to rise by 10% given soaring inflation. The annual target of $5,500 was on the very cautious side as I needed more visibility into how the year is progressing, particularly as I expect ongoing monthly investments to decline given elevated stock levels and rising inflationary and geopolitical pressures.
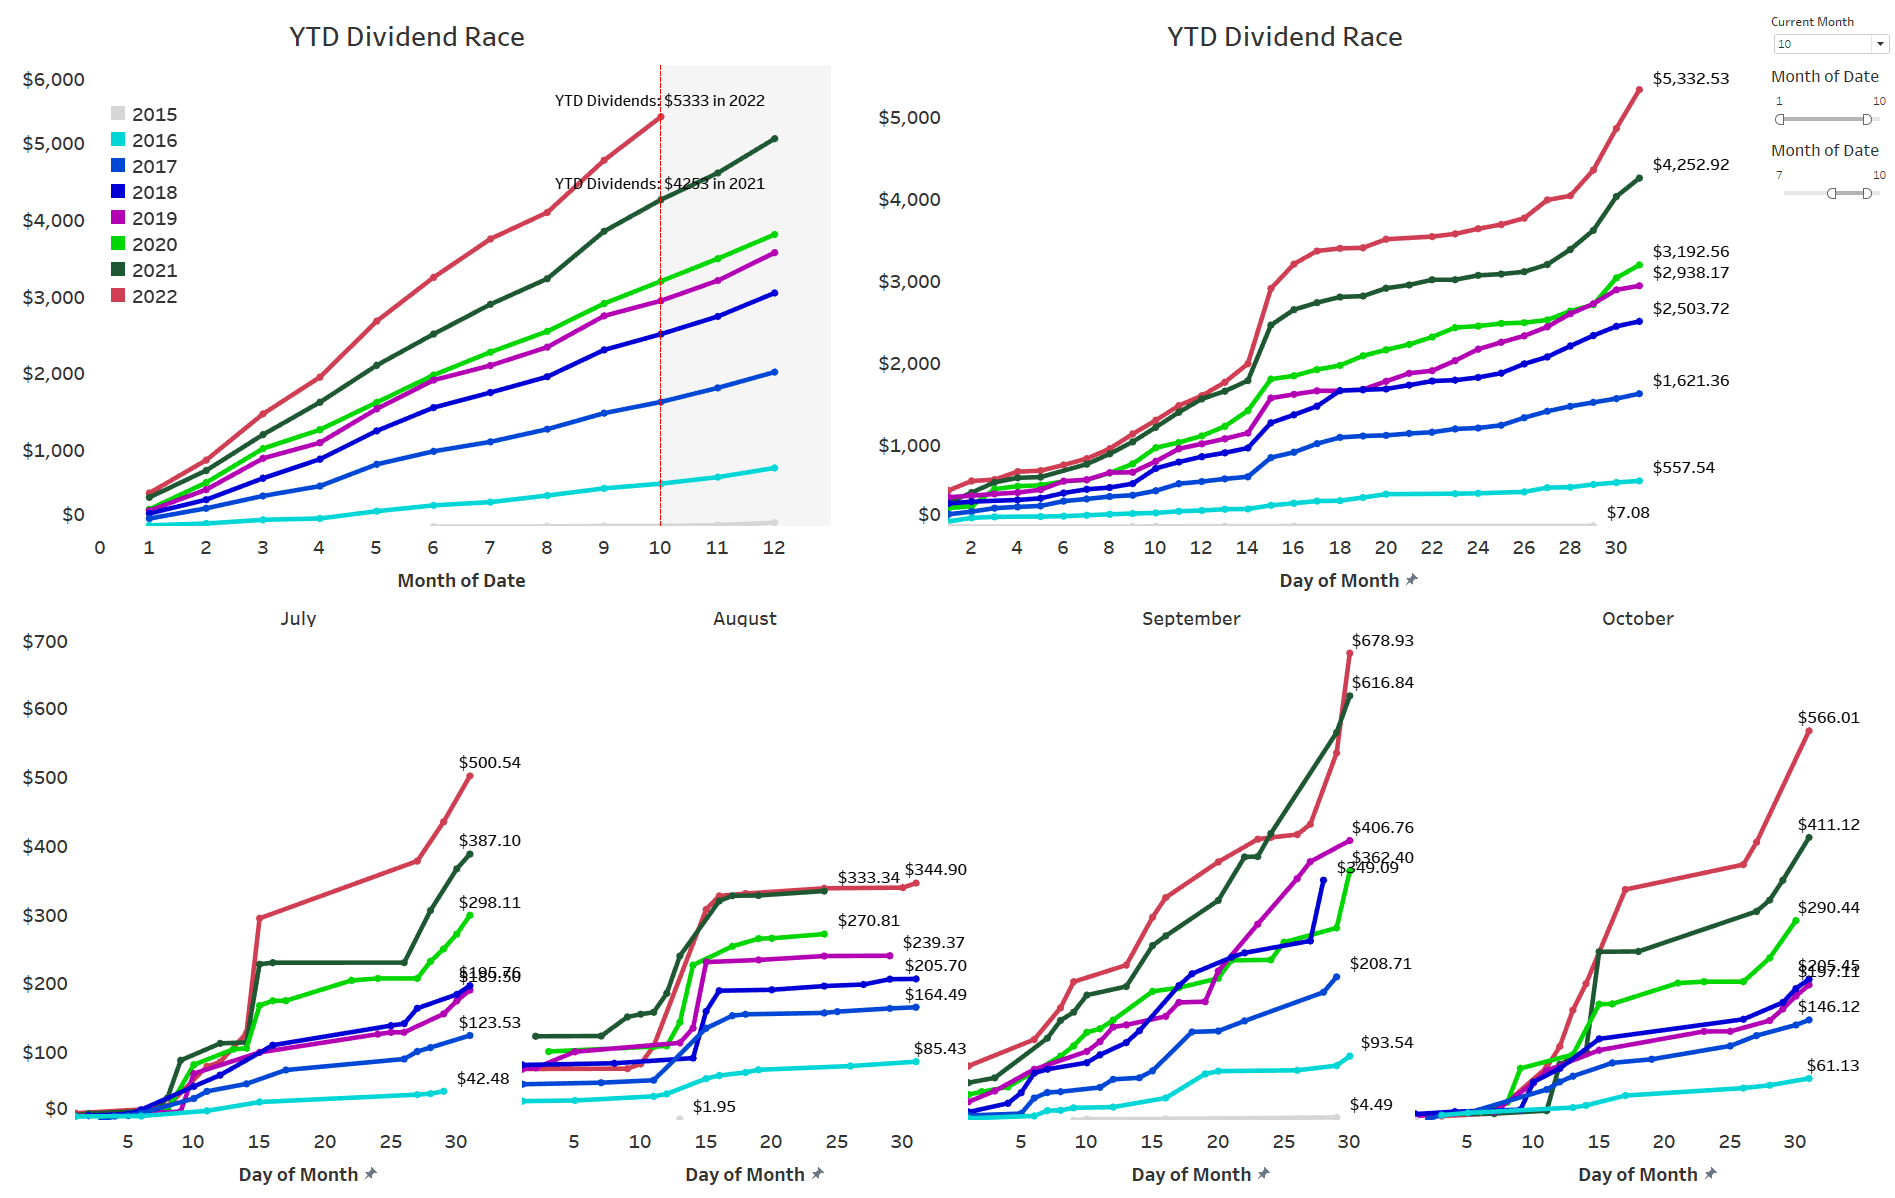
Across the years, the YTD Dividend Race as I like to call it, looks as follows:
- While 2020 was fairly disappointing, 2021 was phenomenal as it benefited from a rather low baseline from the prior year. For 2022, I am targeting a conservative high single-digit growth rate for now, which is a very cautious estimate to begin with.
- YTD growth based on the first 10 months is still shattering my expectations coming in at 25% Y/Y, and while I expect some moderation over the remaining two months, solid double-digit growth in annual dividend income is virtually guaranteed for this year.
- At this stage by the end of October I have come very close to my initial annual goal of $5,500 with YTD net dividends hitting around $5,300. With two more months to come I can safely expect to surpass my next milestone of $6,000. That would equate to at least $500 in net dividends per month which is a big number for me and more than enough to for instance pay all the utility bills which are soaring due to the war in Ukraine and its repercussions.
- For 2023 I can now cautiously expect to reach the next milestone which would be $7,000 in net dividends as that would require around 15% dividend income growth (I conservatively estimate to earn around $800 in net dividends over the next two months).
YTD Dividend Growth (Designed by author)
I have modified the YTD Dividend Race chart. Top left shows the YTD Dividend Race in the old format. At the top right, we can see how YTD dividend income developed on a daily basis and whereby we can easily identify that most of my dividend income is generated mid-month and towards the end of the month. At the bottom, that development is broken down by every individual month for the current year which makes big jumps clearly identifiable.
YTD Dividend Race (Designed by author)
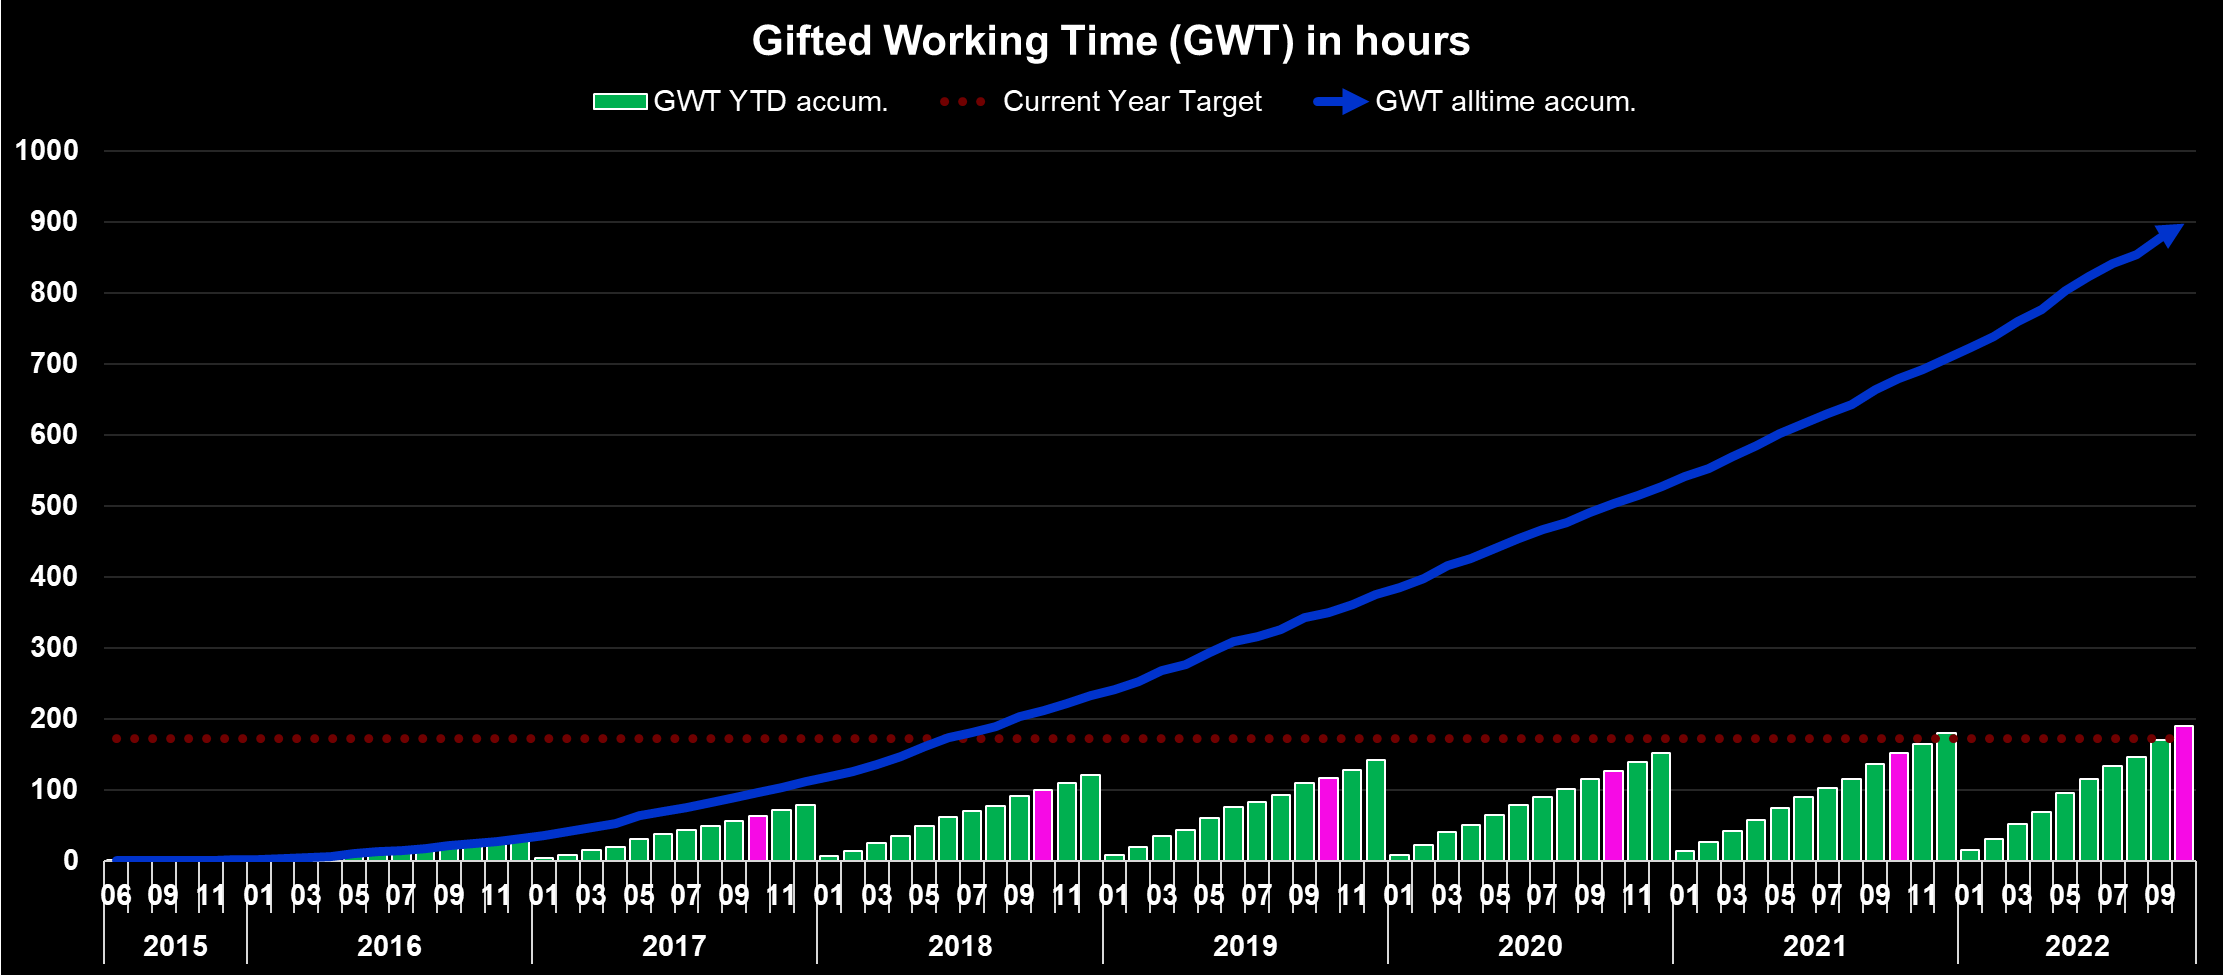
Expressed in GWT, it presents itself as follows:
Gifted Working Time in Hours (Designed by author)
What this shows is as follows:
- All time (blue area) - Around 898 hours, or 112.2 days, of active work have been replaced with passive income since the start of my dividend journey. Assuming a five-day workweek this translates into more almost 22 weeks of vacation funded via dividends.
- YTD (green bars) - Around 190 hours, or 23.8 days, of active work have been replaced with passive income in 2022 already, which equals more than 4 weeks' worth of active work funded via dividends.
- Highlighted in pink is the accumulated YTD total at the end of the current reporting month ( October ).
Upcoming November Dividends
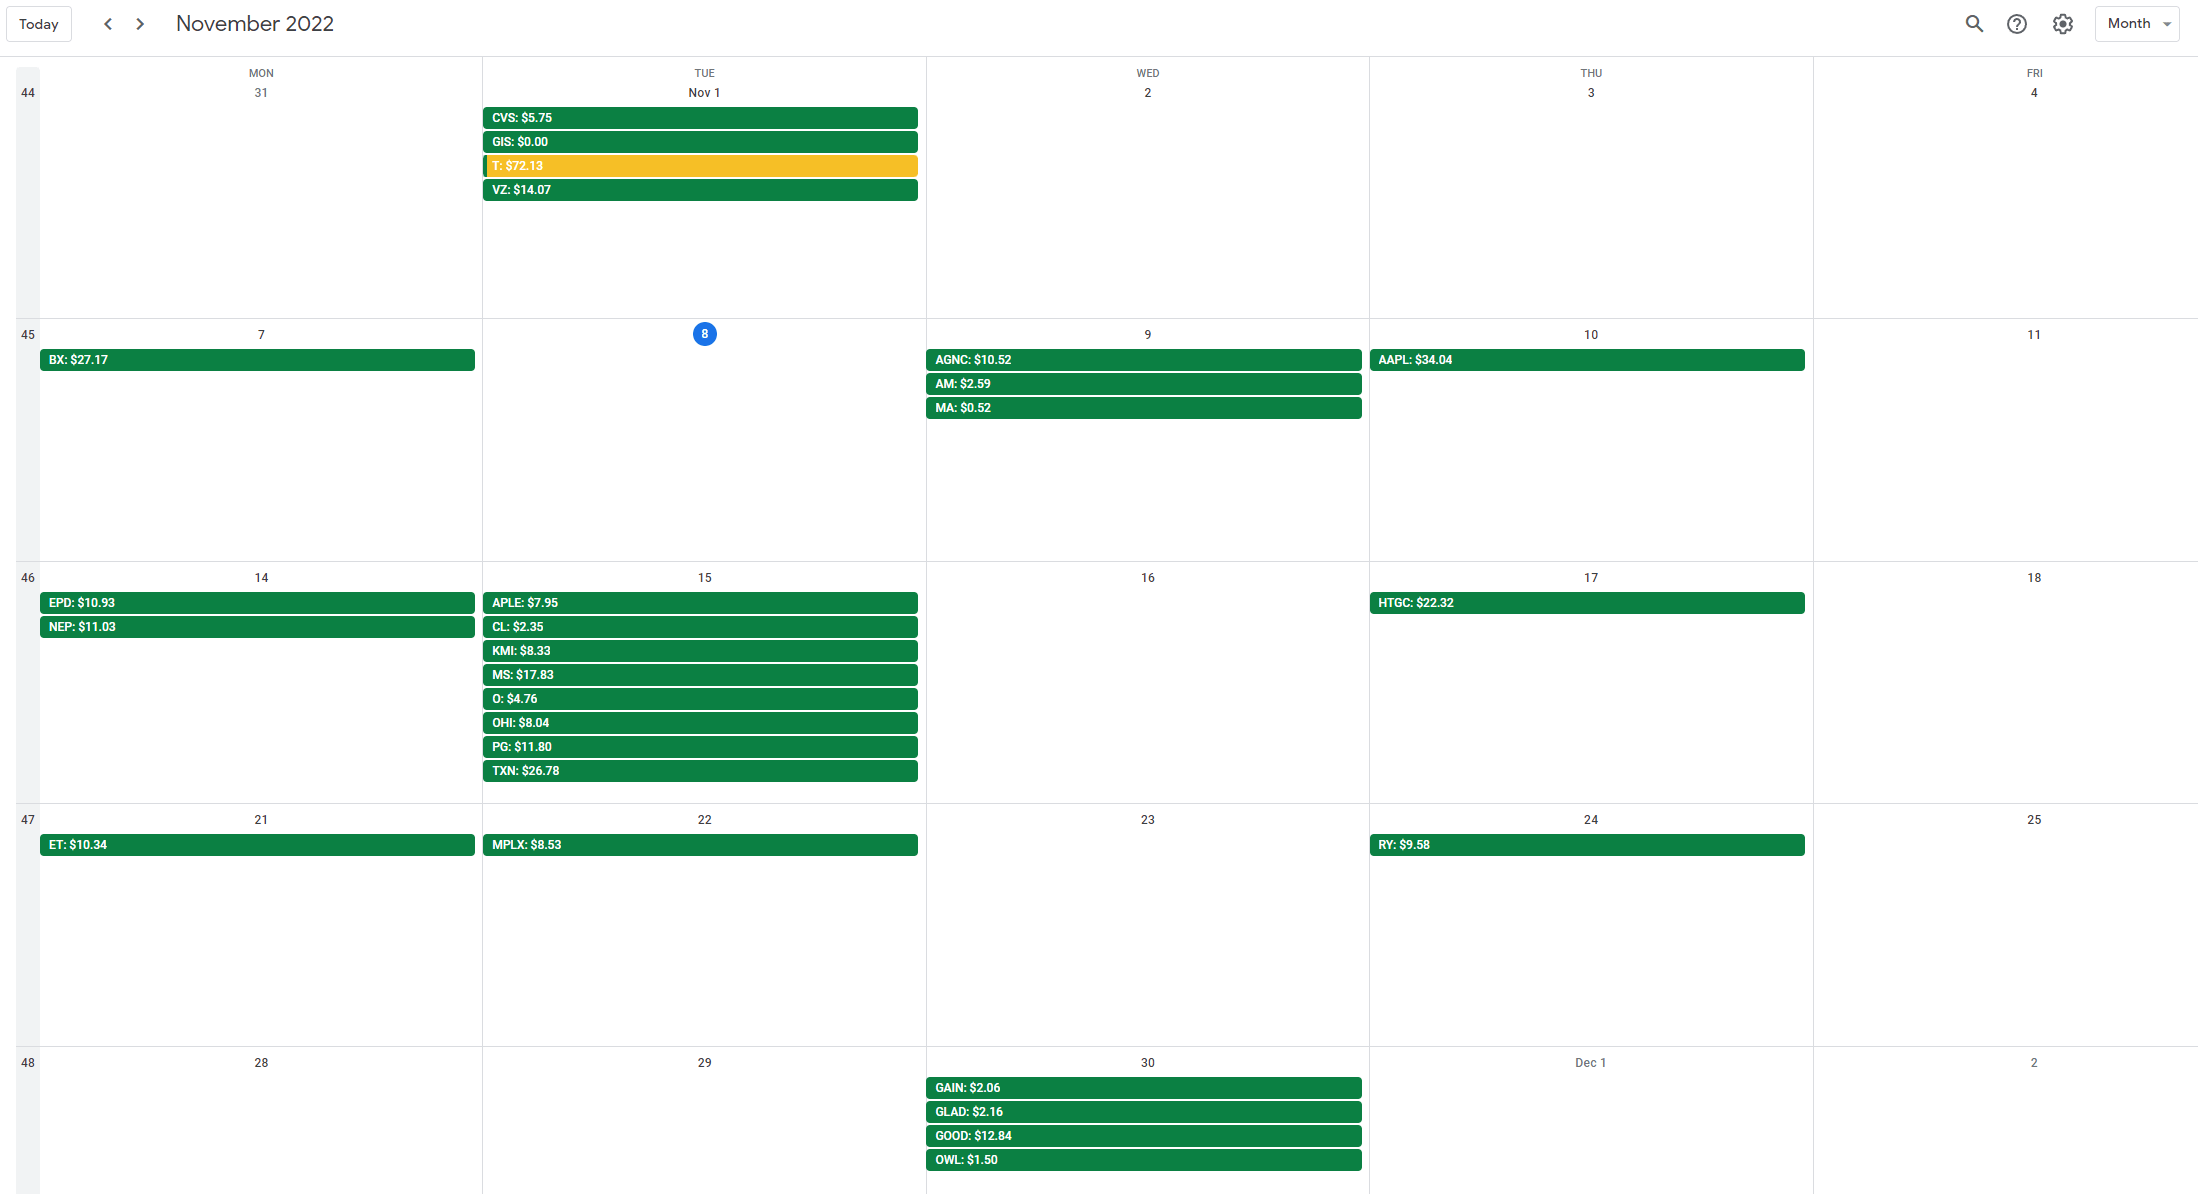
Contrary to October, November features significantly fewer dividend payers with payments overall concentrated in the first half of the month with only 1 meaningful dividend payment from the Royal Bank of Canada ( RY ) expected in the second half of November.
I still haven't really replaced that lost dividend income from AT&T yet but I am working on it and expect a much better November compared to the regular dividend payments received a quarter ago. Beyond that I intend to add to my energy holdings in ET, EPD and MPLX and newly added HASI and HTGC so that dividends in the Feb/May/Aug/Nov schedule will start growing again.
My Dividend Calendar (Designed by author)
The snapshot below is taken from my latest and free-for-all released Dividend Calendar (make sure to follow instructions in the video) and shows my expected dividend payments in November.
At the end of October, my dividend portfolio is composed as follows:
| Company Name |
| Ticker |
| % Market Value |
| Market Value (€) |
| Apple Inc. |
| ( AAPL ) |
| 11.68% |
| 21,298 |
| Visa Inc |
| ( V ) |
| 4.18% |
| 7,622 |
| AbbVie Inc |
| ( ABBV ) |
| 4.16% |
| 7,579 |
| McDonald's Corp |
| ( MCD ) |
| 3.63% |
| 6,625 |
| Microsoft Corporation |
| ( MSFT ) |
| 3.43% |
| 6,257 |
| Commonwealth Bank of Australia |
| ( CBAUF ) |
| 2.82% |
| 5,134 |
| Johnson & Johnson |
| ( JNJ ) |
| 2.79% |
| 5,095 |
| Cisco Systems, Inc. |
| ( CSCO ) |
| 2.74% |
| 4,993 |
| W. P. Carey |
| ( WPC ) |
| 2.40% |
| 4,373 |
| Shell |
| ( SHEL ) |
| 2.23% |
| 4,066 |
| AT&T Inc. |
| ( T ) |
| 2.19% |
| 3,996 |
| Ares Capital Corporation |
| ( ARCC ) |
| 2.11% |
| 3,844 |
| Main Street Capital Corporation |
| ( MAIN ) |
| 2.04% |
| 3,718 |
| Texas Instruments Incorporated |
| ( TXN ) |
| 1.94% |
| 3,539 |
| Stag Industrial Inc |
| ( STAG ) |
| 1.92% |
| 3,508 |
| Southern Co |
| ( SO ) |
| 1.84% |
| 3,362 |
| Altria Group Inc |
| ( MO ) |
| 1.82% |
| 3,316 |
| Wells Fargo & Co |
| ( WFC ) |
| 1.82% |
| 3,310 |
| Home Depot |
| ( HD ) |
| 1.78% |
| 3,239 |
| JPMorgan Chase & Co. |
| ( JPM ) |
| 1.74% |
| 3,165 |
| Toronto-Dominion Bank |
| ( TD ) |
| 1.69% |
| 3,073 |
| Gilead Sciences, Inc. |
| ( GILD ) |
| 1.63% |
| 2,976 |
| Bank of Nova Scotia |
| ( BNS ) |
| 1.50% |
| 2,728 |
| Medical Properties Trust |
| ( MPW ) |
| 1.44% |
| 2,634 |
| Allianz SE |
| ( ALIZF ) |
| 1.30% |
| 2,370 |
| Siemens Healthineers |
| ( SEMHF ) |
| 1.23% |
| 2,250 |
| NVIDIA Corporation |
| ( NVDA ) |
| 1.14% |
| 2,073 |
| Blackstone Group LP |
| ( BX ) |
| 1.07% |
| 1,949 |
| PepsiCo, Inc. |
| ( PEP ) |
| 1.06% |
| 1,938 |
| Morgan Stanley |
| ( MS ) |
| 1.02% |
| 1,860 |
| Broadcom Inc |
| ( AVGO ) |
| 0.91% |
| 1,655 |
| Procter & Gamble Co |
| ( PG ) |
| 0.91% |
| 1,650 |
| BMW |
| ( BMWYY ) |
| 0.90% |
| 1,633 |
| BP1 |
| ( BP ) |
| 0.86% |
| 1,573 |
| Enbridge |
| ( ENB ) |
| 0.85% |
| 1,557 |
| Intel Corporation |
| ( INTC ) |
| 0.84% |
| 1,534 |
| BP2 |
| ( BP ) |
| 0.84% |
| 1,533 |
| Philip Morris International Inc. |
| ( PM ) |
| 0.83% |
| 1,514 |
| Store Capital |
| ( STOR ) |
| 0.78% |
| 1,428 |
| Gladstone Commercial Corporation |
| ( GOOD ) |
| 0.78% |
| 1,426 |
| Bank of America Corp |
| ( BAC ) |
| 0.78% |
| 1,414 |
| Brookfield Renewable Partners |
| ( BEP ) |
| 0.78% |
| 1,413 |
| Honeywell International Inc. |
| ( HON ) |
| 0.77% |
| 1,411 |
| Starwood Property Trust, Inc. |
| ( STWD ) |
| 0.73% |
| 1,339 |
| Target Corporation |
| ( TGT ) |
| 0.68% |
| 1,247 |
| Daimler |
| (DDAIF) |
| 0.65% |
| 1,180 |
| Annaly Capital Management |
| ( NLY ) |
| 0.63% |
| 1,152 |
| Realty Income Corp |
| ( O ) |
| 0.63% |
| 1,143 |
| The Coca-Cola Co |
| ( KO ) |
| 0.61% |
| 1,109 |
| 3M Co |
| ( MMM ) |
| 0.61% |
| 1,105 |
| NextEra Energy Partners LP |
| ( NEP ) |
| 0.57% |
| 1,040 |
| Dominion Energy Inc |
| ( D ) |
| 0.54% |
| 993 |
| Unilever NV ADR |
| ( UL ) |
| 0.54% |
| 981 |
| CVS Health Corp |
| ( CVS ) |
| 0.52% |
| 942 |
| Royal Bank of Canada |
| ( RY ) |
| 0.50% |
| 905 |
| Apple Hospitality REIT |
| ( APLE ) |
| 0.50% |
| 903 |
| Stryker |
| ( SYK ) |
| 0.47% |
| 863 |
| Verizon Communications Inc. |
| ( VZ ) |
| 0.45% |
| 820 |
| B&G Foods, Inc. |
| ( BGS ) |
| 0.41% |
| 748 |
| Canadian Imperial Bank of Commerce |
| ( CM ) |
| 0.38% |
| 699 |
| Medtronic |
| ( MDT ) |
| 0.38% |
| 697 |
| Nextera Energy |
| ( NEE ) |
| 0.37% |
| 672 |
| Sino AG |
| (XTP.F) |
| 0.34% |
| 616 |
| Exxon Mobil Corporation |
| ( XOM ) |
| 0.34% |
| 615 |
| Pfizer Inc. |
| ( PFE ) |
| 0.33% |
| 605 |
| Walgreens Boots Alliance Inc |
| ( WBA ) |
| 0.32% |
| 588 |
| BASF |
| ( BASFY ) |
| 0.31% |
| 571 |
| Antero Midstream Corporation |
| ( AM ) |
| 0.30% |
| 556 |
| Spirit Realty Corporation |
| ( SRC ) |
| 0.30% |
| 548 |
| AGNC Investment Corporation |
| ( AGNC ) |
| 0.30% |
| 544 |
| Kinder Morgan Inc |
| ( KMI ) |
| 0.29% |
| 531 |
| Enterprise Products Partners L.P. |
| ( EPD ) |
| 0.27% |
| 486 |
| ZIM Integrated Shipping Services |
| ( ZIM ) |
| 0.26% |
| 469 |
| General Electric Company |
| ( GE ) |
| 0.25% |
| 463 |
| Alibaba Group Holding Ltd |
| ( BABA ) |
| 0.23% |
| 415 |
| Apollo Commercial Real Est. Finance Inc |
| ( ARI ) |
| 0.22% |
| 401 |
| Energy Transfer Partners |
| ( ET ) |
| 0.20% |
| 366 |
| Omega Healthcare Investors Inc |
| ( OHI ) |
| 0.20% |
| 363 |
| Colgate-Palmolive Company |
| ( CL ) |
| 0.19% |
| 355 |
| MPLX LP |
| ( MPLX ) |
| 0.19% |
| 354 |
| Sixt |
| ( SXTSY ) |
| 0.19% |
| 348 |
| BRT Realty Trust |
| ( BRT ) |
| 0.18% |
| 335 |
| Mastercard |
| ( MA ) |
| 0.17% |
| 319 |
| Bayer AG |
| ( BAYZF ) |
| 0.16% |
| 285 |
| Vonovia |
| ( VONOY ) |
| 0.13% |
| 237 |
| Brookfield Infrastructure Partners L.P. |
| ( BIP ) |
| 0.12% |
| 213 |
| Apollo Investment |
| ( MFIC ) |
| 0.11% |
| 205 |
| Hercules Capital |
| ( HTGC ) |
| 0.11% |
| 204 |
| Blue Owl Capital |
| ( OWL ) |
| 0.08% |
| 141 |
| Uniti Group Inc |
| ( UNIT ) |
| 0.08% |
| 138 |
| Fresenius SE |
| ( FSNUF ) |
| 0.07% |
| 121 |
| Equitrans Midstream Corporation |
| ( ETRN ) |
| 0.06% |
| 115 |
| Lumen Technologies |
| ( LUMN ) |
| 0.06% |
| 104 |
| Walt Disney Co |
| ( DIS ) |
| 0.05% |
| 100 |
| Boeing |
| ( BA ) |
| 0.05% |
| 98 |
| Bank of Montreal |
| ( BMO ) |
| 0.05% |
| 88 |
| Newtek Business Services |
| ( NEWT ) |
| 0.05% |
| 83 |
| The GEO Group Inc |
| ( GEO ) |
| 0.03% |
| 60 |
| Fresenius Medical Care |
| ( FMS ) |
| 0.03% |
| 56 |
| Diversified Healthcare Trust |
| ( DHC ) |
| 0.02% |
| 40 |
| Service Properties Trust |
| ( SVC ) |
| 0.02% |
| 28 |
For further details see:
My Dividend Stock Portfolio: New October Record - 103 Holdings With 27 Buys