LLDTF - NatWest: Down After FY22 Results 10x P/E And 5% Dividend Yield
Summary
- NatWest Group plc shares are down 6.6% in London this morning after results, and currently have a P/E of 8.4x and a dividend yield of 4.7%.
- The stock is at 1.08x Tangible Book Value when NatWest expects 14-16% Return on Equity both in 2023 and the medium term.
- Net Interest Income is likely to be resilient, thanks to NatWest’s cheap deposits; Cost/Income Ratio should continue to improve.
- At 285.4p, we expect shares to deliver a 10%+ annualized return by 2025 year-end, even on undemanding assumptions. Buy.
- Potential credit losses in the event of a U.K. downturn represent the main risk. Returns can be much higher with benign macro.
Introduction
NatWest Group plc (NWG) released their full-year 2022 results before markets opened this morning (Friday, 17 February). NWG shares fell sharply on opening and are down 6.6% in London as of 12:35 local time.
At 285.4p, NatWest shares are currently up 10% in the past year, having rallied strongly from October 2022 lows:
| NatWest Share Price (Last 1 Year) Source: Google Finance (17-Feb-23). |
(Lloyds Banking Group PLC ( LYG ), already Buy-rated in our coverage, also saw shares fall 3% in London this morning.)
NatWest stock is attractive on undemanding expectations. Shares are currently at 1.08x Tangible Book Value, implying a P/E of less than 10x even if Return on Tangible Equity falls short of management's 14-16% medium-term targets. The dividend yield is nearly 5%, supplemented by buybacks. Net Interest Income is likely to be resilient thanks to NatWest's cheap deposits, and much of Non-Interest Revenues are in recurring business lines. Cost control is strong and Cost/Income Ratio is expected to improve again in 2023. Potential credit losses in the event of a U.K. downturn represent the main risk, though investors are also worried about Net Interest Margin having peaked. Growing dividends, moderate earnings growth and a small re-rating up to 10x should deliver a 10%+ annualized return. Buy.
NatWest Company Overview
NatWest, formerly the Royal Bank of Scotland (or RBS) is one of the Big 4 U.K. banks in the U.K., primarily focused serving U.K. consumers and businesses, with some exposure to Europe and the rest of the world through corporates.
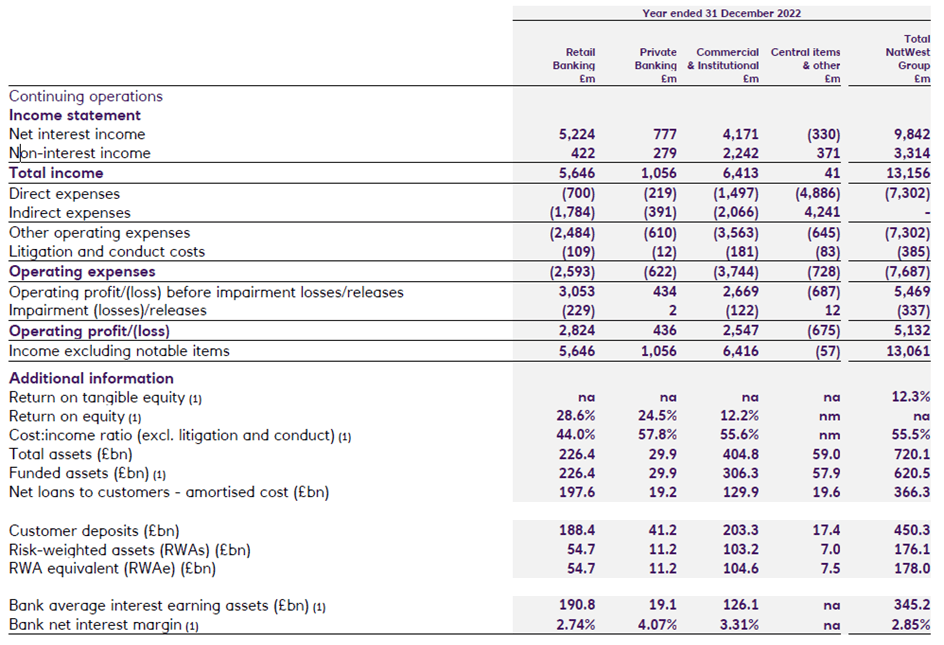
NatWest reports in three segments, with Retail Banking generating around 50% of its Operating Profit in 2022, Commercial & Institutional ("C&I") generating around 45%, and Private Banking generating around 5%; a former fourth segment, Ulster Bank RoI (Republic of Ireland) is currently in run-off mode.
C&I has assets and Risk Weighted Assets that are 90% larger than Retail Banking's, as well as a higher Net Interest Margin ("NIM"), but generates a Return on Tangible Equity ("ROTE") that is less than half of Retail Banking's. This is likely due to C&I loans carrying much higher risk weights than retail mortgages and having a Cost/Income ratio that is more than 10 ppt worse than Retail Banking's.
NatWest is a relatively lending-centric bank, with nearly 75% of its Total Income coming from Net Interest Income ("NII") in 2022. Lending fees on credit facilities accounted for another 5% of Total Income.
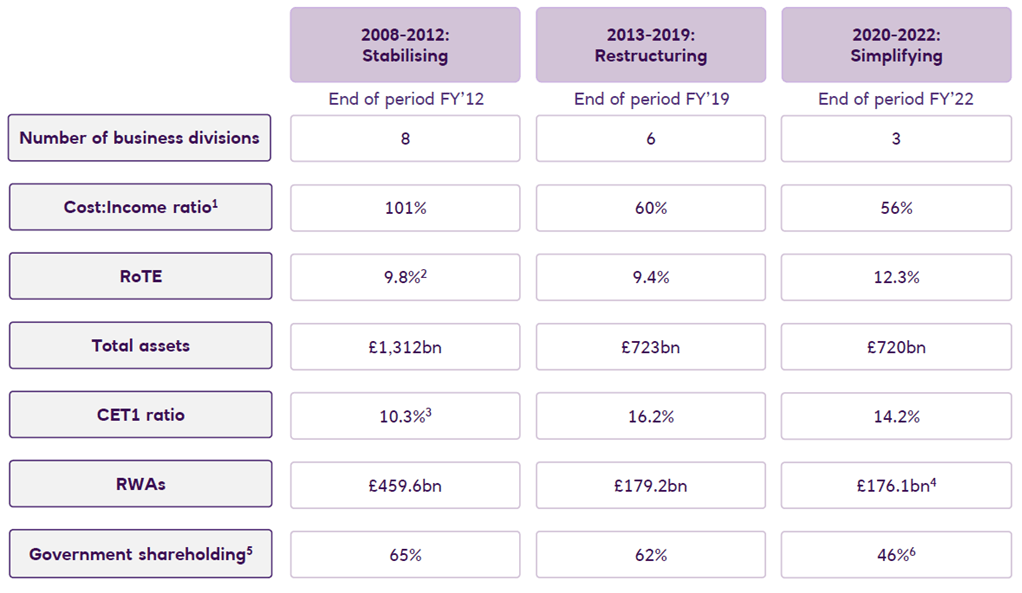
NatWest had to be rescued by the U.K. government during the Global Financial Crisis and has undertaken extensive restructuring in the subsequent years. Total assets have been reduced by close to half (from £1,312bn to £720bn) between 2012 and 2022 year-ends, and the Cost/Income ratio has improved from 101% to 56%.
The U.K. government still owns 44% of NatWest's equity, but has been progressing reducing its holding, most recently selling another 1% on February 2. We expect them to fully exit their position in due course.
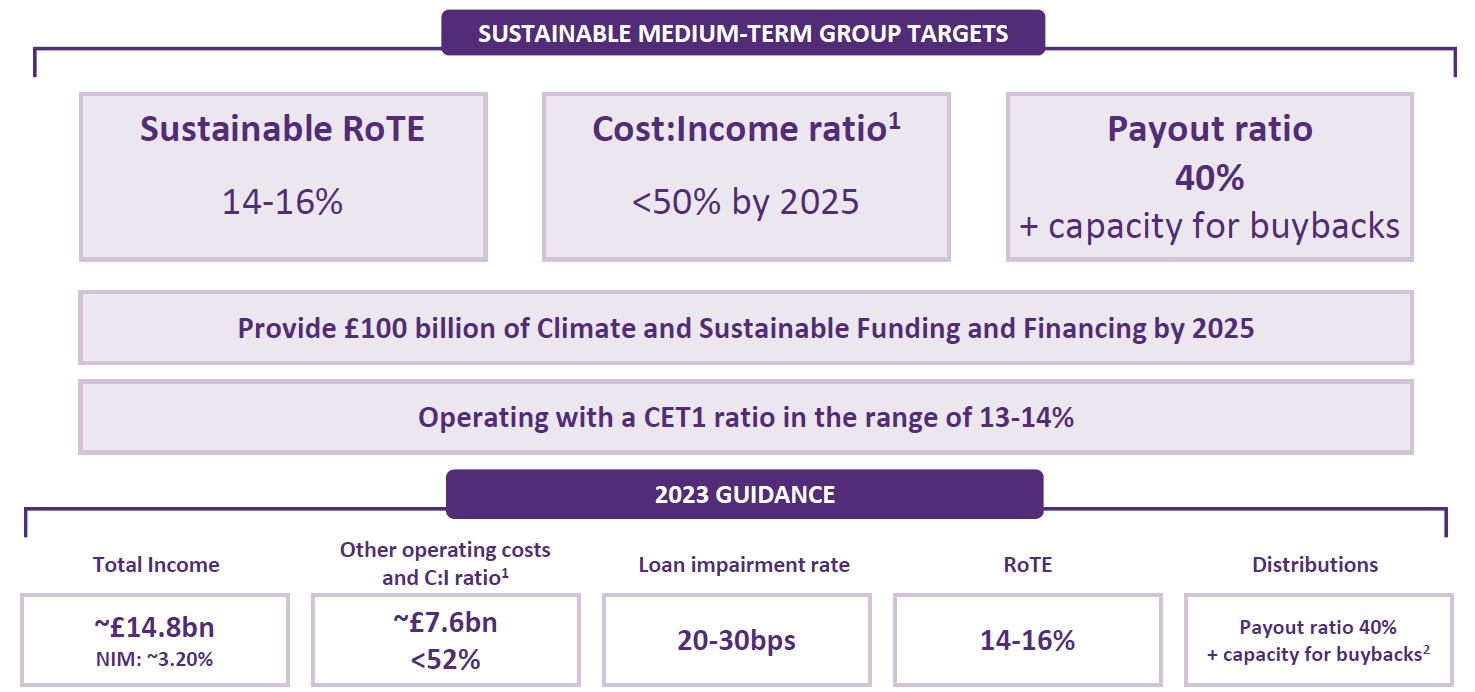
NatWest targets a 14-16% ROTE for the medium-term, and guides to the same for 2023:
NatWest is actively returning capital to shareholders, targeting a payout ratio of 40% for dividends and aiming to repurchase its own shares when there is capacity. It returned £3.8bn in 2021 and £5.1bn in 2022, including through special dividends, compared to a current market capitalization of £27.6bn, though this was helped by NatWest's Common Equity Tier 1 ("CET1") ratio having started 2021 at 18.5%, significantly in excess of the 13-14% target.
CET1 was 14.2% at 2022 year-end, still above the target range, which means NatWest is likely to continue to return a substantial part of its earnings (with some earnings retained for growth).
2022 results were strong, helped by interest rate increases, good cost control, and low credit costs.
NatWest 2022 Results Headlines
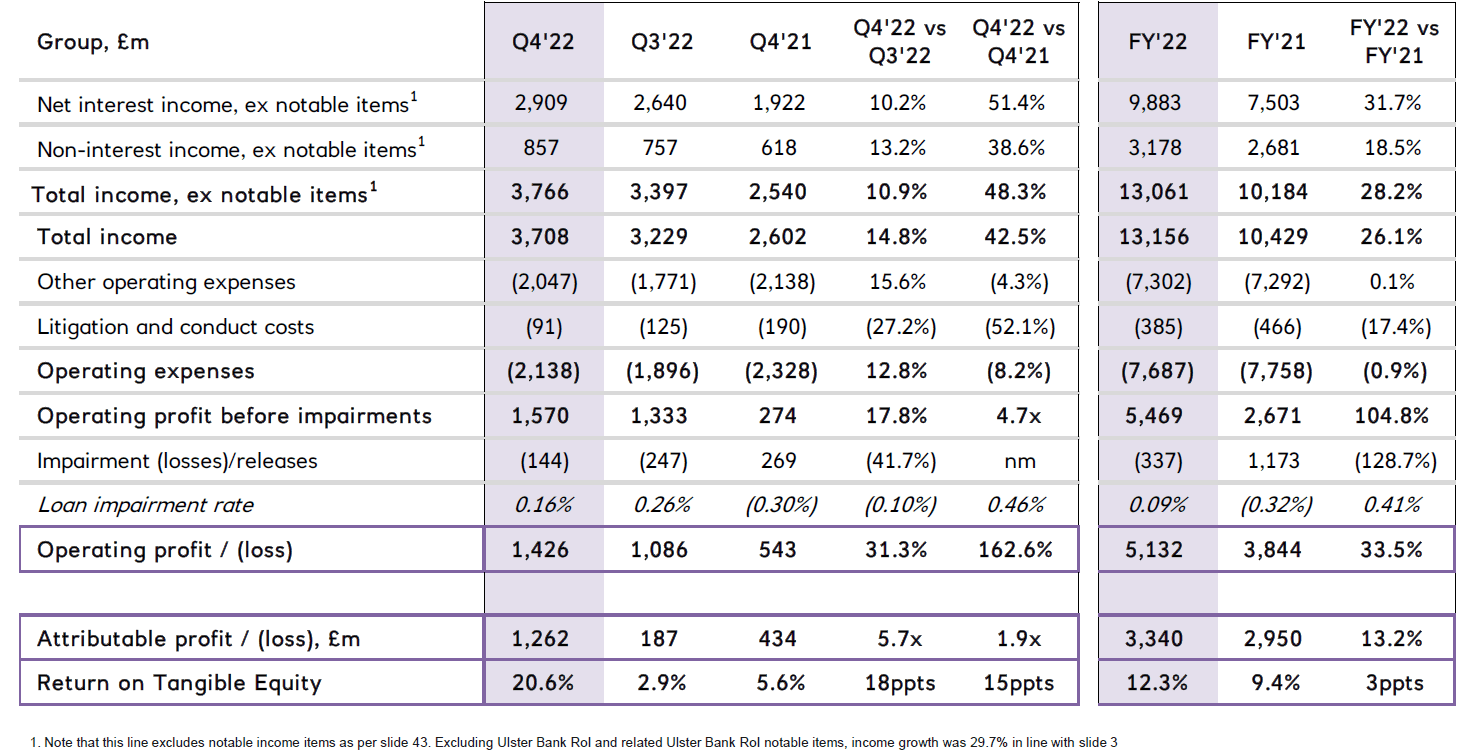
In 2022, NatWest achieved a ROTE of 12.3%, 3 ppt higher year-on-year, including a ROTE of 20.6% in Q4.
| NatWest Results Headlines (Q4 & FY 2022 vs. Prior Periods) Source: NatWest results presentation (Q4 2022). |
Operating Profit grew 33.5% in 2022, helped by NII rising 31.7% (thanks to interest rate increases), Non-Interest Income rising 18.5%, Total Operating Expenses falling 0.9% year-on-year, and Impairment Losses being just £337m.
The same dynamics have continued in Q4. NII grew by 10.2% sequentially, Total Operating Expenses were down 8.2% year-on-year, and Impairment Losses were a limited £144m. Operating Profit more than doubled year-on-year.
Management continues to expect ROTE to be 14-16% in 2023.
We believe NatWest's long-term ROTE is unlikely to fall much below the 12.3% achieved in 2022, even if it does not it management's 14-16% target (for both 2023 and the medium term), based on structural drivers in its businesses.
Net Interest Income Backed by Cheap Deposits
NatWest is likely to continue to see strong NII, backed by its cheap deposits and some loan growth.
NatWest's NIM evolution during Q4 2022 showed the power of its cheap deposits. While NIM saw slight dilutions from each of Mortgages, Unsecured (personal loans) and C&I Loans, it saw gains in both Personal and C&I deposits:
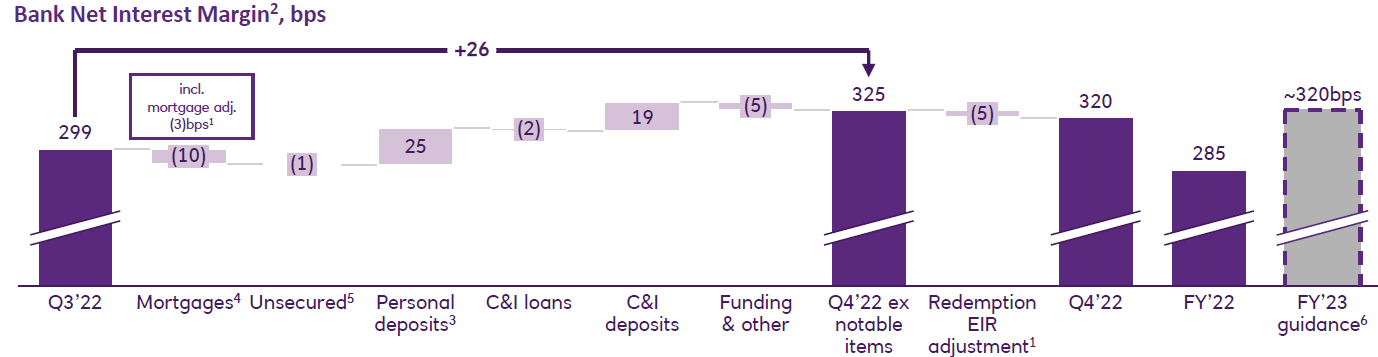
Full-year 2022 NIM of 285 bps was a significant expansion from the 230 bps figure in 2021. 2023 NIM guidance of 320 bps represents another increase year-on-year, though a small decline from Q4 2022's 320 bps. The decline is due to expectations that more of recent rate increases will have to be passed on to customers, from 35% so far to an expected 50%, and is a natural phenomenon in every rates cycle and also included in guidance given by U.S. banks
In the event of a U.K. recession, interest rates will fall again. Market expectations are for U.K. interest rates to start falling in 2024. However, NatWest's cheap deposit base should help offset much of these headwinds.
NatWest's cheap deposit base is the result of the mission-critical nature of its products and longstanding relationships with customers, with many choosing to maintain balances in low- or zero-rate accounts for operational reasons or out of brand loyalty. Management has a stated strategy to not compete aggressively for deposits on price.
Higher interest rates in 2022 have only very limited impact on NatWest deposits. 40% of NatWest's £433bn customer deposits remain in non-interest-bearing accounts. Total business segment deposits fell by only 2.9% in 2022, and declines were concentrated in more sophisticated and rate-sensitive C&I accounts; Retail Banking deposits were flattish overall, and Private Banking deposits actually grew, with a small migration from Current Accounts to Savings:
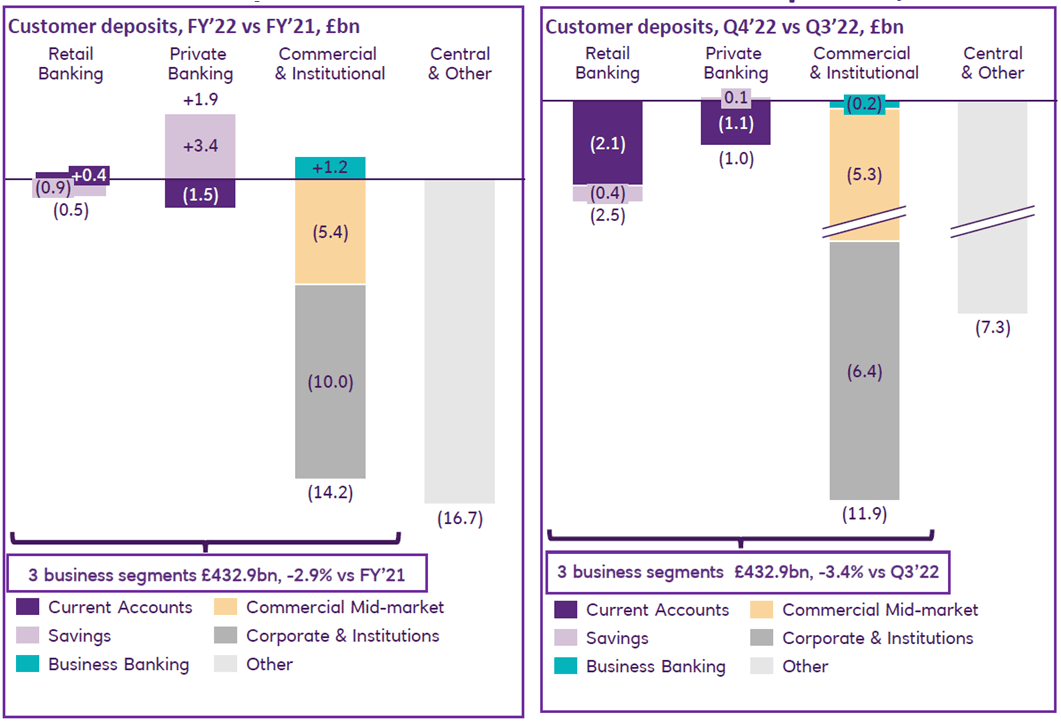
Q4 2022 saw a slightly larger 3.4% decline in business segments deposits from Q3, in part because NatWest continues to avoid competing on price and has much more than it needs.
(Most of the 2022 decline in "Central & Other" deposits was due to a reduction in Ulster Bank RoI deposits from £18.4bn to £6.2bn as part of NatWest's phased withdrawal there.)
NatWest's Moderate Loan Growth
NII is supported by moderate loan growth. Total loans grew by 2% in 2022, with an 8% growth in Retail Banking, a 4% growth in each of Private Banking and C&I, offset by a decline in Central & Other (which includes Ulster Bank RoI):
| NatWest Loan Balances by Segments (Q4 2022 vs. Prior Periods) Source: NatWest results presentation (Q4 2022). |
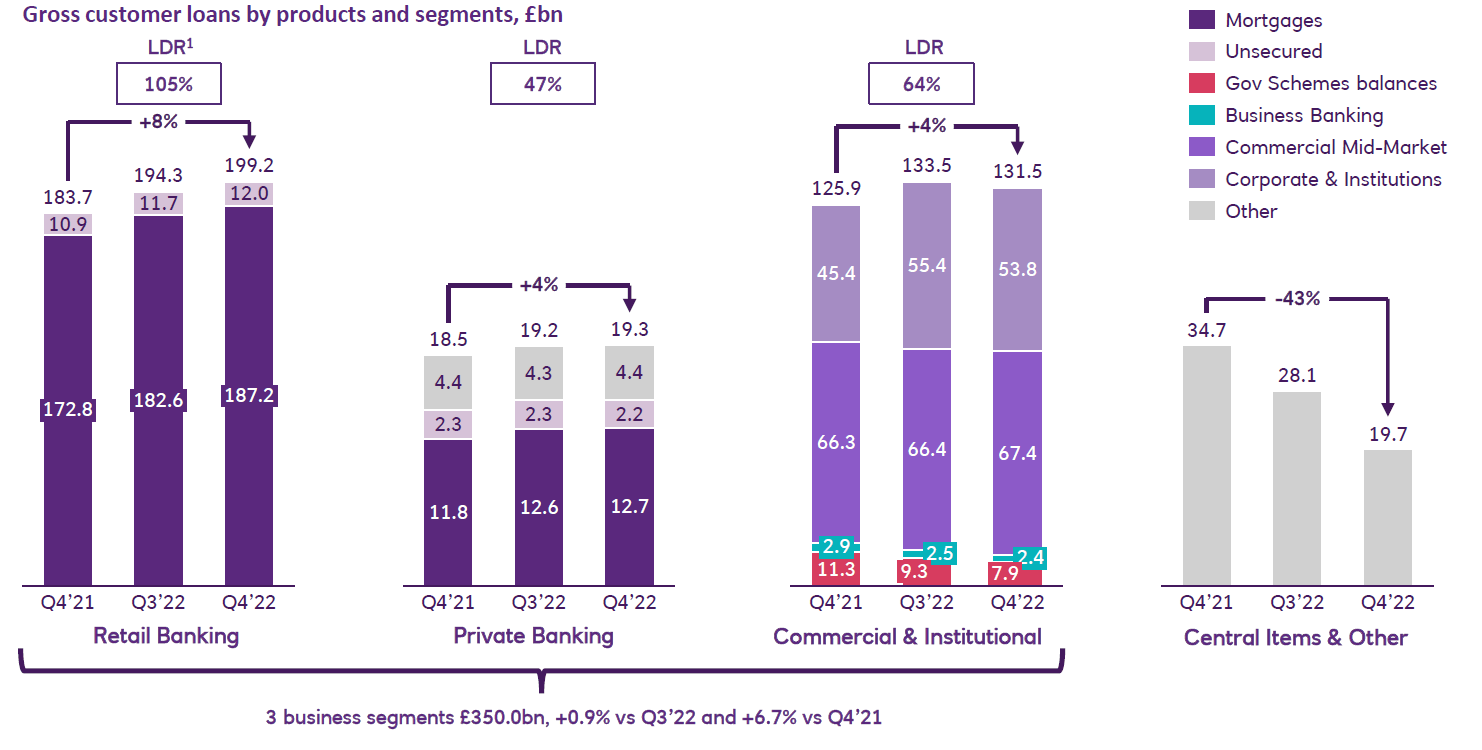
NatWest continues to have less in deposits than can be supported by its deposits, with Loan/Deposit Ratio at just 79% for the group, including 105% in Retail Banking, but as low as 64% in C&I and 47% in Private Banking.
Excess deposits are partly deployed in a "Product Structural Hedge," which has a notional value of £184bn and a yield of 1.16% at the end of Q4 2022. This yield is lower than market rates and should rise as parts of the hedge gradually mature and are redeployed (with half the benefit expected in 2023); the benefit is included in 2023 NIM guidance.
Non-Interest Income Relatively Resilient
NatWest's Non-Interest Income is partly influenced by macro conditions, but should be resilient overall.
As of 2022, 28% (£886m) of Non-Interest Income is in Trading & Other Income, which is partly driven by customer activity. The remaining 72% (£2,292m) is Net Fees & Commissions and consists of a number of different lines.
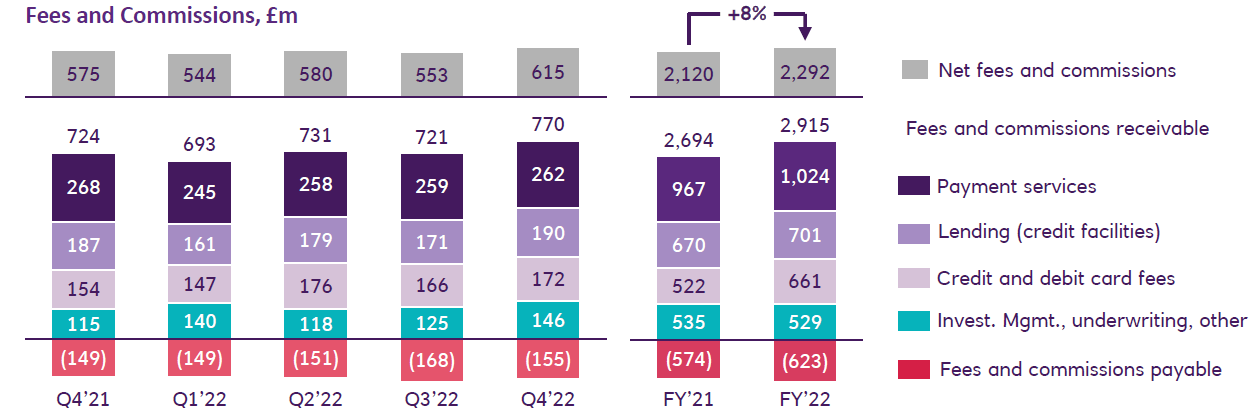
With Net Fees & Commissions, "Payment Services" and "Investment Management, Underwriting, Other" are at least partly recurring, are growing structurally and should be resilient in a downturn. The levels of "Lending (Credit Facilities)" and "Credit & Debit Card Fees" may be more influenced by macro conditions.
Good Cost Control Protects Earnings
Cost control is strong, and Cost/Income Ratio is expected to improve again in 2023, which should help protect ROTE.
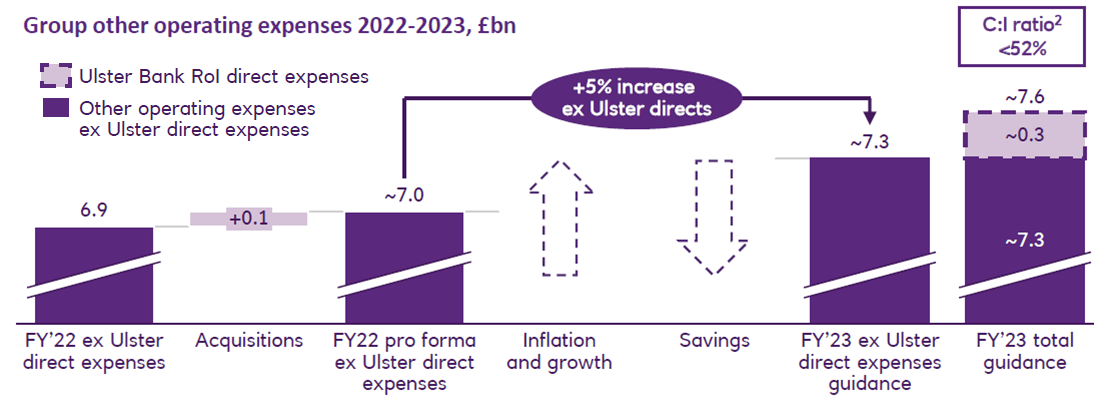
Other Operating Expenses (i.e., expenses excluding Litigation & Conduct Costs) are expected to grow by 5% in 2023, excluding direct costs related to the Ulster Bank RoI segment now in run-off, with savings offsetting inflation and growth.
Cost/Income Ratio is expected to be less than 52% in 2023, a further improvement from the 55.5% figure in 2022. This includes £300m of Ulster Bank RoI expenses, which are down from £433m in 2022 and should disappear in 2024.
NatWest targets a Cost/Income Ratio of less than 50% by 2025, and we believe this is achievable. Banks are platform businesses with natural operational leverage and economies of scale, and NatWest's investments in technology in recent years have helped it become more efficient.
NatWest Credit Losses Should Stay Limited
Potential credit losses in the event of a U.K. downturn represent the main risk to our investment case.
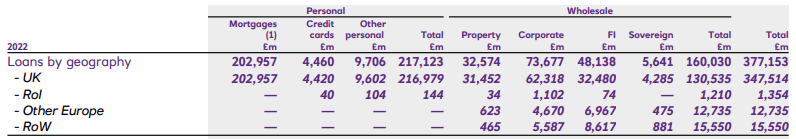
NatWest's loan book is 92% U.K., including 54% in U.K. Mortgages. The remainder is reasonably diversified, with Credit Cards being less than 4% and Commercial Real Estate each being less than 5%.
Management also stated that they have "low exposure" to potentially problematic sectors such as Retail (£8.4bn), Automotive (£7.3bn) and Leisure (£7.5bn).
NatWest's Mortgage portfolio has a Loan-To-Value ("LTV") of 53%. 66% of the portfolio is on 5-year fixed rate products, but 25% is on 2-year fixed; 10% is to Buy-To-Let ("BTL") customers.
| NatWest Mortgage Book Snapshot (2022) Source: NatWest results presentation (Q4 2022). |
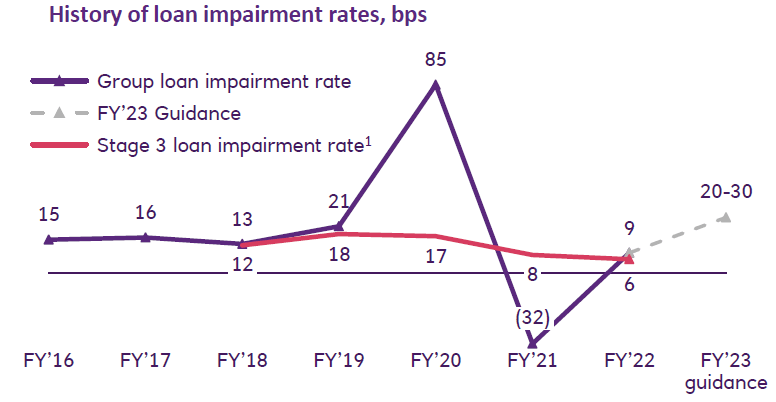
Estimated Credit Loss provisions were 0.91% of group loans (excluding disposal group loans) at 2022 year-end, consisting of £3.43bn of provisions on £379bn of loans. Small percentage swings in credit losses can have a major impact on group earnings (Operating Profit was £5.13bn in 2022) and capital (Tangible Book Value was £25.5bn).
Impairments have remained low in recent years (except for a spike in provisions in 2020 for COVID-19 that was reversed in 2021), and management is guiding to an Impairment Rate of 20-30 bps in 2023, slightly higher than 2019 (21 bps).
NatWest could be a poor investment should a major U.K. economic downturn materializes.
NatWest Valuation
As of 12:35 pm in London, NatWest shares are at 285.4p. This represents a valuation of:
- 1.08x P/TBV, relative to Q4 2022 TBV of 264p per share
- Less than 10x P/E, provided ROTE is above 10.8% (vs. 14-16% guided)
- 4.7% Dividend Yield, relative to 2022 regular dividends of 13.5p.
Relative to 2022 EPS (33.8p), the P/E is 8.4x. If NatWest achieves the mid-point of its 14-16% ROTE guidance, then its P/E multiple will be even lower at 7.2x.
The "less than 10x P/E" in our more pessimistic assumptions nonetheless represents an earnings yield of more than 10%. While management only targets a Dividend Payout Ratio of 40%, we expect most of the rest of the earnings to be spent on buybacks, which should also benefit shareholders in the form of a lower share count and a higher EPS (which will translate back to a higher dividend).
NatWest actually declared 30.3p of dividends in 2022, representing a 10.6% Dividend Yield, but this includes 16.8p of special dividends, as NatWest started 2022 with a CET1 ratio of as high as 18.2% (vs. 13-14% targeted).
Even on regular dividends alone, actual dividend yield will almost certainly be close to 5% (or higher) in the next few years, as EPS continues to grow (including from buybacks). A lower-growth scenario should also see NatWest needing less capital and thus distributing more in dividends.
Conclusion
We expect NatWest stock to deliver a 10%+ annualized return by 2025 year-end, including:
- Around 5% annualized return from dividends
- 3-5% from EPS growth, including from buybacks
- 1%+ from P/E re-rating to 10x.
A benign U.K. macroeconomic environment, especially if a recession can be avoided, will result in much higher returns for NatWest Group plc.
However, NatWest stock could be a bad investment in the event of a major U.K. downturn.
We initiate our coverage of NatWest Group plc with a Buy rating.
For further details see:
NatWest: Down After FY22 Results, <10x P/E And 5% Dividend Yield