NCMGF - Newmont: Another Weak Production Quarter Waiting For Newcrest Mining
2023-07-27 12:33:19 ET
Summary
- NEM reported a net income from continuing operations of $155 million or $0.19 per diluted share in the second quarter of 2023.
- Gold production was 1,240K Au Oz, and total gold equivalent production was 1,496K Au equivalent Oz.
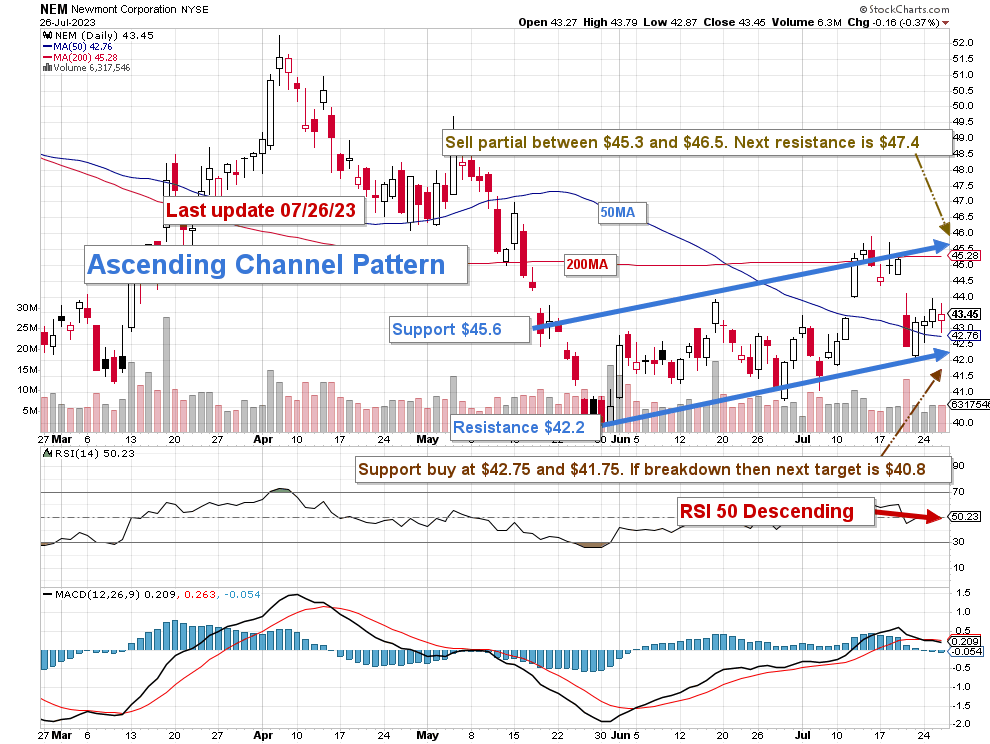
- I recommend buying NEM between $42.75 and $41.75 with possible lower support at $40.8.
Introduction
Newmont Corporation ( NEM ) released its second-quarter 2023 earnings on July 20, 2023.
Note: This article updates my June 8, 2023, article. I have followed NEM on Seeking Alpha since Dec. 2014.
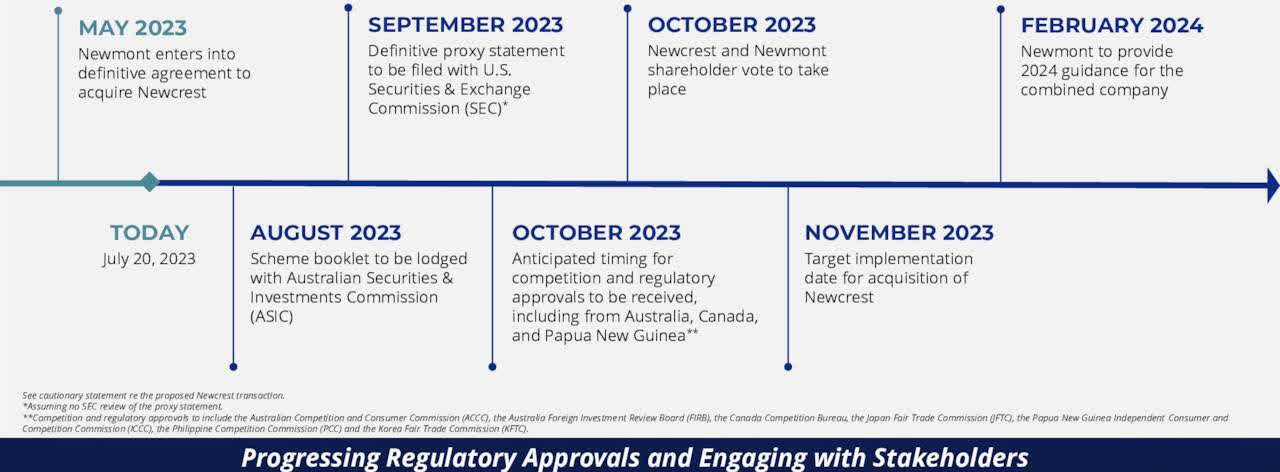
On May 14, 2023, Newmont Corporation agreed to acquire 100% of the issued shares in Newcrest Mining Limited. The deal is expected to be completed at the end of 2023.
NEM Newcrest Acquisition Timeline (NEM Presentation)
Newcrest shareholders to receive 0.400 Newmont shares (or 0.400 Newmont CDI1) for each Newcrest share and a special dividend of up to $1.10 per share paid by Newcrest, representing a 30.4 percent premium.
On July 25, 2023, Newcrest Mining ( OTCPK: NCMGF ) ( OTCPK: NCMGY ) reported its 4Q22 gold and copper production. I will also discuss it here, assuming that production will be added to Newmont Corporation in 4Q23 or 1Q24.
1 - Newmont Corp.: Second Quarter of 2023 Highlights and Subsequent Events
The 2Q23 earnings results were disappointing and lower than analysts' expectations. Attributable gold production was significantly down.
Revenues were also disappointing, with $2,683 million down from $3,058 million in 2Q22, despite a gold price reaching a record high at $1,965 per ounce. Attributable gold production was 1,240K Au ounces in 2Q23, and attributable gold equivalent production was 1,496K GEOs. JV Nevada Gold Mines produced 289K Au Oz , down from 290K Au Oz last year.
NEM sold 1,197 Au Oz and 1,448 GEOs in 2Q23.
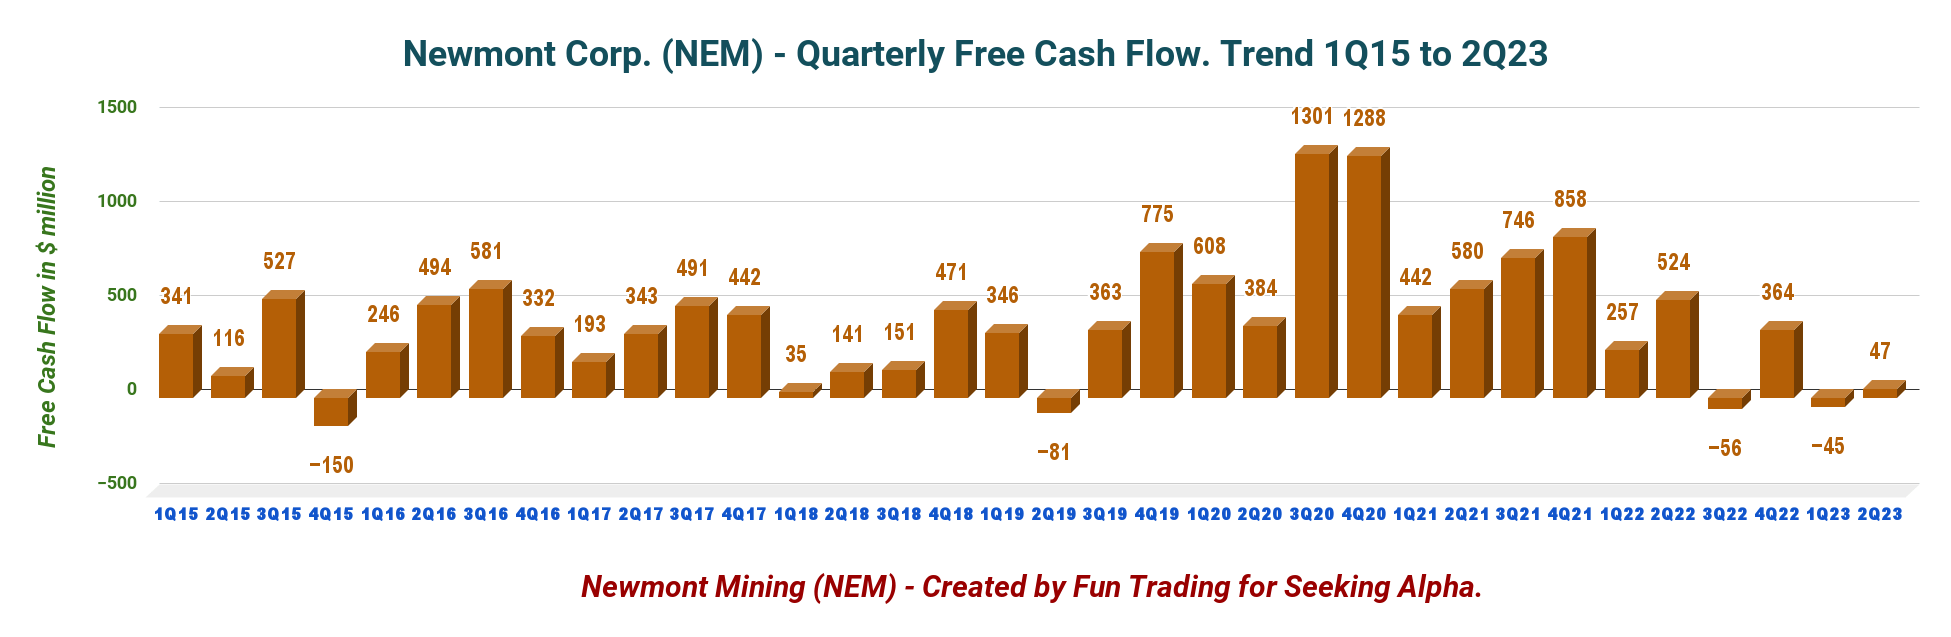
The free cash flow 2Q23 was only $47 million compared to $524 million last year.
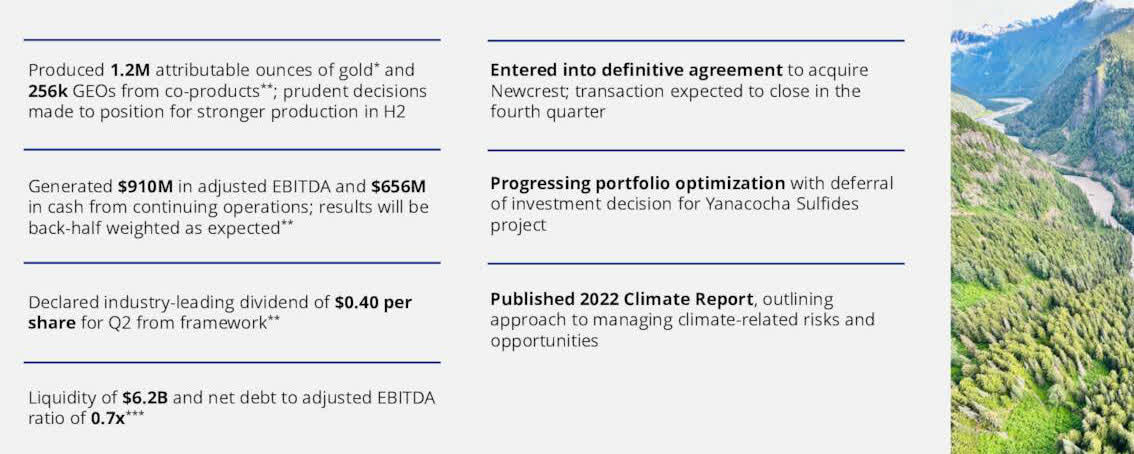
Below are the main components from the July Presentation.
NEM 2Q23 Highlights (NEM July Presentation)
NEM reported a net income from continuing operations of $155 million or $0.19 per diluted share in the second quarter of 2023, compared to $387 million or $0.49 per share last year. The adjusted earnings were an income of $0.33 per share.
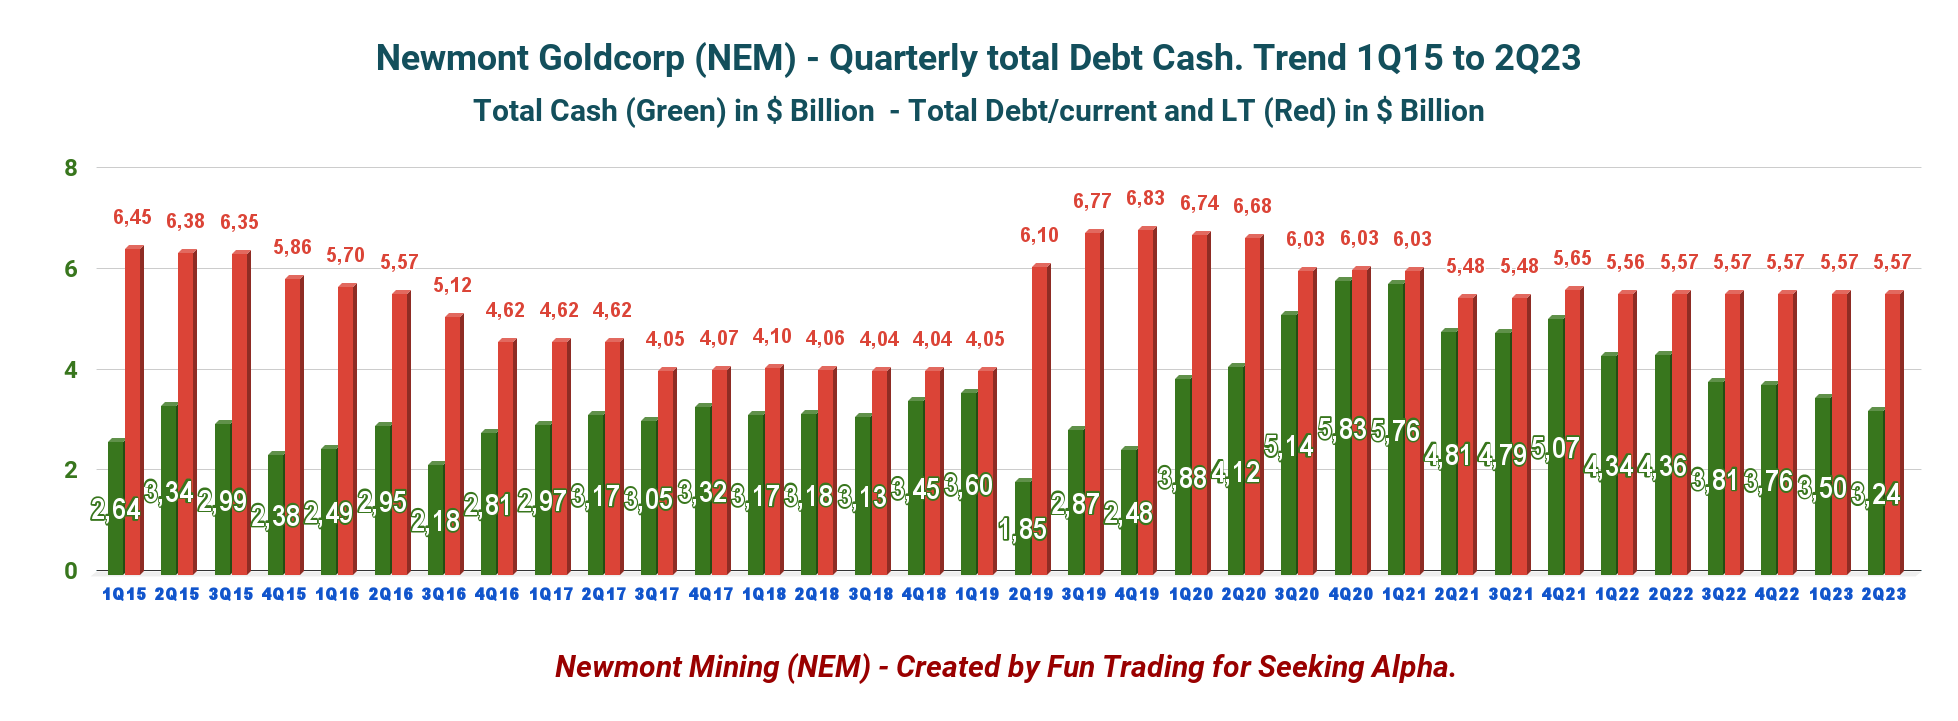
Liquidity was strong in 2Q23, ending with $3,238 million of consolidated cash and approximately $6.5 billion of liquidity; reported net debt to adjusted EBITDA of 0.6x.
Reserves for 2022 were set at 96 Au Moz, and resources at 111 Au Moz , with significant upside from other metals, including copper, silver, lead, and zinc. The reserve will be revised soon after the acquisition of Newcrest, probably in December 2023.
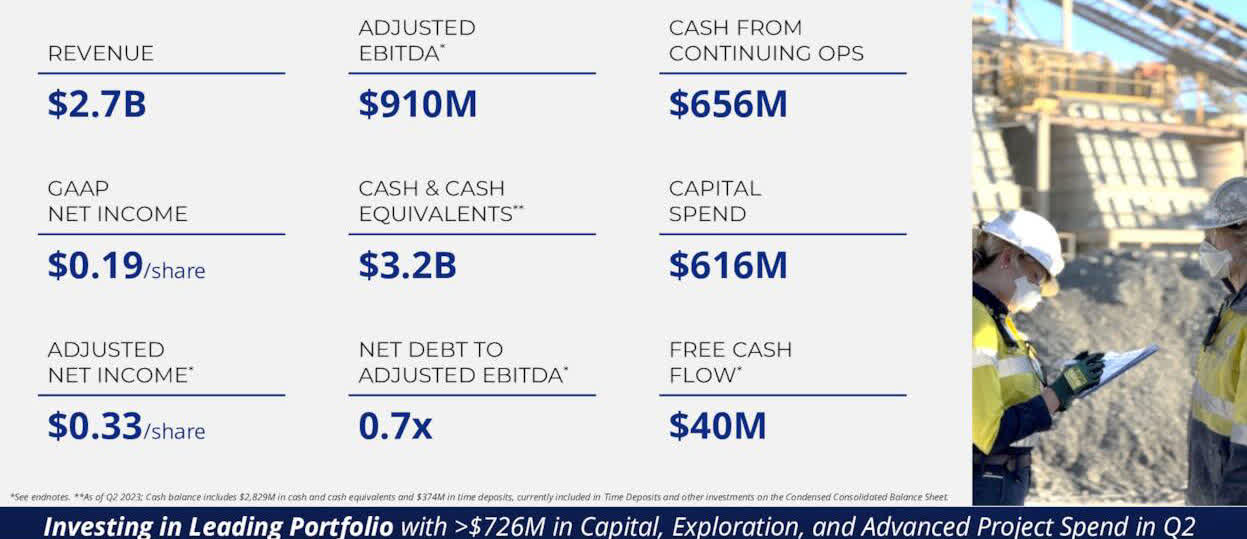
NEM 2Q23 Financials (NEM Presentation)
CEO Tom Palmer said in the conference call:
While I'm not happy with our ultimate financial results for the second quarter, I am very comfortable with the prudent decisions that we made during the quarter to safeguard our workforce, protect long-term value, and position Newmont to deliver strong performance in the second half of this year and beyond.
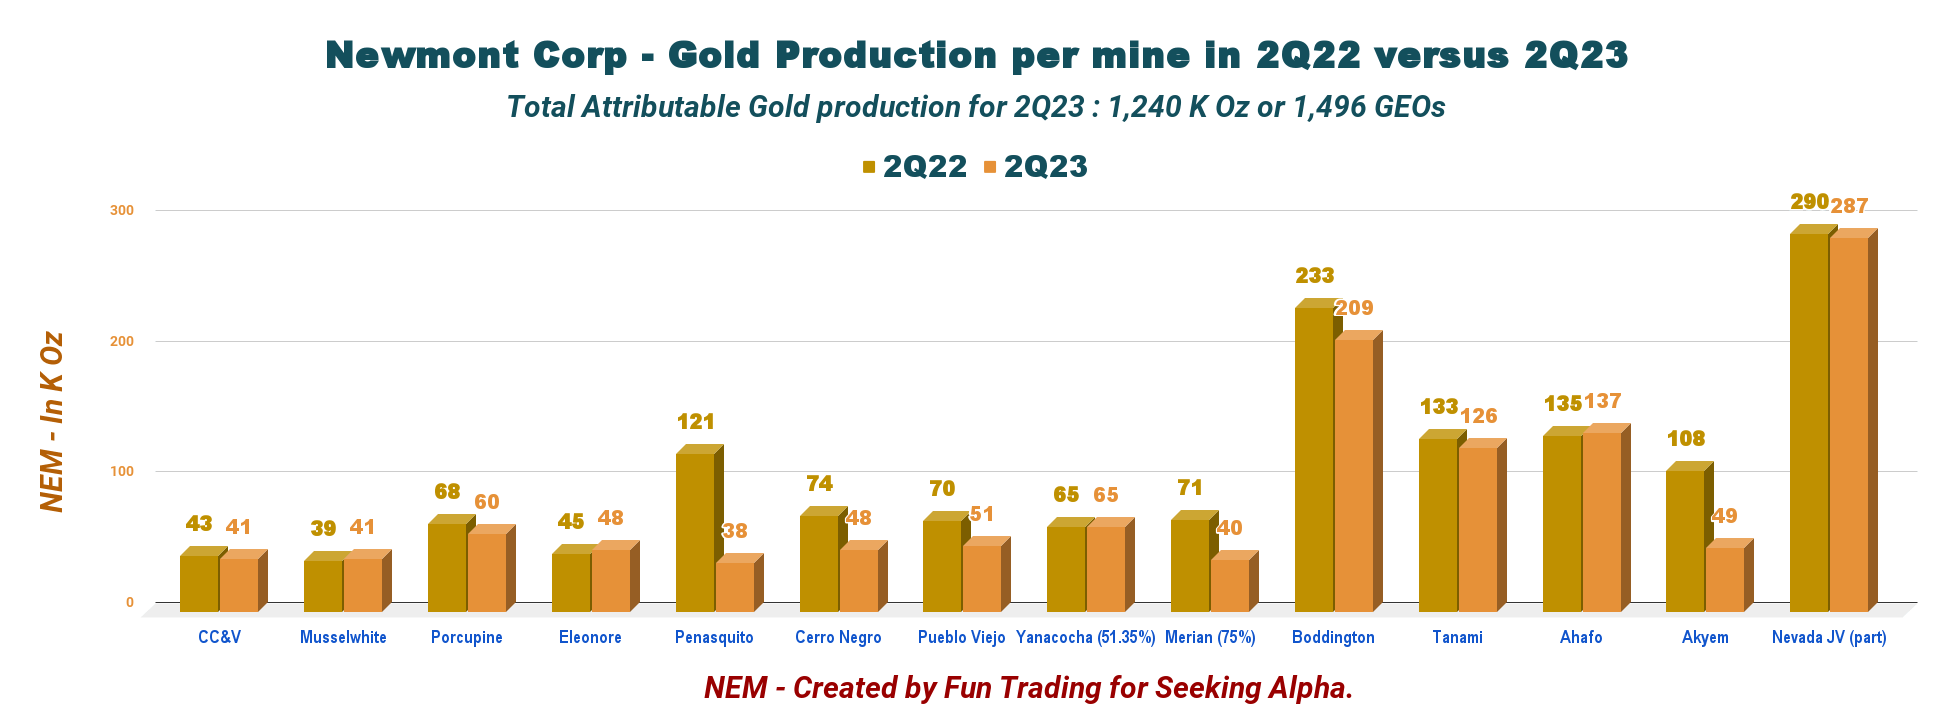
2 - Let's Compare Gold Production in 2Q22 with 2Q23 Per Mine
Newmont's attributable gold production in the second quarter decreased year-over-year to 1.240 Moz compared to 1,495 Moz last year.
Below is a chart of comparative production per mine year-over-year. Penasquito (Union issue), Merian, and Akyem (processing lower-grade stockpiles) were the main culprits. The Penasquito suspension is likely affecting the 3Q23 as well.
NEM 2Q22 versus 2Q23 Gold Production per Mine Comparison (Fun Trading)
CEO Tom Palmer said in the conference call:
We decided to suspend operations at Peñasquito to focus on finding an appropriate and sustainable resolution to the current dispute with the Union representing our workforce in Mexico. This dispute is associated with a profit-sharing agreement that we made with the Union leadership only 12 months ago.
3 - Stock Performance
Newmont Corp. is part of my long-term selected gold miners with Barrick Gold ( GOLD ), Agnico Eagle ( AEM ), and Kinross Gold ( KGC ). Also, it is important to look at Newcrest Mining (NCMGF). Unfortunately, Newmont has continuously underperformed the group on a one-year basis, and the recent results are not helping.
NEM is down over 2% on a one-year basis, making it the worst performer by a large margin. Poor stock performance is an issue for long-term shareholders, and the company should address the subject more openly and search for the reasons for this underperformance.
4 -Investment Thesis
Despite this recurring underperformance in gold production, Newmont Corporation is still one of my long-term gold miners.
I am accumulating NEM on weakness because I believe those issues the company is experiencing will be resolved soon. However, this constant underperformance is quite painful, and shareholders are entitled to be upset.
The quarterly dividend is fixed at $0.40 per share in 2Q23, or a yield of 3.68%, which is quite high. The most bothersome issue is that NEM could not capitalize on this quarter's record-high gold price.
The risk of lower quarterly dividend payments in the near future is not negligible, even if the company kept the $0.40 per share this quarter. Thus, we have to be careful here.
Thus, trading short-term LIFO for about 45% of your long-term NEM position is necessary to take advantage of the gold price volatility and the temporary intrinsic weakness of the stock.
5 - Newcrest Mining ((NCMGF)) Quarterly Production in Gold, Silver, and Copper As of June 2023.
The company released its second-quarter production results on July 25, 2023.
Production for FY23 was 2,105,069 Au oz, 133,149 Cu Tonnes, and 1,384,369 Ag Oz with FY23 AISC of $1,094/oz.
Gold production was within the guidance range, but copper was 1% below. The guidance range for FY23 was 2,100k-2,400k Au oz and 135k-155k Cu Tonnes.
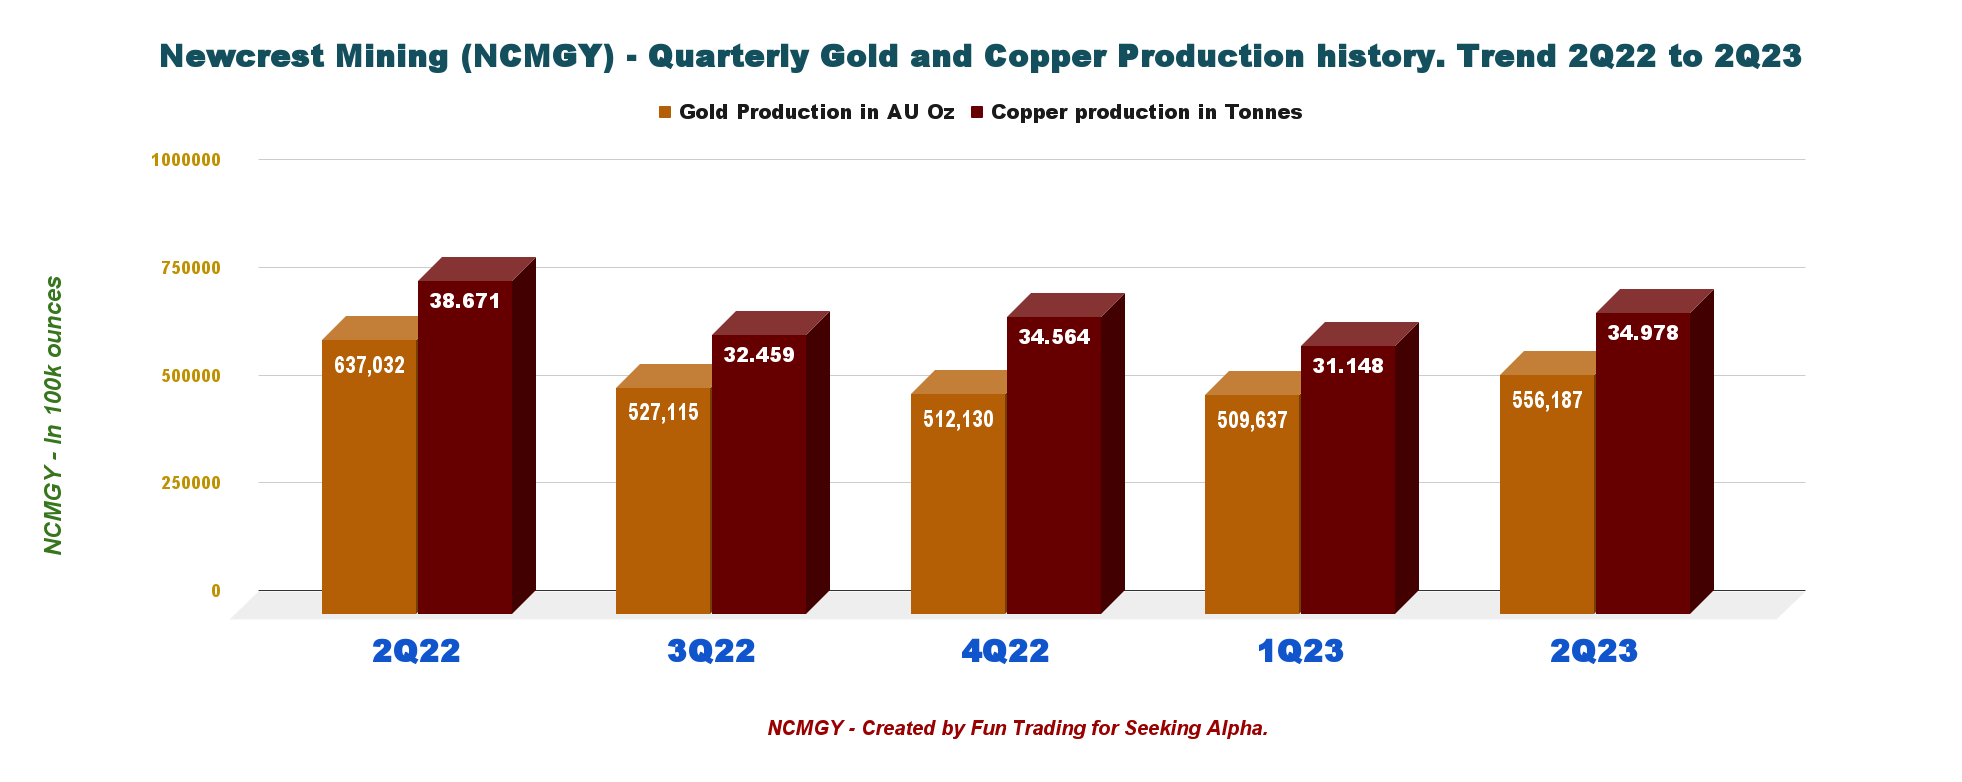
5.1 - Production details from 2Q22 to 2Q23
| Gold Production K Oz |
| 2Q22 |
| 3Q22 |
| 4Q22 |
| 1Q23 |
| 2Q23 |
| Gold Production K Oz (Attributable) |
| 637,032 |
| 527,115 |
| 512,130 |
| 509,637 |
| 556,187 |
| Copper production in K Tonnes |
| 38.671 |
| 32.459 |
| 34.564 |
| 31.148 |
| 34.978 |
| Silver production in K oz |
| 435,587 |
| 361,957 |
| 303,537 |
| 312,970 |
| 406,505 |
| Gold price realized $/Oz |
| 1,854 |
| 1,698 |
| 1,693 |
| 1,860 |
| 1,928 |
| Copper price realized $/ Lbs |
| 4.31 |
| 3.53 |
| 3.66 |
| 4.01 |
| 3.83 |
| AISC Gold $/Oz |
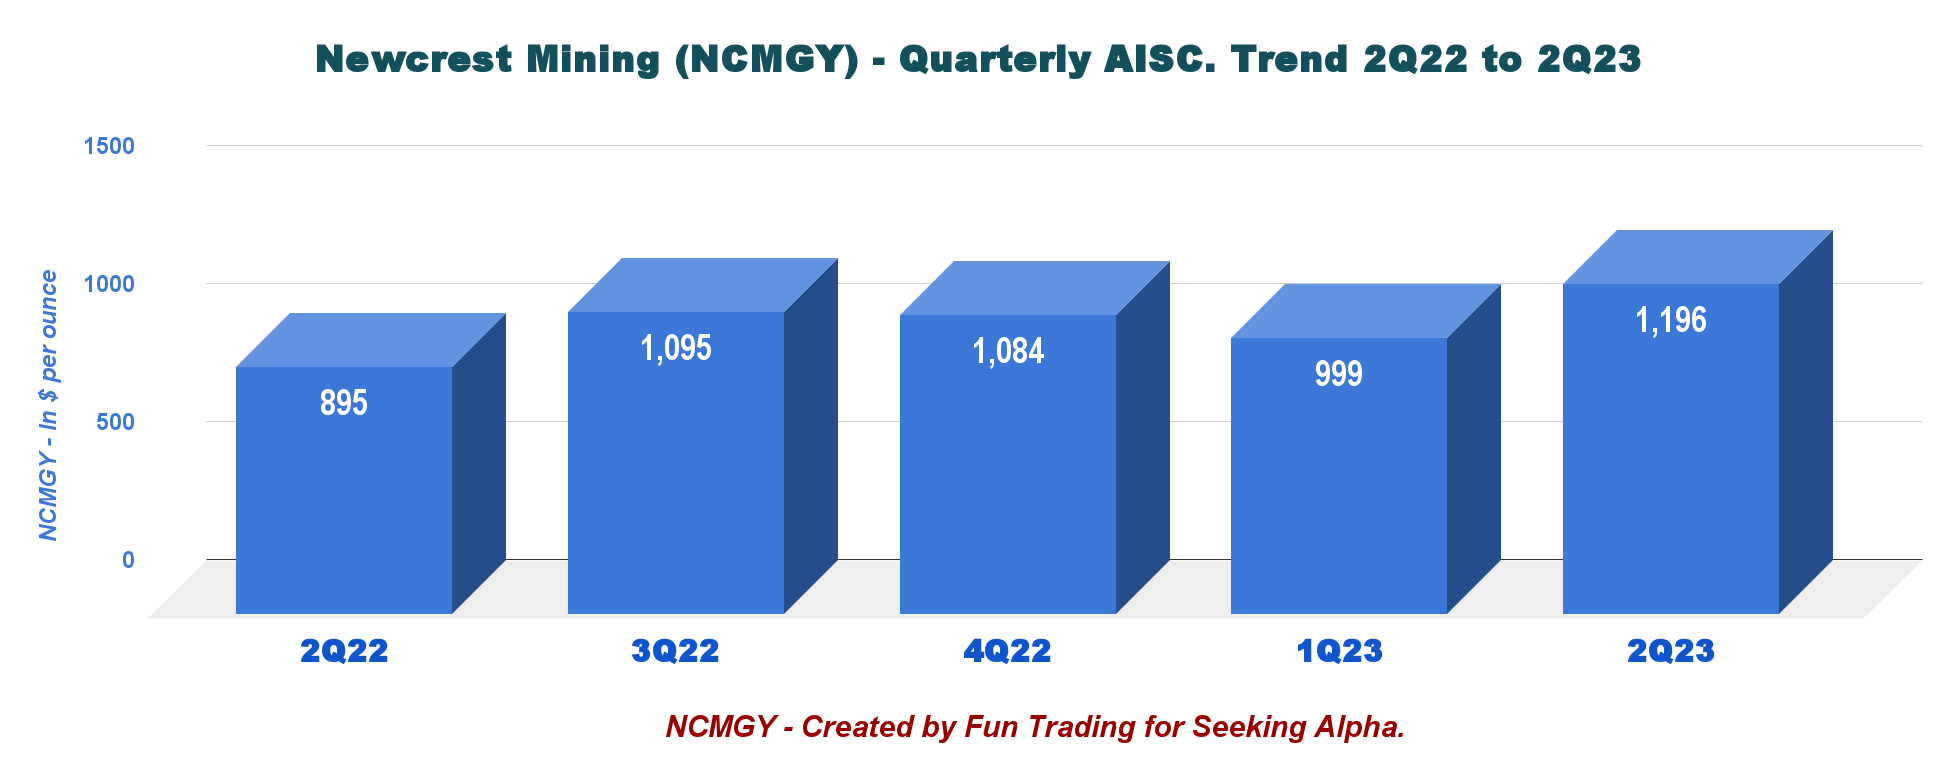
| 895 |
| 1,095 |
| 1,084 |
| 999 |
| 1,196 |
| Mines |
| 2Q22 |
| 3Q22 |
| 4Q22 |
| 1Q23 |
| 2Q23 |
| Cadia Gold |
| 186,766 |
| 142,194 |
| 169,262 |
| 133,468 |
| 151,955 |
| Cadia Copper Tonnes |
| 28,676 |
| 23,406 |
| 27,146 |
| 22,392 |
| 25,246 |
| Lihir Gold |
| 212,932 |
| 165,243 |
| 154,143 |
| 168,404 |
| 182,223 |
| Telfer Gold |
| 97,443 |
| 84,372 |
| 87,985 |
| 85,452 |
| 91,014 |
| Telfer Copper |
| 3,008 |
| 2,962 |
| 3,256 |
| 5,076 |
| 5,371 |
| Brucejack Gold |
| 90,408 |
| 84,123 |
| 51,813 |
| 70,160 |
| 79,907 |
| Red Chris Gold |
| 13,678 |
| 12,259 |
| 10,163 |
| 7,347 |
| 9,573 |
| Red Chris Copper |
| 6,987 |
| 6,090 |
| 4,162 |
| 3,680 |
| 4,361 |
| Fruta del Norte Gold |
| 35,805 |
| 38,923 |
| 38,764 |
| 44,807 |
| 41,514 |
| Total Gold Production |
| 637,032 |
| 527,114 |
| 512,130 |
| 509,638 |
| 556,186 |
| Total Copper production |
| 38,671 |
| 32,458 |
| 34,564 |
| 31,148 |
| 34,978 |
| Total Silver production in ounces |
| 435,587 |
| 361,957 |
| 303,537 |
| 303,537 |
| 303,537 |
Source: Quarterly Report for three months ending June 2023.
Newcrest Mining Quarterly Production in Gold and Copper History (Fun Trading)
Quarterly AISC History:
Newcrest Mining Quarterly AISC History (Fun Trading)
In the press release, the company said:
Newcrest's AISC of $1,196/oz for the quarter was 20% higher than the prior period, driven by higher capital expenditure mainly at Lihir, Cadia, and Red Chris, and a lower realised copper price. This was partly offset by higher gold production across all operating sites during the quarter (except for Fruta del Norte) driving an increase in gold sales volumes for the Group, as well as the benefits of higher copper sales volumes and a weakening Australian dollar against the US dollar on operating costs.
Newmont: Financials and Production History Ending in 2Q23. The Raw Numbers
| Newmont |
| 2Q22 |
| 3Q22 |
| 4Q22 |
| 1Q23 |
| 2Q23 |
| Total Revenues in $ Billion |
| 3.06 |
| 2.63 |
| 3.20 |
| 2.68 |
| 2.68 |
| Net income in $ Million |
| 387 |
| 213 |
| -1,477 |
| 351 |
| 155 |
| EBITDA $ Million |
| 1,024 |
| 859 |
| -759 |
| 1,065 |
| 835 |
| EPS diluted in $/share |
| 0.49 |
| 0.27 |
| -1.86 |
| 0.44 |
| 0.19 |
| Cash from operations in $ Million |
| 1,043 |
| 473 |
| 1,010 |
| 481 |
| 663 |
| Capital Expenditure in $ Million |
| 519 |
| 529 |
| 646 |
| 526 |
| 616 |
| Free Cash Flow In $ Million |
| 524 |
| -56 |
| 364 |
| -45 |
| 47 |
| Total cash $ Billion |
| 4.36 |
| 3.81 |
| 3.76 |
| 3.50 |
| 3.24 |
| Long-term debt in $ Billion |
| 5.57 |
| 5.57 |
| 5.57 |
| 5.57 |
| 5.57 |
| Dividend per share in $ |
| 0.55 |
| 0.55 |
| 0.40 |
| 0.40 |
| 0.40 |
| Shares Outstanding (diluted) |
| 795 |
| 795 |
| 797 |
| 795 |
| 795 |
Source: Company 10-k filing .
Part 1 - Gold Production Details
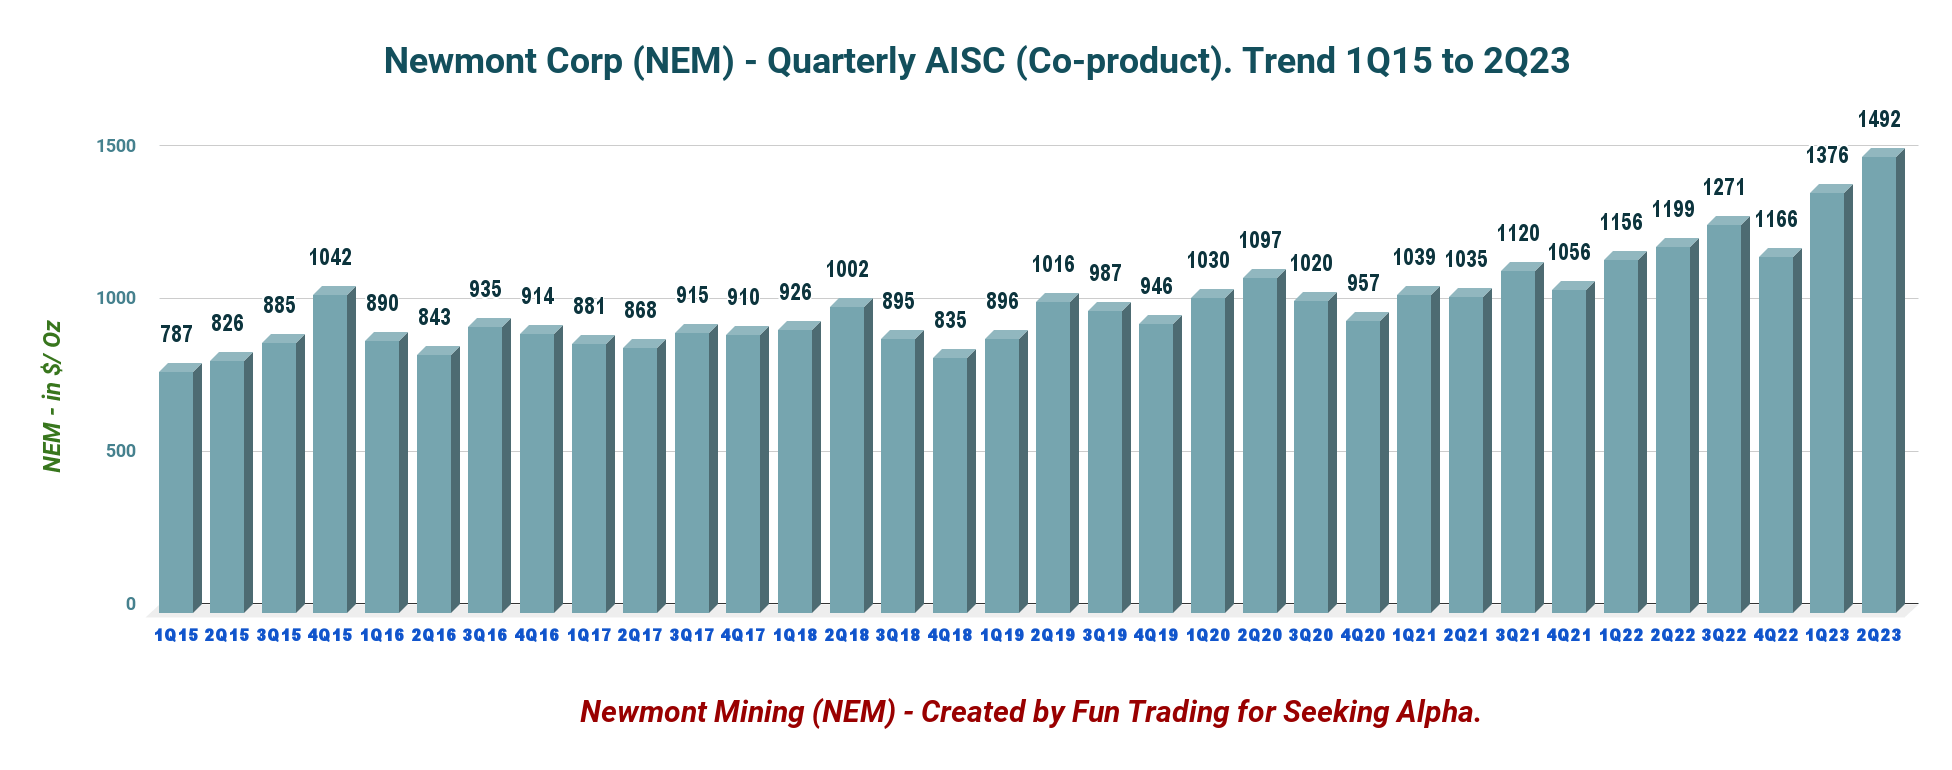
1 - All-In Sustaining Costs or AISC
NEM Quarterly AISC (gold) History (Fun Trading)
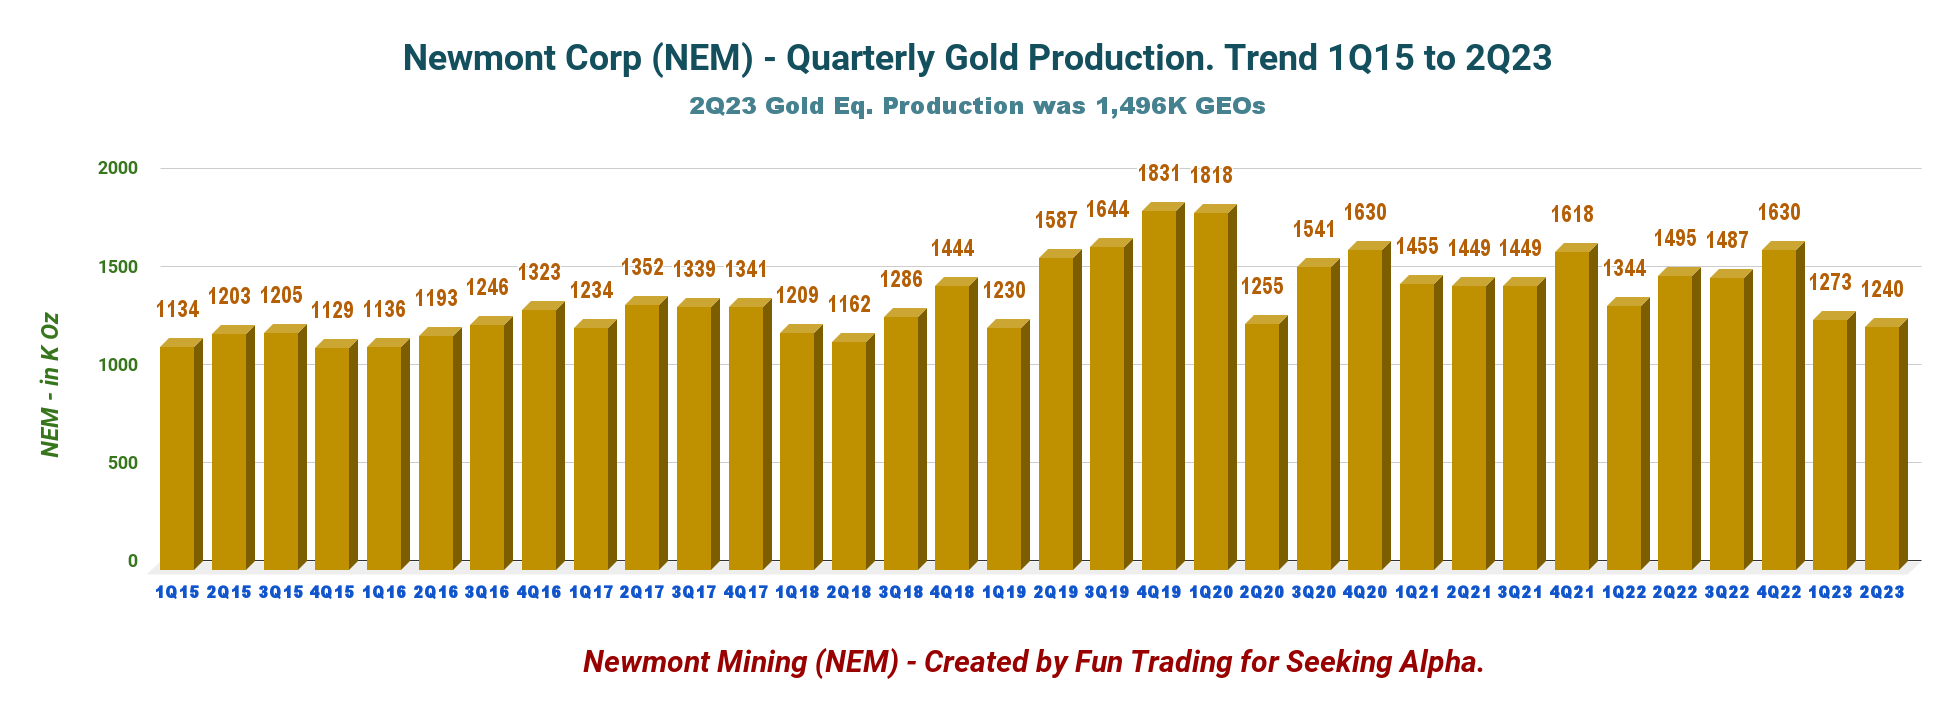
2 - Presentation of Newmont Gold Production in Two Charts
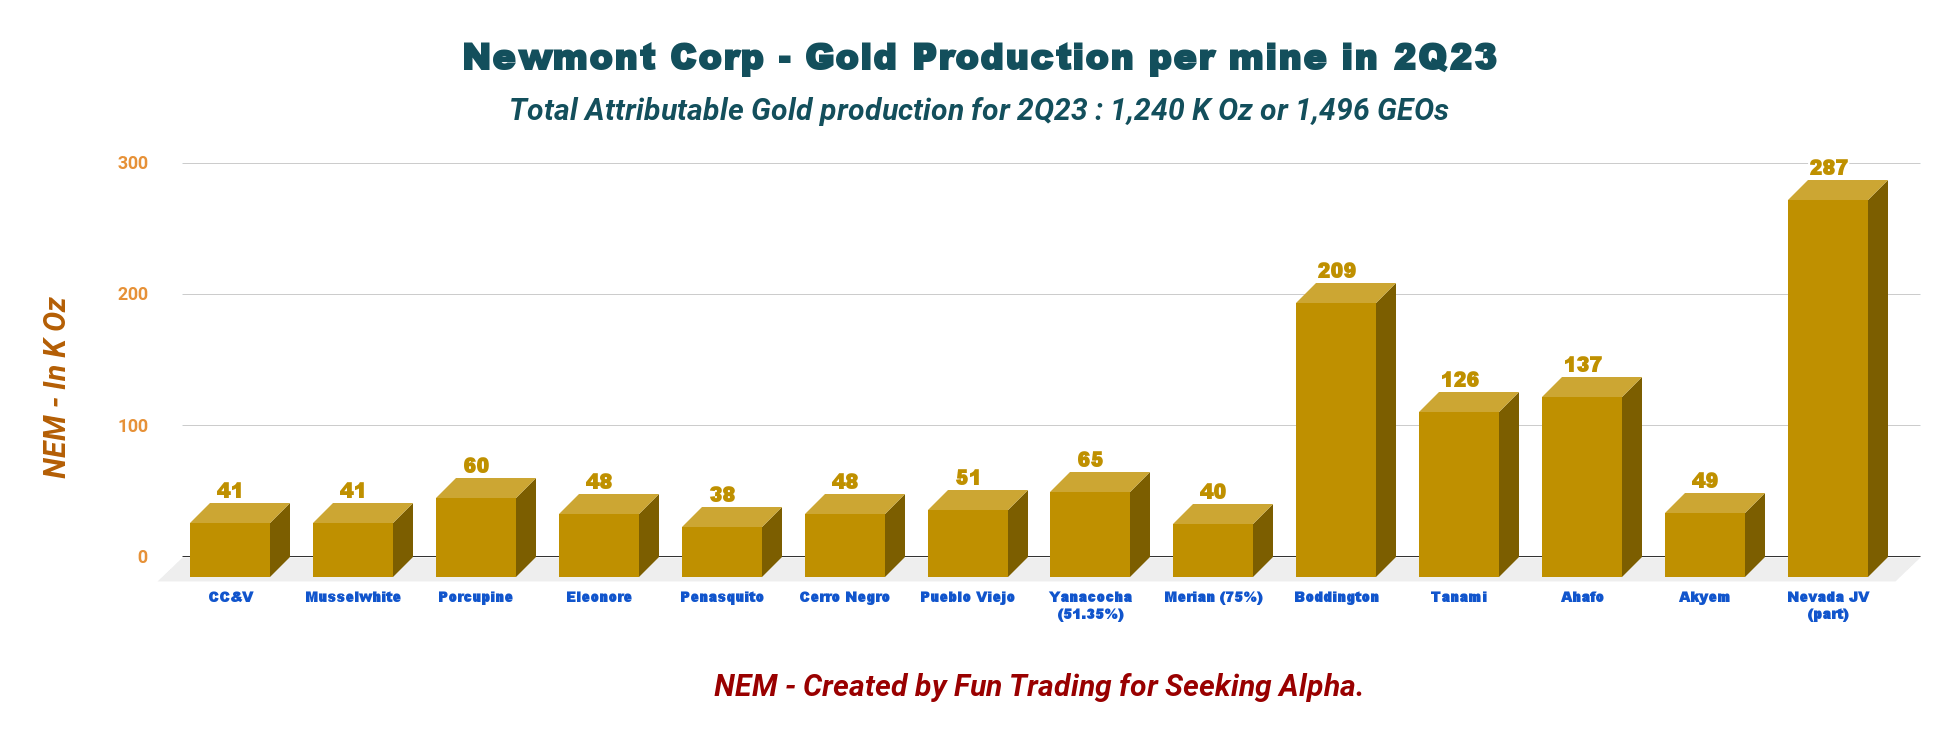
The quarter was weak for gold production, significantly down from 2Q22 but aligned with expectations. Gold production was 1,240K Au Oz , and total gold equivalent production was 1,496K Au equivalent Oz or GEOs. As we can see in the chart below, it is a multi-year low.
NEM Quarterly Production History (Fun Trading)
Gold Production in 2Q23 per producing mine, including Goldcorp and the JV Barrick/Newmont (Newmont owns 38.5%).
NEM 2Q23 Gold Production per Mine (Fun Trading)
Part 2 - Balance Sheet and Commentary
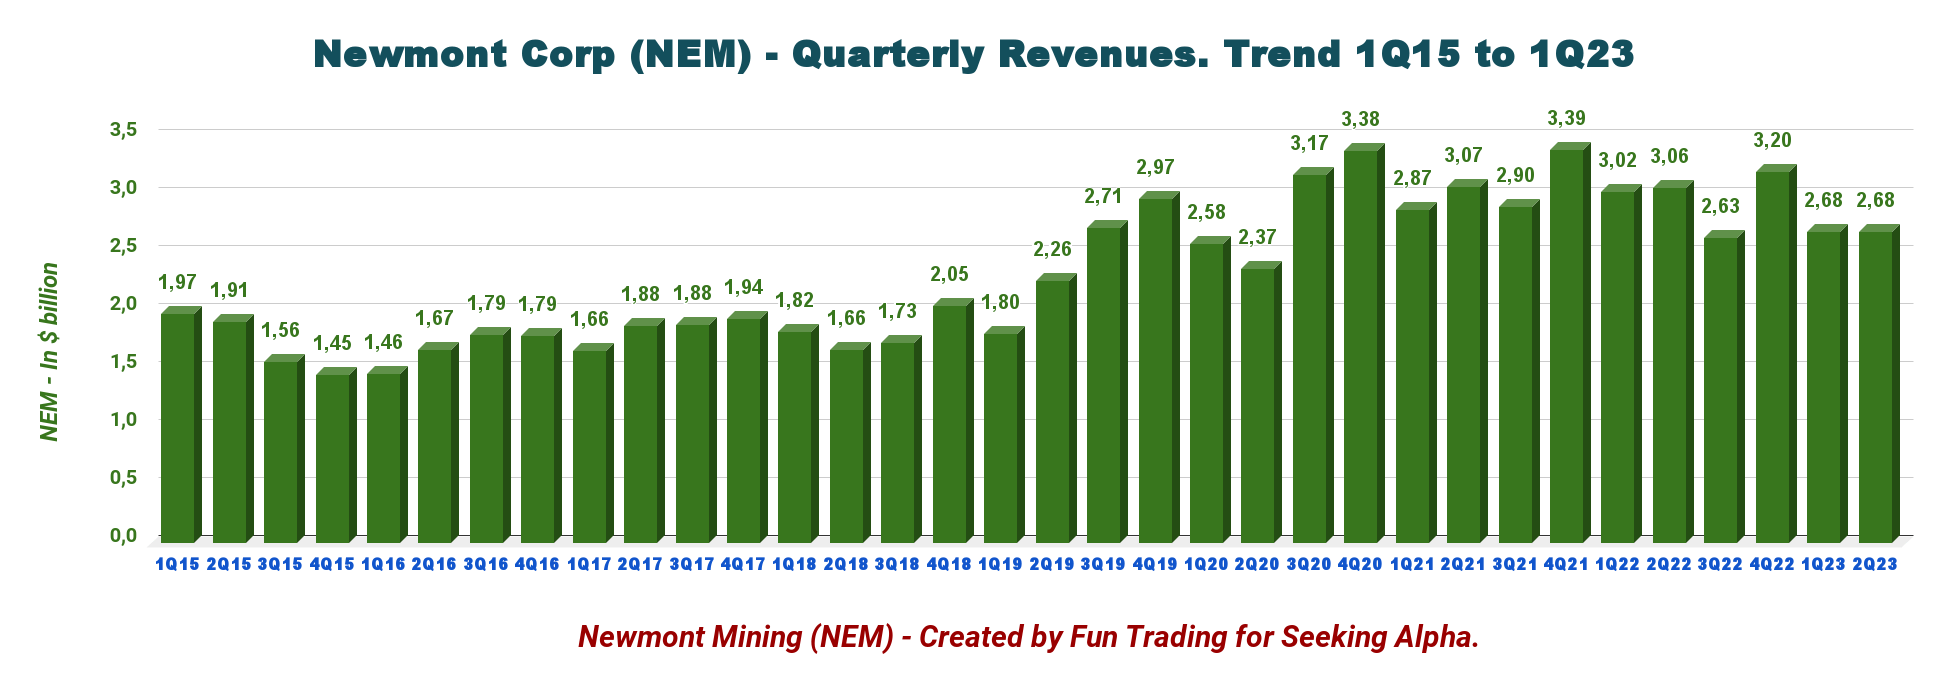
1 - Newmont Revenues were $2.683 Billion in 2Q23
NEM Quarterly Revenues History (Fun Trading) Revenues were $2.683 billion , and net income was $155 million, or $0.19 per diluted share, in 2Q23, compared to $387 million, or $0.49 per diluted share, the same quarter a year ago.
The adjusted net income was $0.33 per diluted share. The adjusted EBITDA was $910 million in 2Q23.
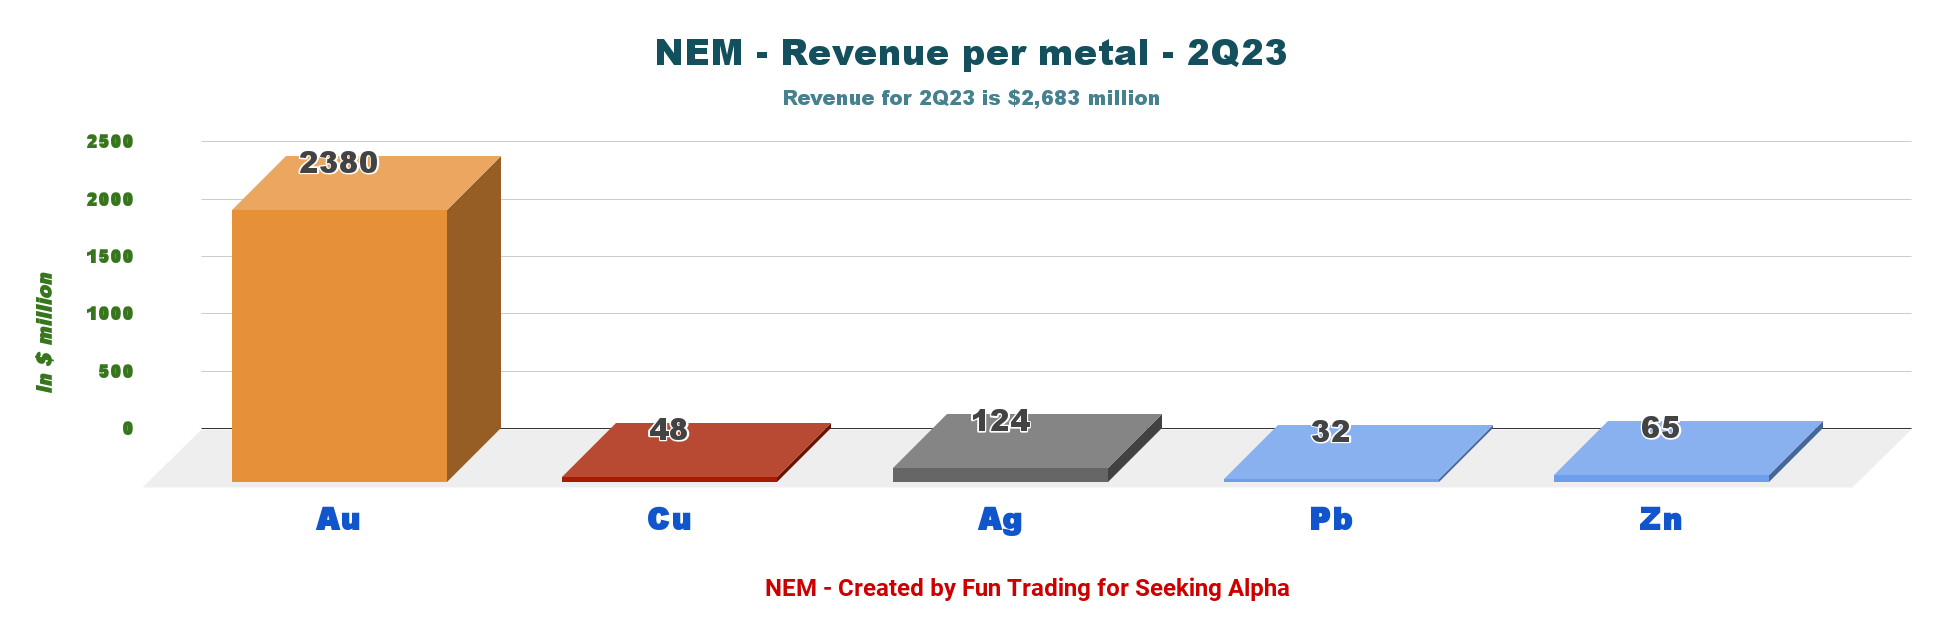
1.1 Revenue repartition per metal mined in 2Q23. Gold gets the lion's share.
As shown below, NEM is a gold producer, representing 88.7% of the total revenues.
NEM 2Q23 Revenue per Metal (Fun Trading)
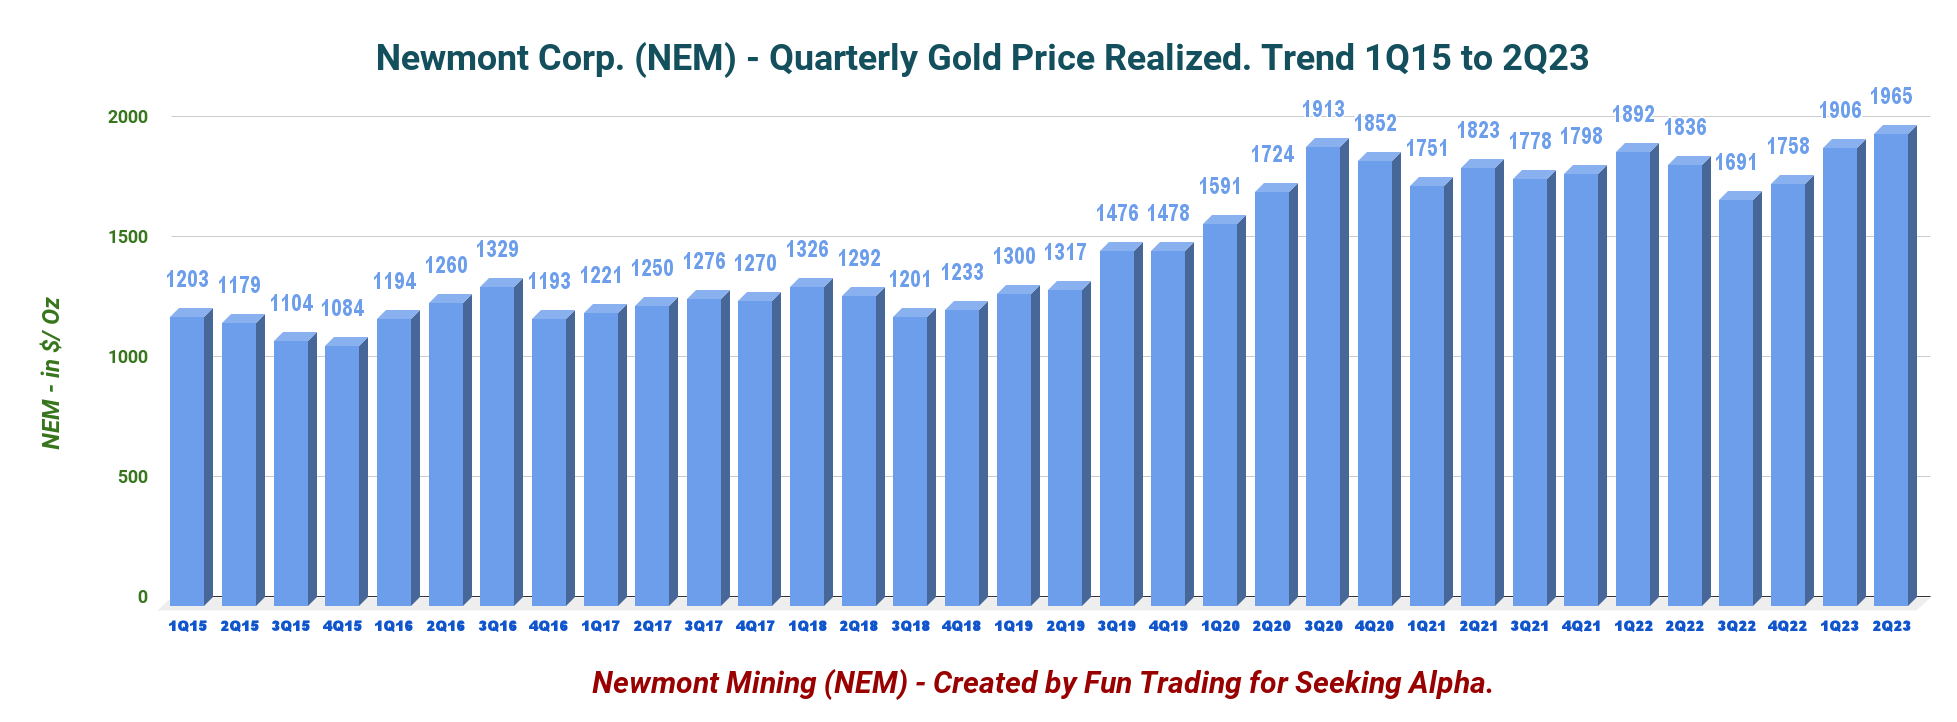
1.2 The gold price realized was a record of $1,965/Oz in 2Q23.
NEM Quarterly Gold Price History (Fun Trading)
2 - Newmont Reported a 2Q23 Free Cash Flow of $47 Million.
NEM Quarterly Free Cash Flow History (Fun Trading)
NEM's trailing 12-month free cash flow is substantial, with $310 million and a disappointing $47 million in 2Q23.
The management declared a quarterly dividend of $0.40 per share in 2Q23. However, with such a dismal FCF number, I wonder how long the company will keep the dividend at $0.40 per share.
3 - Newmont's LT Debt (Including Current) was $5.574 Billion at the End of June 30, 2023.
NEM Quarterly Cash versus Debt History (Fun Trading)
Part 3 - Technical Analysis (Short Term) and Commentary
NEM TA Chart Short-Term (Fun Trading StockCharts)
Note: The chart has been adjusted for dividends.
NEM forms an ascending channel pattern with resistance at $45.6 and support at $42.2.
Ascending channel patterns are generally short-term bullish, but these patterns often form within longer-term downtrends as continuation patterns.
The short-term trading strategy is to trade LIFO about 45% of your position and keep a core long-term amount for a much higher payday.
I suggest selling between $45.3 and $46.5 with possible higher resistance at $47.4 and waiting for a retracement between $42.75 and $41.75 with possible lower support at $40.8.
Watch the gold price like a hawk.
Warning: The TA chart must be updated frequently to be relevant. It is what I am doing in my stock tracker. The chart above has a possible validity of about a week. Remember, the TA chart is a tool only to help you adopt the right strategy. It is not a way to foresee the future. No one and nothing can.
For further details see:
Newmont: Another Weak Production Quarter, Waiting For Newcrest Mining