AEM - Northern Star Resources: A Monster Q4 On Deck
2023-05-16 14:11:01 ET
Summary
- Northern Star Resources Limited released its fiscal Q3 results last month, reporting quarterly production of ~362,800 ounces at all-in sustaining costs of A$1,813/oz, translating to a decline in output at higher costs.
- The lower production was related to longer than planned shuts at several assets and ball mill motor damage at Pogo, which put a dent in throughput levels in the period.
- However, while cost guidance has increased, Northern Star expects to still deliver into its FY2023 output guidance range, and fiscal Q4 is set up to be a monster quarter.
- That said, I continue to see Northern Star as close to fully valued at a share price of US$9.15, with it trading at a premium valuation to AEM on a P/CF basis and just shy of 1.20x P/NAV which is above the multiple of some senior producers.
We're more than halfway through the Q1 Earnings Season for the VanEck Vectors Gold Miners ETF ( GDX ), and one of the first companies to report its results was Northern Star Resources Limited ( NESRF ). Unfortunately, NESRF's fiscal Q3 results weren't nearly as strong as some of its peers, with Northern Star reporting declining production at higher costs on a year-over-year basis. And while the gold price saved the day and offset any margin impact, net mine cash flow was also down despite near-record gold prices.
That said, the company has a monster fiscal Q4 on deck with implied gold sales of 460,000+ ounces at lower operating costs, and most of the issues that affected fiscal Q3 (CYQ1) results look to be resolved. Let's take a look at the recent results below:
All figures are in United States Dollars unless otherwise noted. Any conversions made from AUD/USD use a 0.68/1.0 Australian Dollar to US Dollar exchange rate.
Q3 Production & Sales
Northern Star released its fiscal Q3 (calendar year Q1) results last month, reporting quarterly production of ~362,800 ounces at all-in sustaining costs of A$1,813/oz. This translated to a 4% decline in output vs. the year-ago period at 9% higher costs, a disappointing headline figure in a year where Northern Star forecasted single-digit growth in gold sales with only a moderate increase in costs (A$1,660/oz guidance midpoint vs. A$1,633/oz in FY2022). That said, this was an abnormal quarter for the company, with extended mill downtime at KCGM following the major shut in January related to mechanical issues that are mostly resolved with only a small shut planned in the current quarter. Meanwhile, Pogo's fiscal Q3 throughput was affected by damage to the ball mill motor during a routine mill shut in March.
Fortunately, the Pogo team brought the plant back online in just three weeks at a cost of ~$1.0 million, well ahead of the six-week guided range provided in mid-March. And while this will lead to a 20,000 ounce plus impact in annual production, the team focused on waste development and building some stockpiles to set up a much better quarter in fiscal Q4 for the Alaskan asset. Finally, while the company's Yandal production center (Thunderbox, Jundee) performed well, the Thunderbox Plant also saw longer than planned mill downtime to work on design issues which are now mostly resolved. So, while grades were solid in fiscal Q3, these longer shuts dented quarterly production and unit costs.
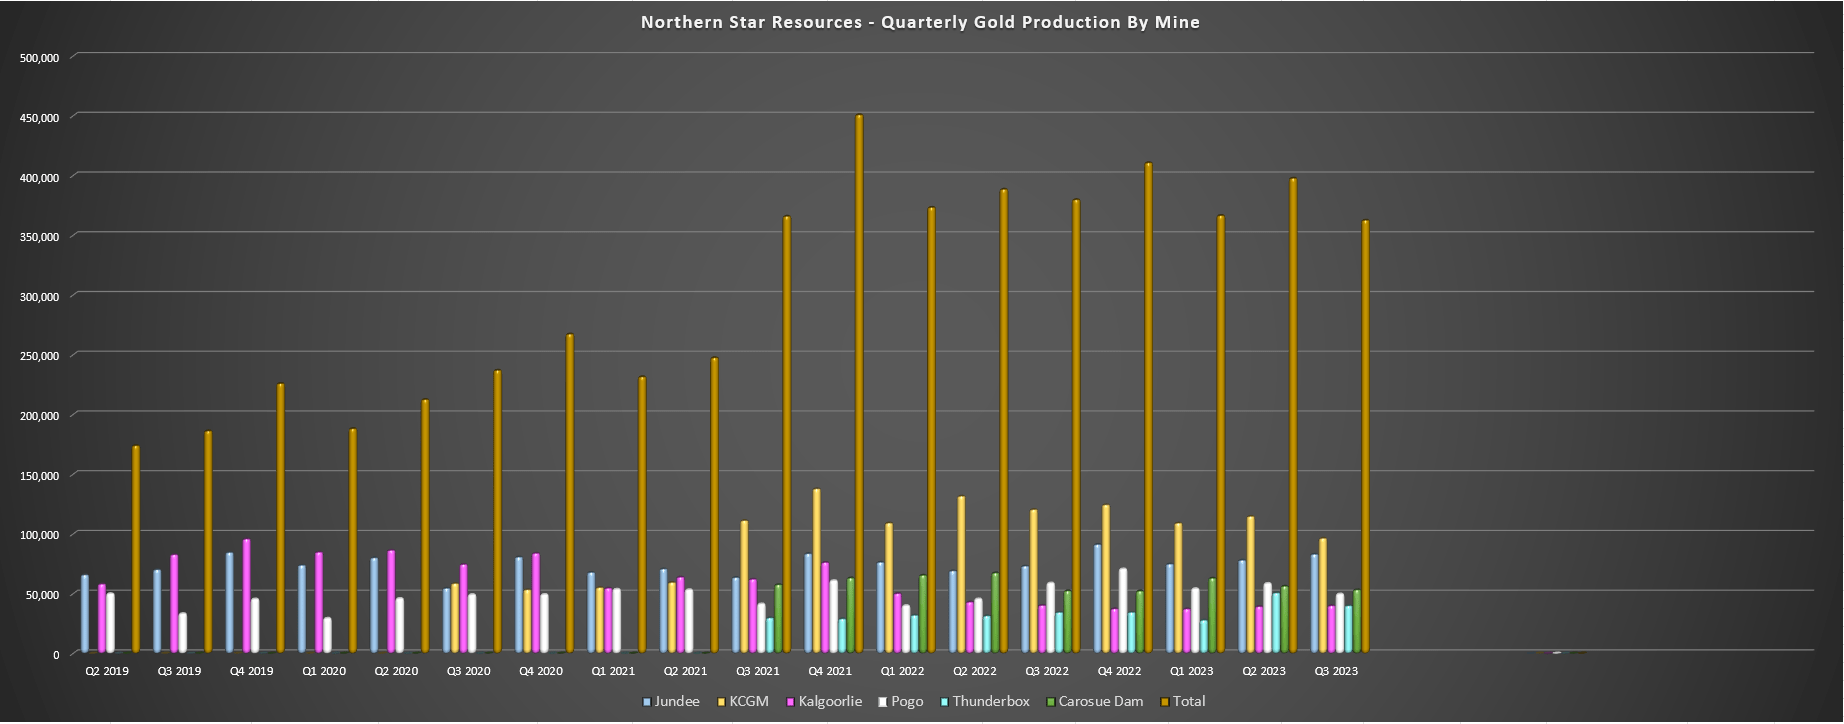
Digging into the operations a little closer, KCGM processed ~2.77 million tonnes at 1.3 grams per tonne of gold, down from ~3.15 million tonnes at 1.4 grams per tonne of gold in the year-ago period. This translated to production of ~96,500 ounces at A$1,720/oz vs. ~120,500 ounces of gold produced at A$1,432/oz in the year-ago period. During the quarter, material movement was below planned levels at 19.6 million tonnes due to shovel maintenance in January and February and longer hauls, but March rebounded to an annualized rate of ~83.0 million tonnes per annum. On the positive side, underground volumes increased materially to 527,600 tonnes at 1.9 grams per tonne of gold, a massive improvement from 344,600 tonnes in fiscal Q3 2022, and tracking towards the ultimate goal of 3.5 million tonnes per annum in FY2026.
Northern Star - Quarterly Production by Mine (Company Filings, Author's Chart)
Moving over to Carosue Dam, production was higher year-over-year (~53,300 ounces vs. ~52,400 ounces) with an increase in grades offsetting lower throughput, with ~812,500 tonnes processed at 2.2 grams per tonne of gold. And while all-in sustaining costs were higher at A$1,976/oz (fiscal Q3 2022: A$1,885/oz), the company noted that throughput was lower than planned because of extended downtime which affected output, but that the new Porphyry Underground is ahead of schedule and ore drive development has begun. Elsewhere, at Kalgoorlie, production was flat year-over-year at ~40,000 ounces.
Moving over to its Yandal production center, Jundee processed ~742,200 tonnes at 3.8 grams per tonne of gold, up from ~700,800 tonnes at 3.6 grams per tonne of gold in fiscal Q3 2022. This translated to a nearly 15% increase in output (~83,100 ounces) at industry-leading costs of A$1,367/oz [US$930/oz]. Meanwhile, Thunderbox processed ~1.09 million tonnes at 1.3 grams per tonne of gold, up materially vs. ~795,600 tonnes in the year-ago period. Unfortunately, grades were lower at 1.30 grams per tonne of gold which led to a less significant increase in output (~40,000 ounces vs. ~34,500 ounces) and higher unit costs of A$2,144/oz.
Pogo - Quarterly Production & Costs (Company Filings, Author's Chart)
Finally, at Pogo, it was a tough quarter with production of just ~49,800 ounces at $1,668/oz. This was a downgrade from the ~59,000 ounces produced at $1,483/oz in fiscal Q3 2022, and was related to lower tonnes milled at lower grades (~244,800 tonnes at 7.3 grams per tonne of gold). While this is disappointing, the mill was running well below the upgraded throughput capacity of ~1.3 million tonnes, which certainly affected production and unit costs because of the damage to the ball mill motor. Fortunately, this issue was resolved ahead of plans and the company remains confident that Pogo can see production of ~300,000 ounces per annum, which would make this a much lower-cost operation.
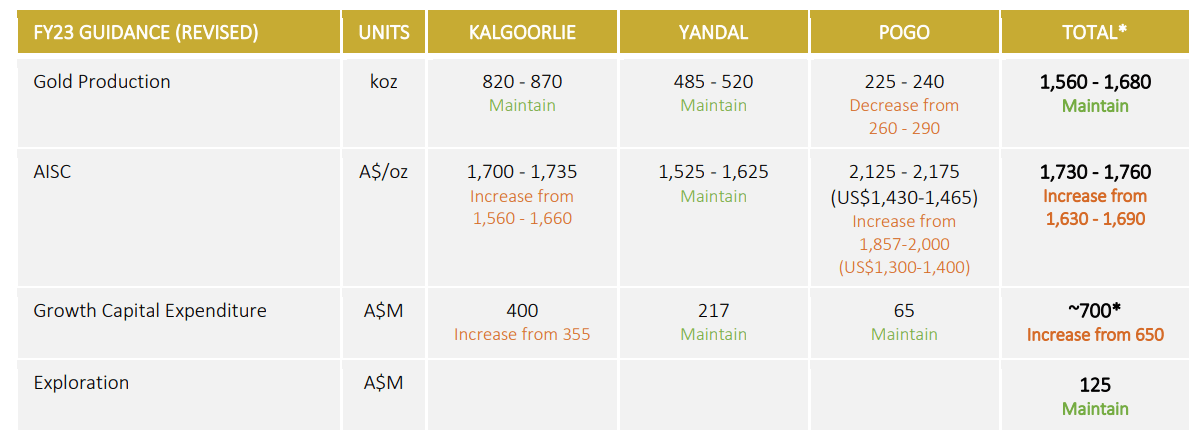
The result of the unplanned downtime at multiple operations is that although gold production has been maintained at 1.56 to 1.68 million ounces for FY2023, cost guidance was increased by 5% at the midpoint to A$1,745/oz [US$1,187/oz] vs. A$1,660/oz previously. That said, the gold price has offset some of this impact, and assuming an average realized gold price of A$2,630/oz and all-in sustaining costs of A$1,750/oz, Northern Star's margins will improve year-over-year from A$800/oz (FY2022) to A$880/oz, a 10% increase despite what was a disappointing fiscal Q3 performance. Plus, it's important to note that if Northern Star can execute on its 2.0 million ounce goal, we should see lower unit costs across the board, pointing to the potential for 2.0+ million ounces per annum in the back half of this decade at sub A$1,550/oz costs [US$1,055/oz].
Costs & Margins
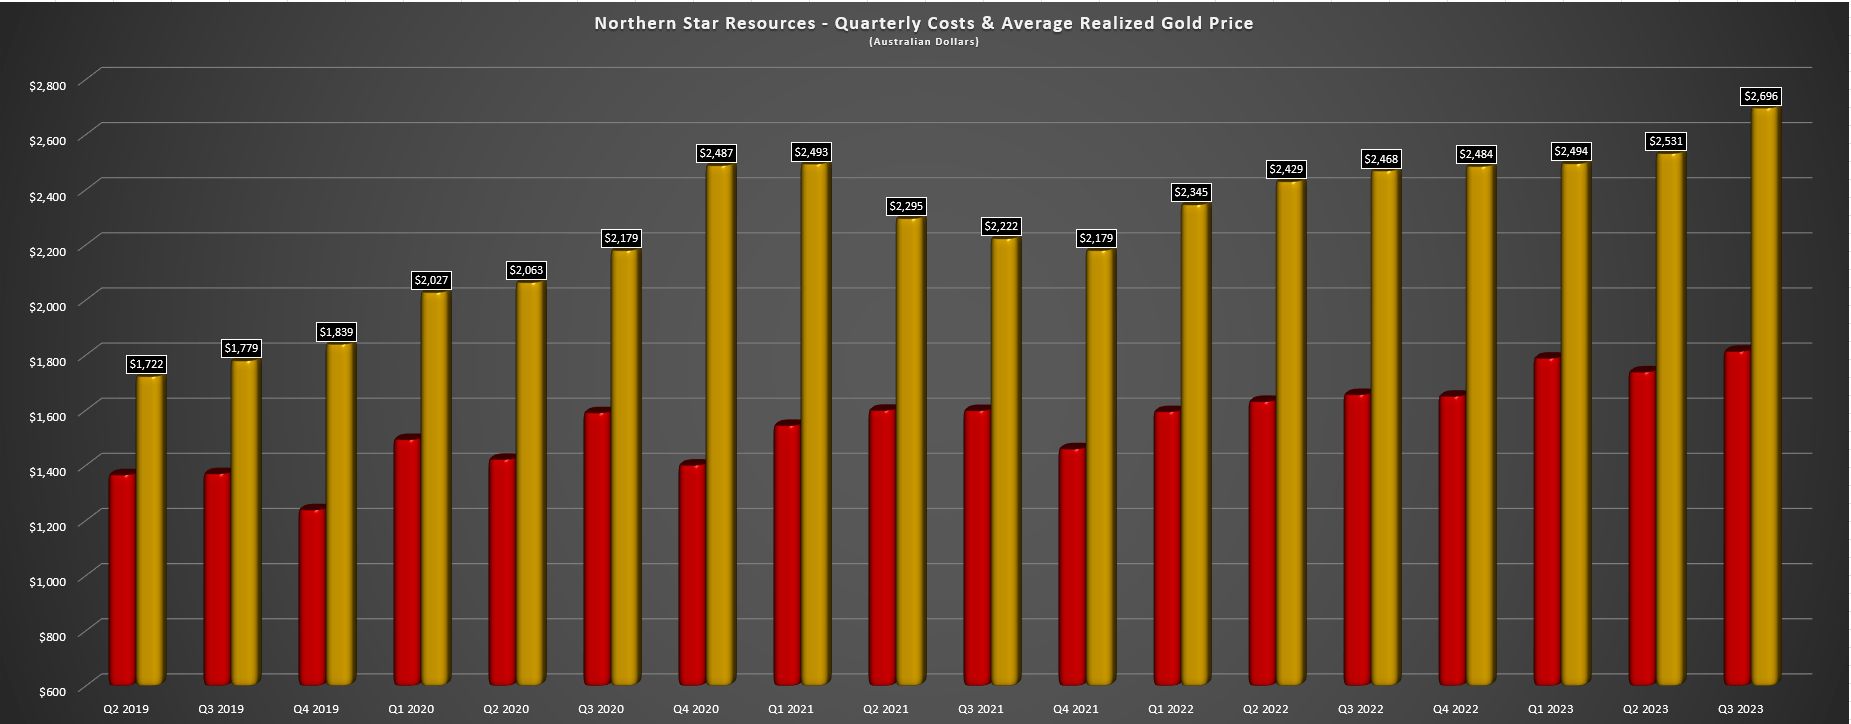
Looking at costs and margins from a quarterly standpoint, Northern Star's all-in sustaining costs came in at A$1,813/oz [US$1,233/oz] in fiscal Q3, a significant increase from A$1,656/oz in the year-ago period. However, despite the impact of delivering into hedging in the period (74,000 ounces), its average realized gold price came in at A$2,696/oz. This helped to offset any impact from a margin standpoint, with fiscal Q3 AISC margins of A$883/oz, up from A$812/oz in the year-ago period. That said, the company benefited from lower sustaining capital in the period, which came in at A$75 million vs. A$98 million in fiscal Q3 2022.
Northern Star - Quarterly AISC & Average Realized Gold Price (Company Filings, Author's Chart)
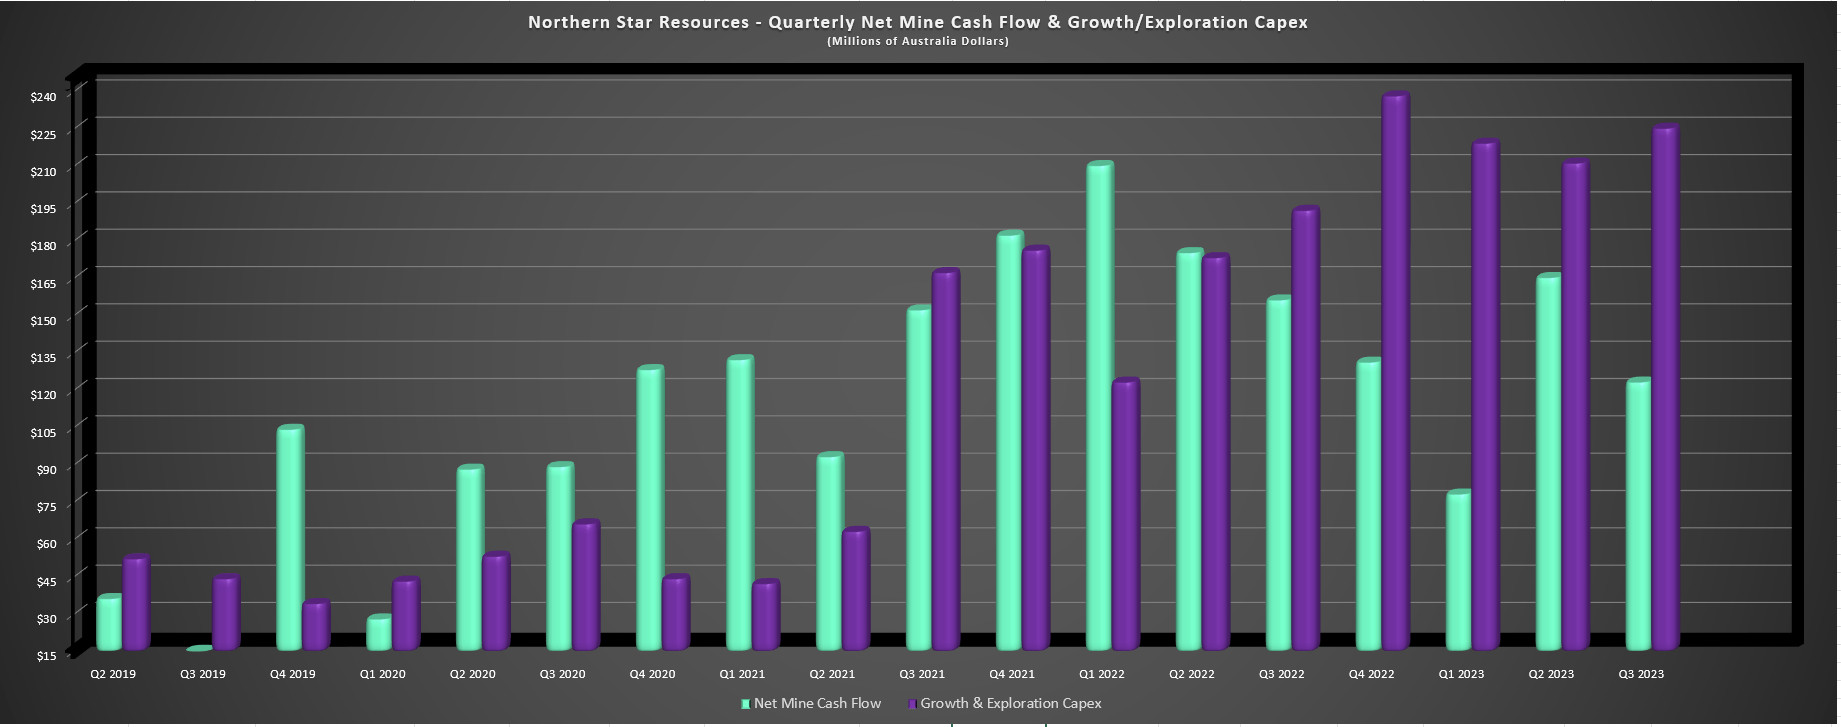
Moving over to the financial results, Northern Star generated net mine cash flow of A$123 million in fiscal Q3, a 21% decline from A$156 million in fiscal Q3 2022. The decline was related to increased growth capital in the period (A$191 million vs. A$166 million), and Northern Star's growth capital budget has been increased to A$700 million this year due to increased waste volumes at KCGM. And while this may not be the results some investors were looking for in a quarter with a near-record gold price, we should see a material improvement in its financial results in fiscal Q4, with gold sales expected to come in north of 460,000 ounces at operating costs below year-to-date levels. Let's look at Northern Star's valuation below following this period of significant share-price outperformance:
Northern Star - Quarterly Net Mine Cash Flow & Growth/Exploration Capex (Company Filings, Author's Chart)
Valuation & Technical Picture
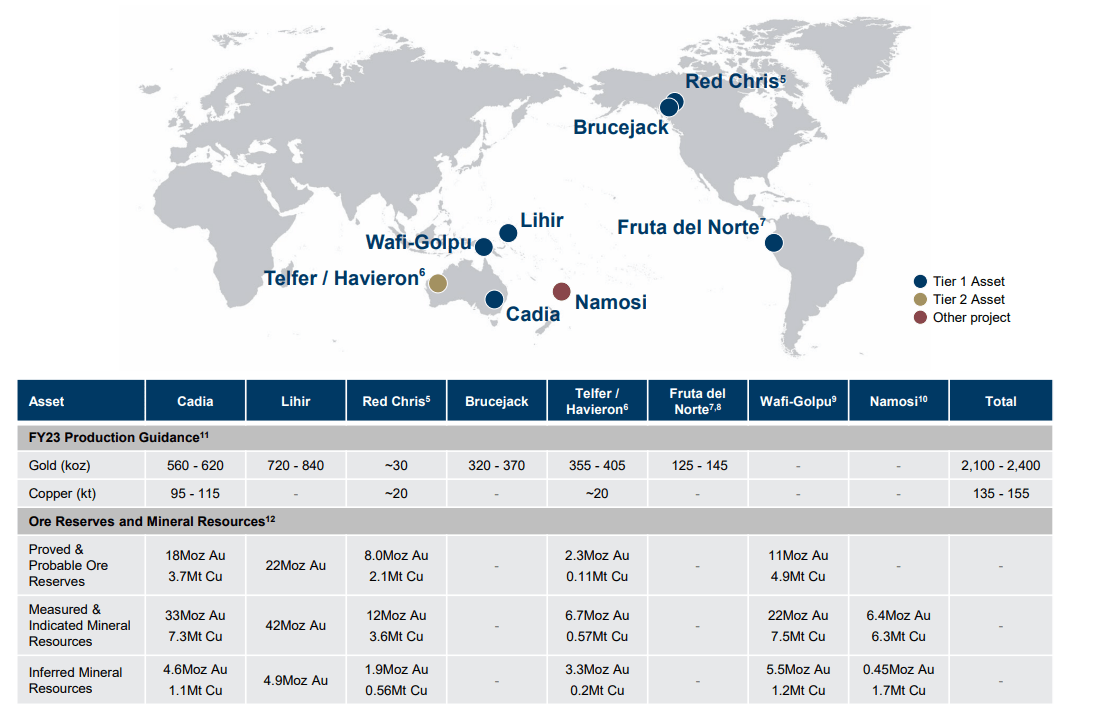
Based on ~1161 million fully diluted shares and a share price of US$8.20, Northern Star trades at an enterprise value of US$9.52 billion. This is a significant premium to similar-sized producers like Endeavour Mining ( EDVMF ) and Kinross Gold ( KGC ), but neither company are great comparisons given Northern Star's unique position as a solely Tier-1 jurisdiction producer operating out of Western Australia and Alaska. And while Northern Star's margins may not be in the same league as that of Newcrest Mining Limited ( NCMGF ) and does not have the same scale (~1.6 million ounces vs. ~2.8 million gold-equivalent ounces), Newmont Corporation ( NEM ) has offered to pay ~$19.6 billion for Newcrest despite one-third of production coming from a Tier-2 ranked jurisdiction (Papua New Guinea), implying a fair value for Northern Star of at least US$10.0 billion.
Newcrest Portfolio - Newmont Acquisition (Newcrest Presentation)
Looking at Northern Star's valuation from a cash flow and P/NAV standpoint, the company is on track to generate ~$900 million in operating cash flow this year, leaving the stock trading at a cash flow multiple of ~10.6x, a premium to Agnico Eagle Mines Limited ( AEM ) which has a larger scale (~3.4 million ounces vs. ~1.6 million ounces) and better margins. Meanwhile, from a P/NAV standpoint, Northern trades at a large premium to its estimated net asset value of ~$8.2 billion, leaving it trading at close to ~1.20x P/NAV. So, using what I believe to be a fair multiple of 10.0x cash flow and 1.30x P/NAV, I see Northern Star Resources Limited stock as close to fully valued here, with a fair value closer to US$9.50, pointing to less than 10% upside from current levels.
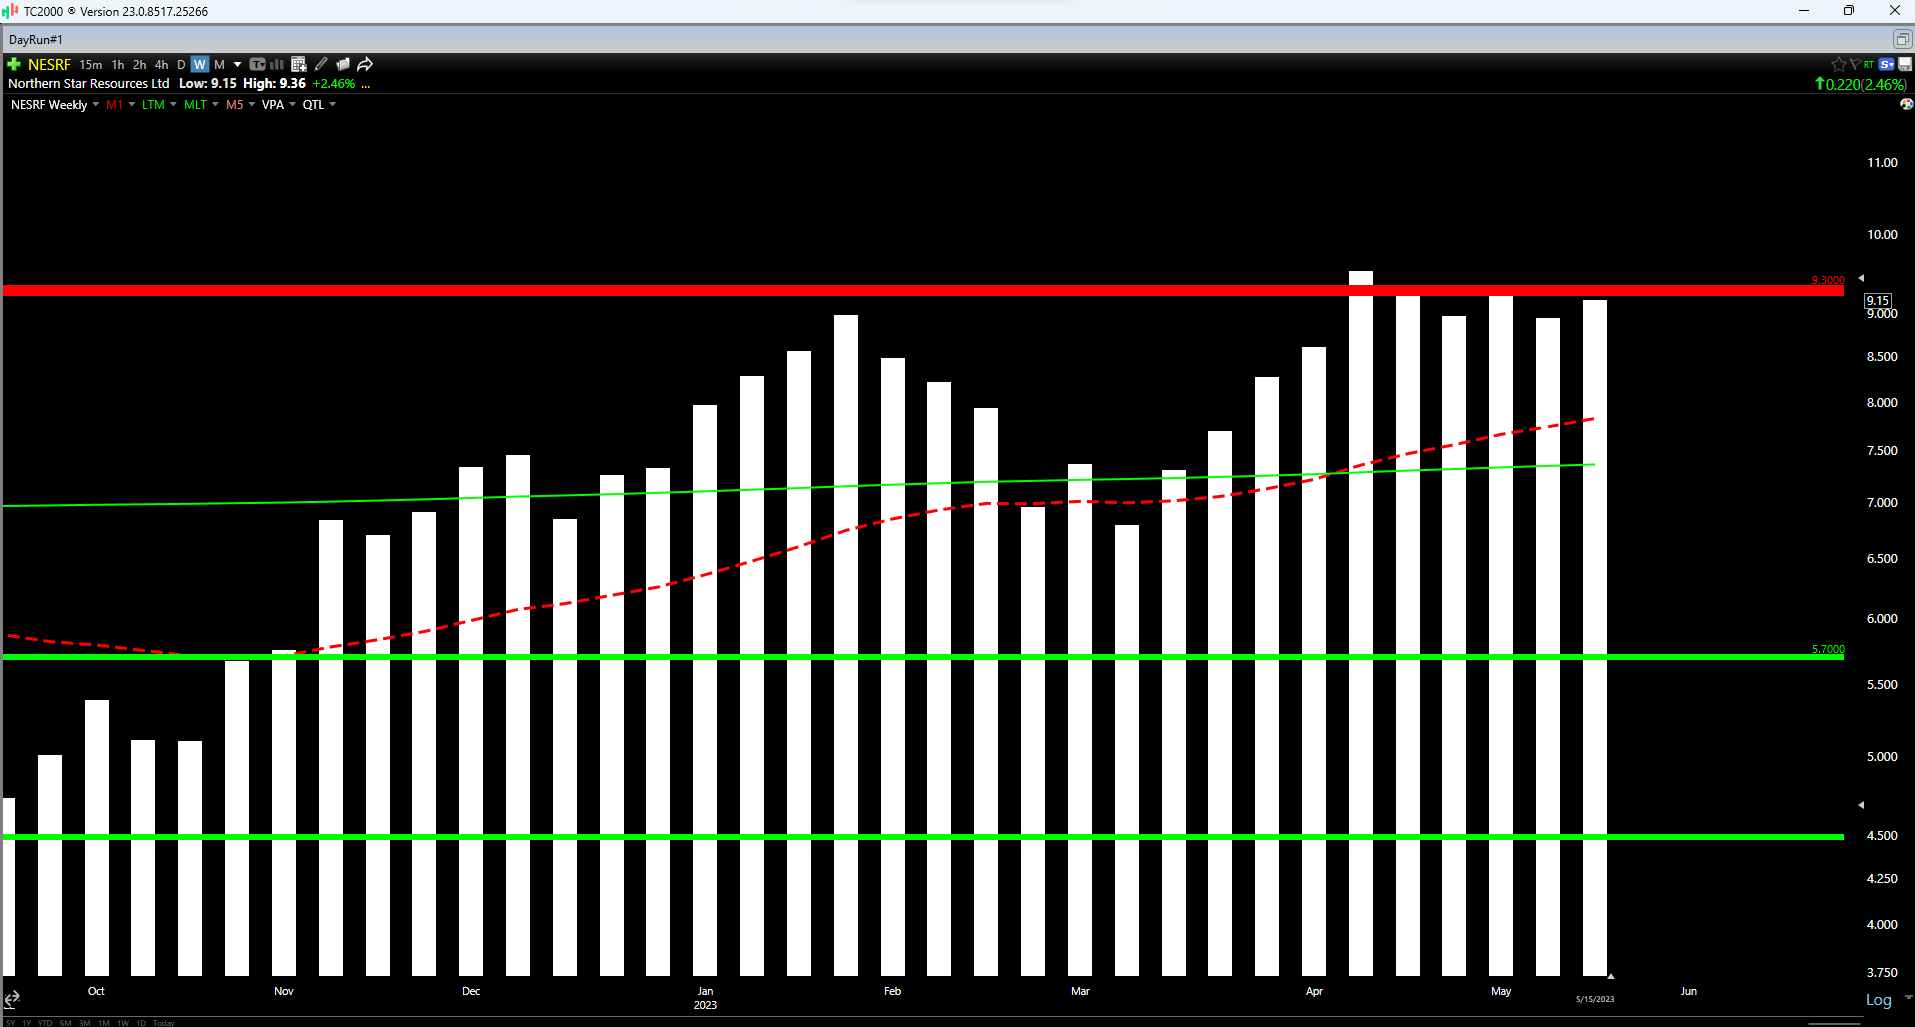
Moving to the technical picture, Northern Star continues to hug resistance at the US$9.30 level and its next strong support level doesn't come in until US$5.70. This doesn't mean that the stock has to pull back sharply from here and a rising tide (gold price) typically lifts most boats. That said, the reward/risk ratio has deteriorated to less than 0.10 to 1.0 from a current share price of US$9.15, suggesting that this is not a low-risk buying opportunity and it's instead an opportunity to think about booking some profits. So, while I see Northern Star as one of the top-3 Australian producers from a quality standpoint, I don't see any reason to pay up for the stock above US$9.15.
Summary
Northern Star Resources Limited has successfully reduced its share count with opportunistic share repurchases and continues to execute on a growth plan that targets 2.0+ million ounces of production later this decade with a focus on quality ounces vs. quantity. And while fiscal Q3 wasn't the best quarter because of unplanned mill downtime at several assets, fiscal should be a monster quarter with the additional benefit of near-record gold prices.
That said, the time to buy Northern Star Resources Limited stock was below US$6.00 when no one wanted to own it, not after it's already rallied over 100% off its October lows. So, while I plan to watch Northern Star Resources Limited stock closely if we see sharp pullbacks, I see better opportunities elsewhere in the sector currently from a reward/risk standpoint.
For further details see:
Northern Star Resources: A Monster Q4 On Deck