ONL - Office REITs: It's All About The Commute
2023-09-07 11:00:00 ET
Summary
- The battered Office REIT sector has been the top-performing sector since June, lifted by a decent slate of earnings reports and recent indications that the long-awaited "Return-to-Office" is gathering momentum.
- Zoom - the "poster-child" of the Work-From-Home Era - became the latest high-profile company to implement a "RTO mandate" as cooling labor markets appear to be emboldening corporate decision-makers.
- The office outlook isn't as bad as market pricing reflects, but it's not necessarily good either, particularly for the highly-levered players and those focused in markets with long transit-heavy commutes.
- It's all about the commute: Work From Home ("WFH") is ultimately an 'economic' decision and several major markets (SF, NYC, CHI, DC) have an unavoidable structural issue: it takes too long to get to work - largely a byproduct of decades of bad housing policy and urban planning.
- Coastal-focused office REITs are no longer trading at deep discounts, but these discounts are still available for a handful of Sunbelt-focused REITs, which are well-positioned in markets with net population growth, shorter commute times, and a more favorable industry mix for the WFH era.
REIT Rankings: Office
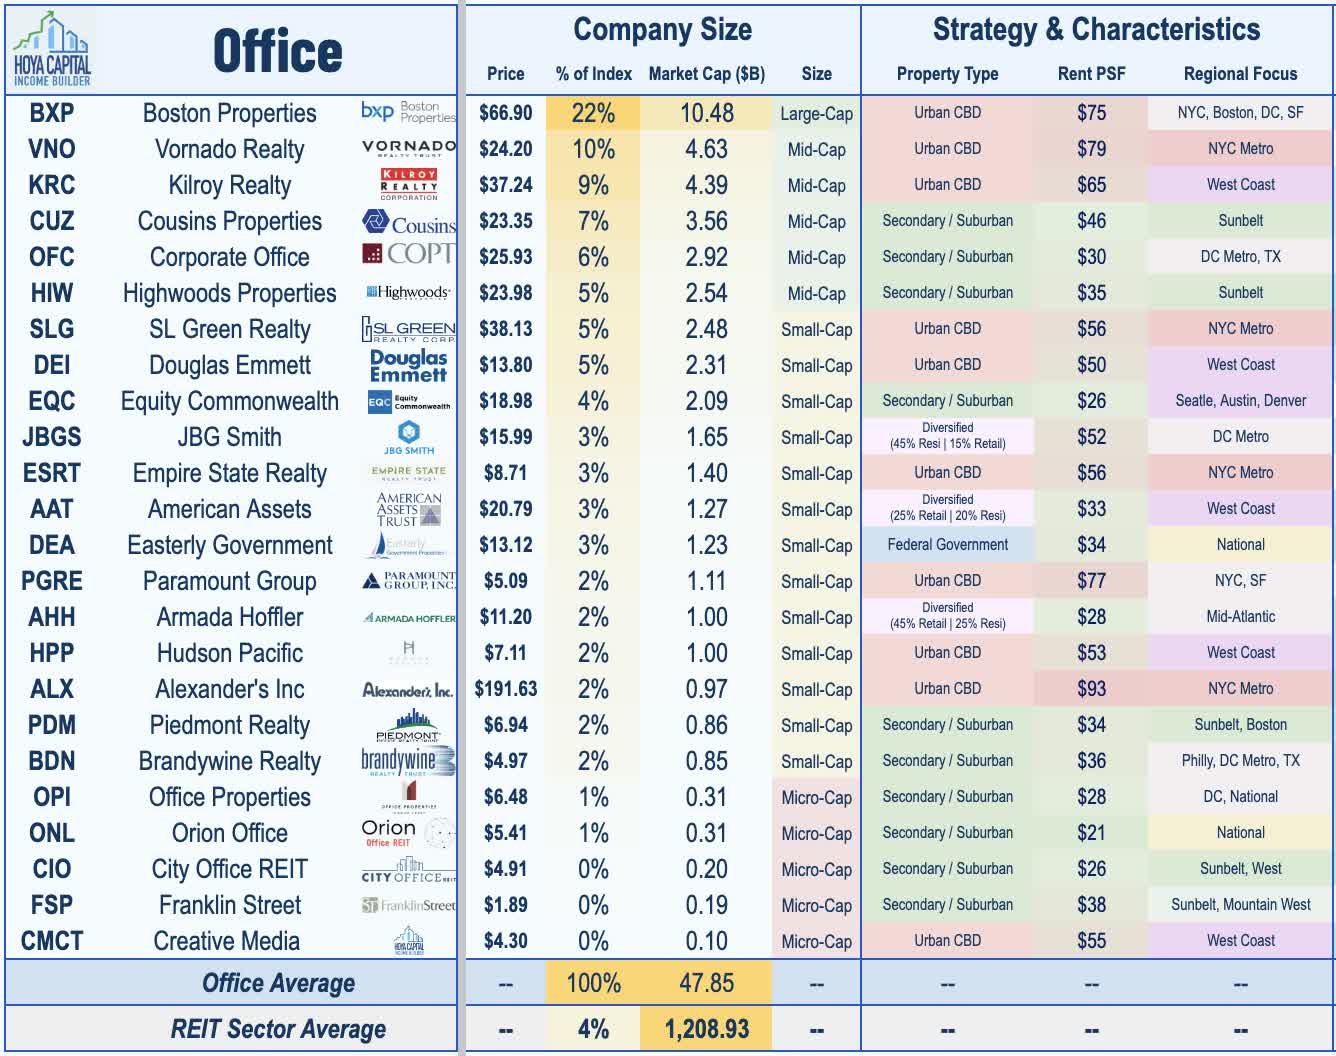
Office REITs have been the worst-performing property sector since the start of the pandemic, as chronically depressed utilization rates have significantly curbed office space demand, but the sector has shown signs of life over the past quarter following a relatively decent slate of earnings reports and recent indications that "Return to Office" has gathered steam as labor markets weaken, underscored by the ironic "RTO mandate" from Zoom , the "poster child" of Work From Home. Despite the rebound - which has been fueled largely by Coastal-focused REITs - Office REITs are still trading at historically deep discounts to peers in public and private markets, which begs the question - how much pain is priced in? Within the Hoya Capital Office REIT Index , we track the 23 office REITs, which account for roughly $50 billion in market value and comprise 5% of the market-cap-weighted REIT Indexes.
The office sector is typically segmented into two categories. Urban CBD ("Central Business District") or ' Gateway' REITs hold portfolios that are concentrated in the six largest U.S. cities: New York City, Chicago, Boston, Los Angeles, San Francisco, and Washington, D.C., a segment that has been hit especially hard by the pandemic. Secondary/ Suburban REITs , which have generally outperformed throughout the pandemic, hold portfolios concentrated in the Sunbelt regions and/or in secondary markets. As we'll discuss throughout this report, we believe that the longer-term outlook remains far "sunnier" in the Sunbelt and in secondary market. Since early in the pandemic, we've discussed the importance of commute times - understanding that Work From Home ("WFH") is ultimately an 'economic' decision and that several major markets have an unavoidable structural issue: it takes too long to get to work - largely a byproduct of decades of bad housing policy and centralized urban planning which have distorted market-based resource allocation.
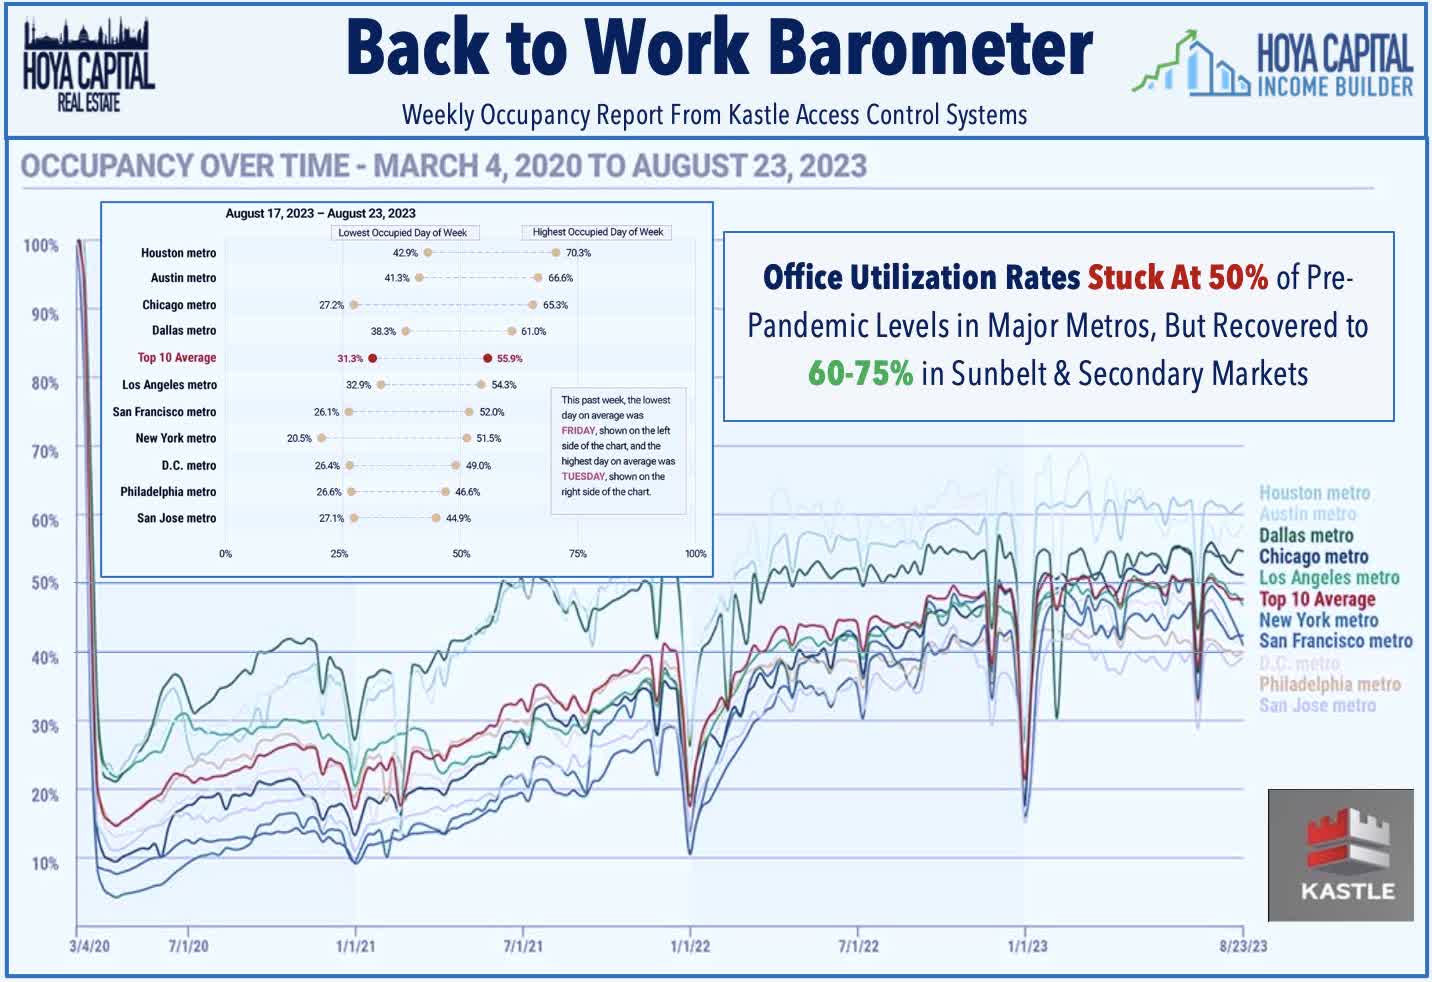
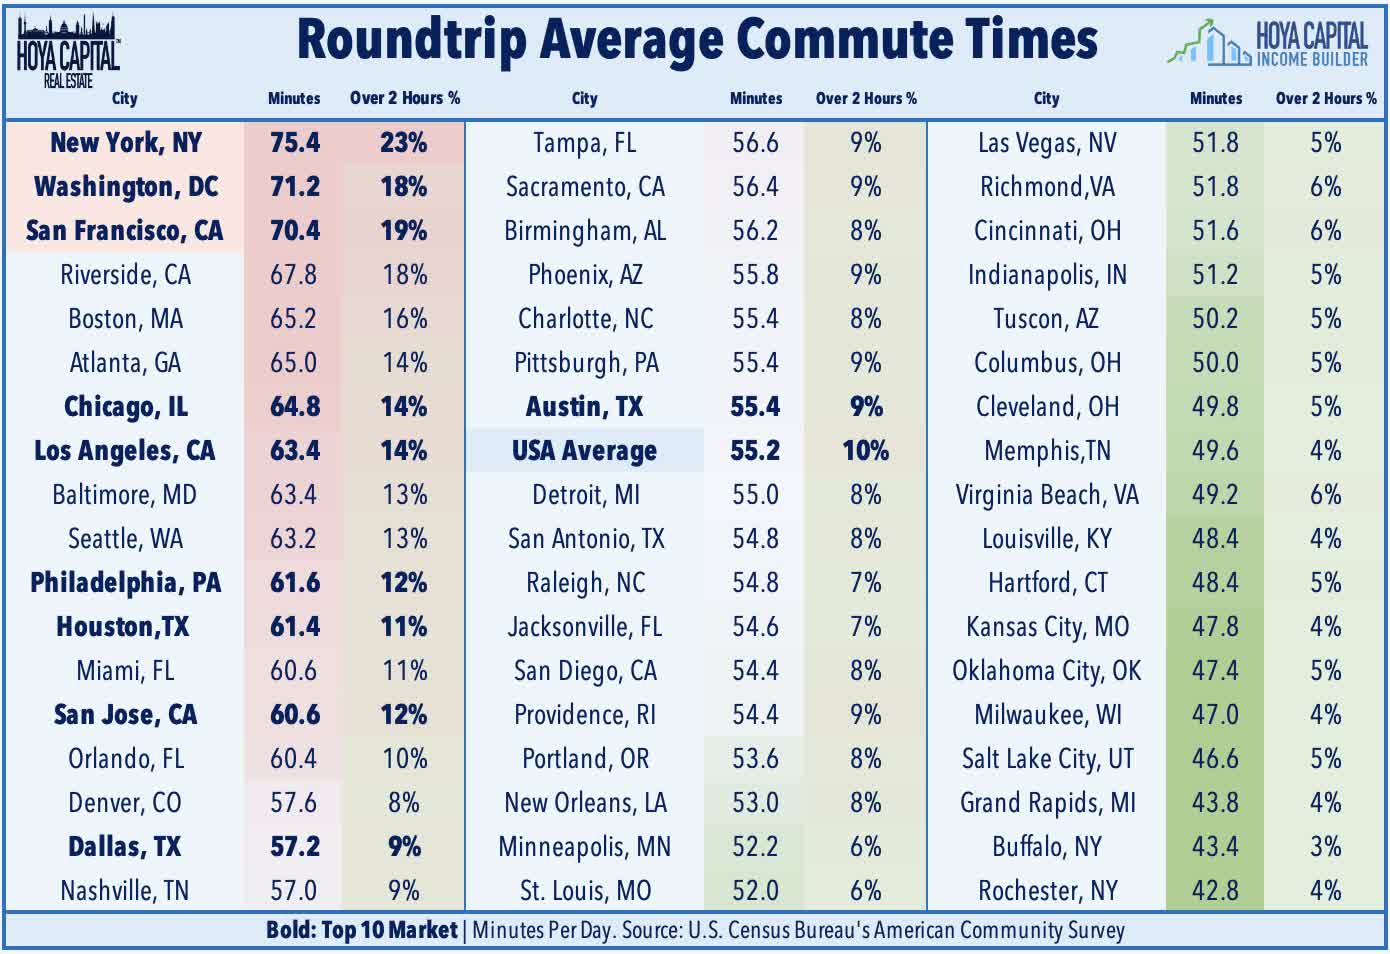
As expected, markets with these long, transit-heavy average commutes (notably: San Francisco, DC, NYC, and Chicago) have seen utilization rates hover below 50%, while secondary and Sunbelt markets with one-way commutes of under 30 minutes are seeing 75%+ office utilization. According to recent data from Kastle Systems, office utilization has hovered around 50% nationally since January. While utilization rates remained at 50% or below in all of the major coastal urban markets, most Sunbelt and secondary markets have seen materially higher utilization rates throughout the pandemic, with Austin and Houston seeing mid-week occupancy rates around 70% or above. Outliers within this regional dichotomy have been Los Angeles on the upside - which has posted relatively solid utilization rates compared with other California markets - and Atlanta on the downside - which has seen weaker utilization rates, each consistent with the theory that it's commute times that are the driving force of utilization rates.
Based on recent survey data discussed in more detail below, we believe the ultimate post-pandemic “trend level” of utilization rates is around 60% of pre-pandemic levels in primary urban metros - up from roughly 45% today, implying a 3-day/week average in-person attendance. In secondary markets where the economic benefits of in-office attendance are more likely to outweigh the costs, utilization rates will be closer to 80% - up from roughly 60% today, implying a 4-day average workweek. We believe that this final 20% of upside utilization will be unlocked as labor markets finally begin to materially loosen, and we have indeed seen more companies use office “mandates” as part of their workforce reduction strategies, including the most recent notable example from Zoom ( ZM ), which sent a memo to employees detailing a new "hybrid" approach to WFH whereby employees who live near a Zoom location must be on-site at least two days per week, a move that comes alongside a recently-announced workforce reduction, consistent with the theory that office utilization rates will actually improve as job growth cools and as workers yield some negotiating leverage.
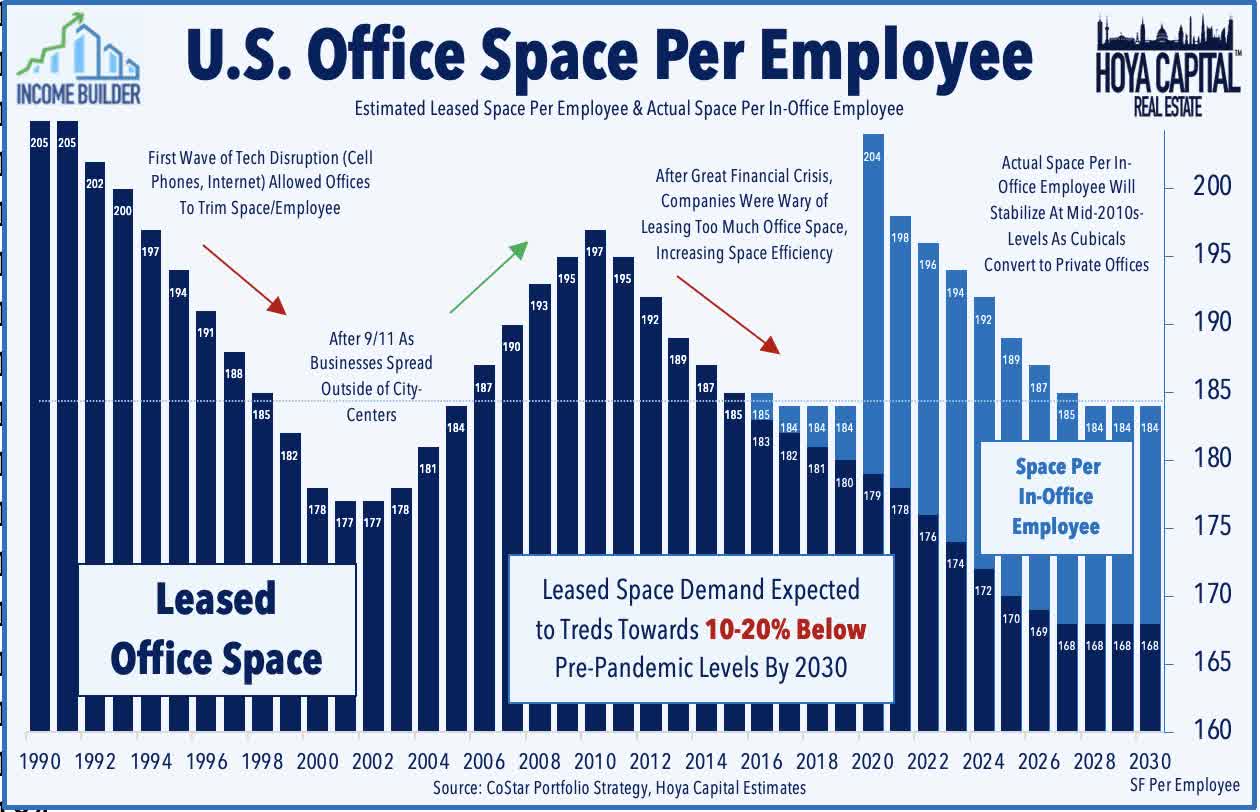
We believe that employers will seek to trim only about half of this incremental “unused” space in their next renewals, implying about a 15-25% reduction in “same company” demand in primary urban metros and 5-10% in secondary markets – which is likely quite a bit more optimistic for office demand than implied by office REIT valuations, which appear to imply cuts that match the lower utilization rates on a 1-for-1 basis. What’s overlooked is that we’re not too far removed from the GFC period which saw substantial cuts in excess office square footage from 2008-2011 and a decade-long trend towards a higher office “utilization factor”- in other words, jamming more employees into the same square footage with the often-loathed open floor plans. There simply wasn’t a huge glut of under-utilized office space before the pandemic, and we believe that employers will be content with some modest space reductions while offering more space per in-office employee through build-outs that include more private office space and fewer open floors and cubicles.
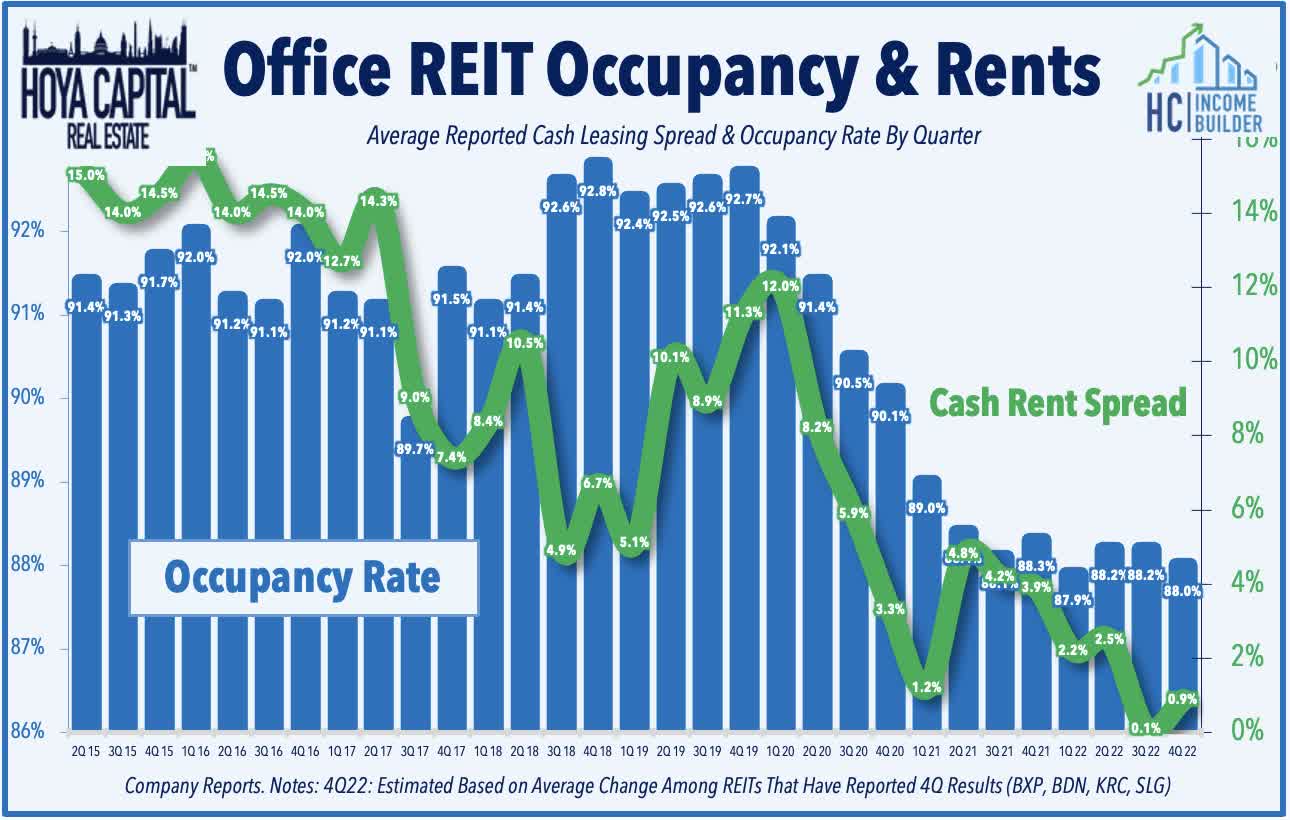
Our overall view remains consistent: The office outlook is not as bad as market pricing reflects - but it's not necessarily good either, particularly for the highly-levered players in the space (which is the majority of the private owners, but a smaller percentage of the public REITs.) The "higher for longer" rate environment turned a weak-but-manageable situation into a bleak one for these debt-dependent portfolios, but there is more nuance than what the prevailing narrative would suggest. Despite sub-50% utilization rates of office space in some major markets, property-level cash flows are still not the problem. Remarkably, same-store NOI for the average office REIT was 10% above pre-pandemic levels in Q2 as occupancy rates have only declined 3% from pre-pandemic levels so far - albeit on a clear downward trajectory - which has been more-than-offset by higher asking rents. Ignoring the future outlook for a moment, property-level fundamentals (so far) look more like a typical recession than the "collapse" that the prevailing narrative suggests.
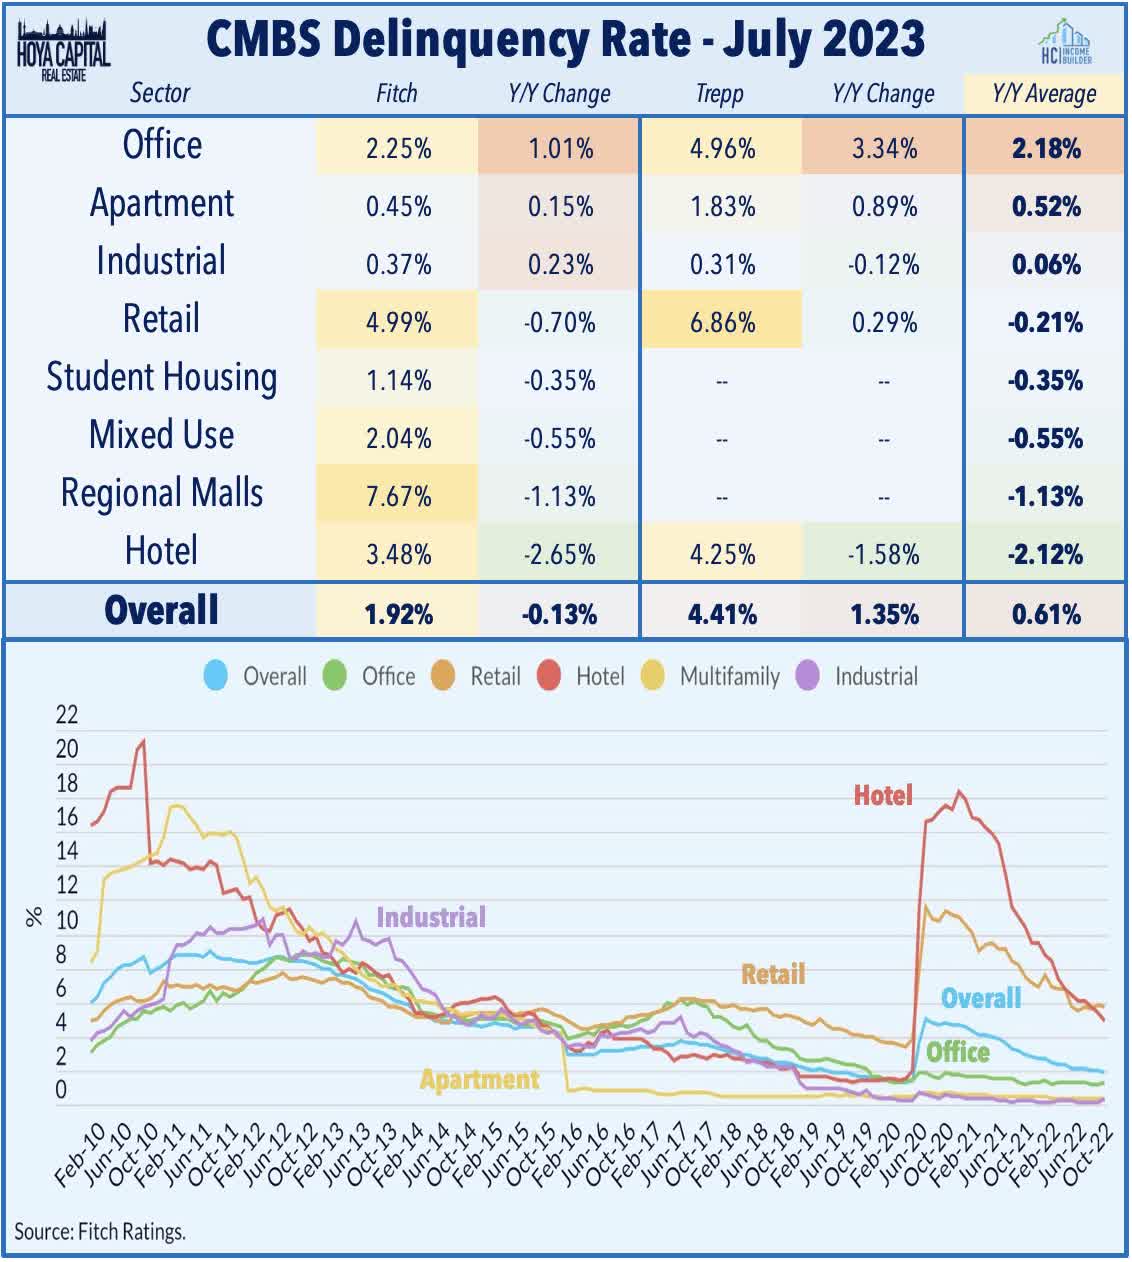
A theme that is not unique to the office sector, debt service expenses have been the primary culprit behind the wave of recent loan defaults from private equity firms such as Brookfield ( BAM ), Blackstone ( BX ), Pimco, and RXR . These private equity owners typically operate with loan-to-values in the 60-70% range and have witnessed their equity in office assets effectively diminish due to the approximately 25% decline in appraised office valuations. Faced with interest expenses three times higher than a year ago, these owners have chosen to return the keys to the bank. Recent Mortgage Bankers Association data shows that roughly a third of commercial mortgages mature by the end of 2024 - a relatively manageable sum for the broader real estate sector - but the clock is ticking for the firms sitting on a significant pool of variable rate debt, and it's beginning to show-up in delinquency rates. Trepp reported this month that office delinquencies rose another 46 basis points to 4.96%, which is up sharply from just 1.63% a year ago.
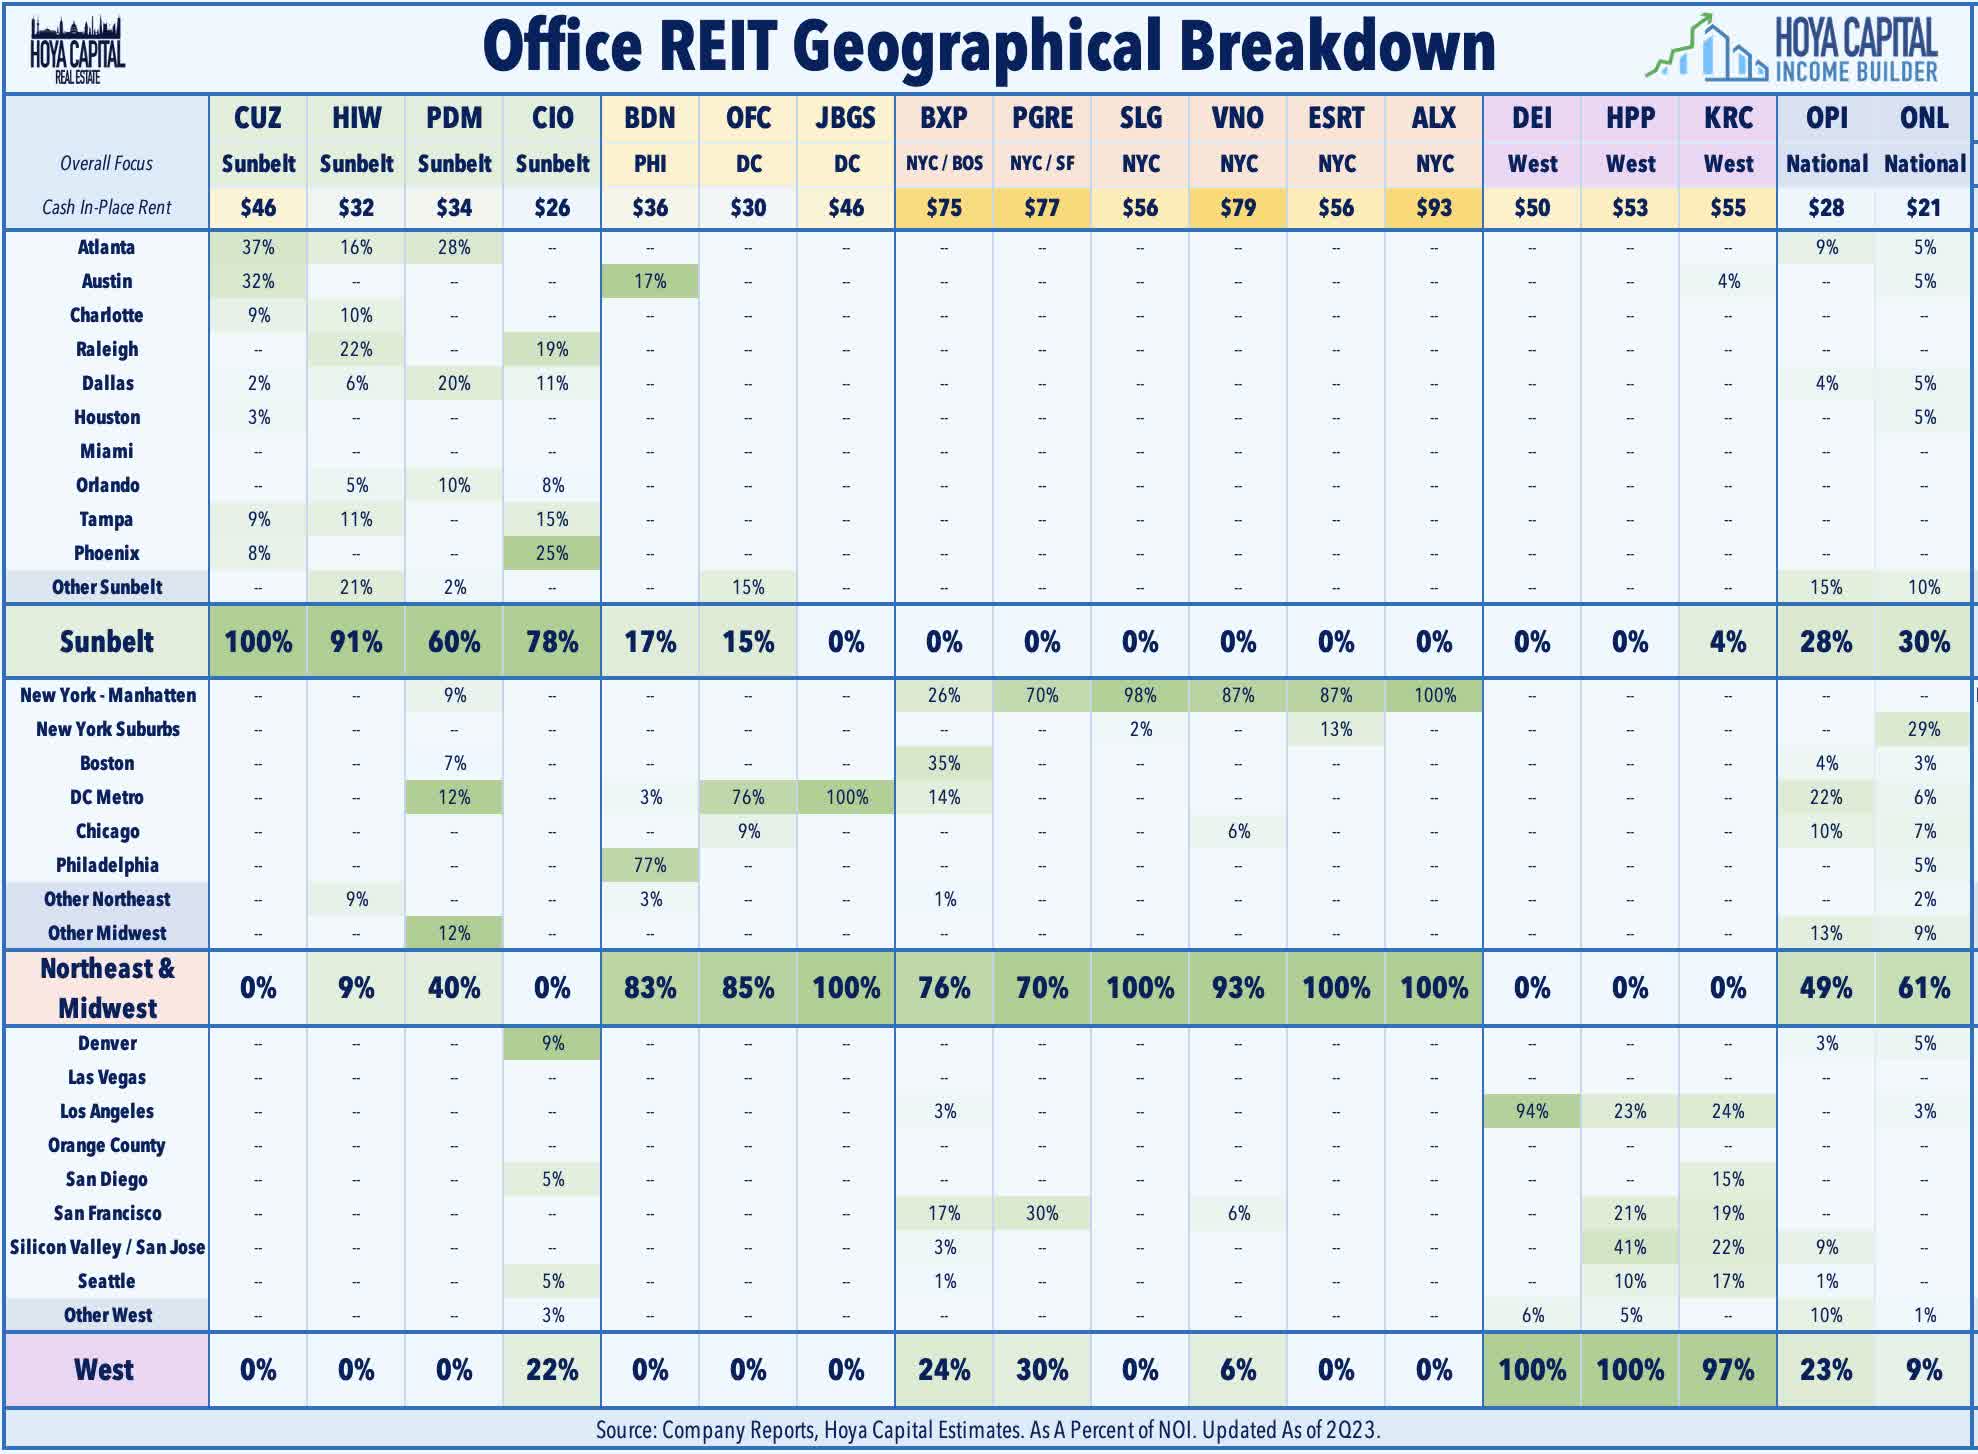
A theme we'll discuss throughout this report, the structural market-by-market differences are substantial - and seemingly overlooked by the market - with true lingering "pain" seen in markets with long, transit-heavy commutes, while markets with sub-30 minute commutes - generally seen in Sunbelt and Secondary markets - are seeing conditions that are soft but not necessarily bleak. Sunbelt-focused REITs achieved leasing volumes that were just 5% below 2019 levels over the past four quarters vs. the 25% average decline for coastal-focused REITs - a performance spread that has actually widened in recent quarters, even as stock performance trends would imply otherwise. Bottom line - Coastal-focused office REITs are no longer trading at deep discounts following their 25%+ rally over the past quarter, but these deep discounts are still very much available for a handful of Sunbelt-focused REITs, which are well-positioned in markets with net population growth, shorter commute times, and a more favorable industry mix for the WFH era.
Where Will Utilization Rates Stabilize?
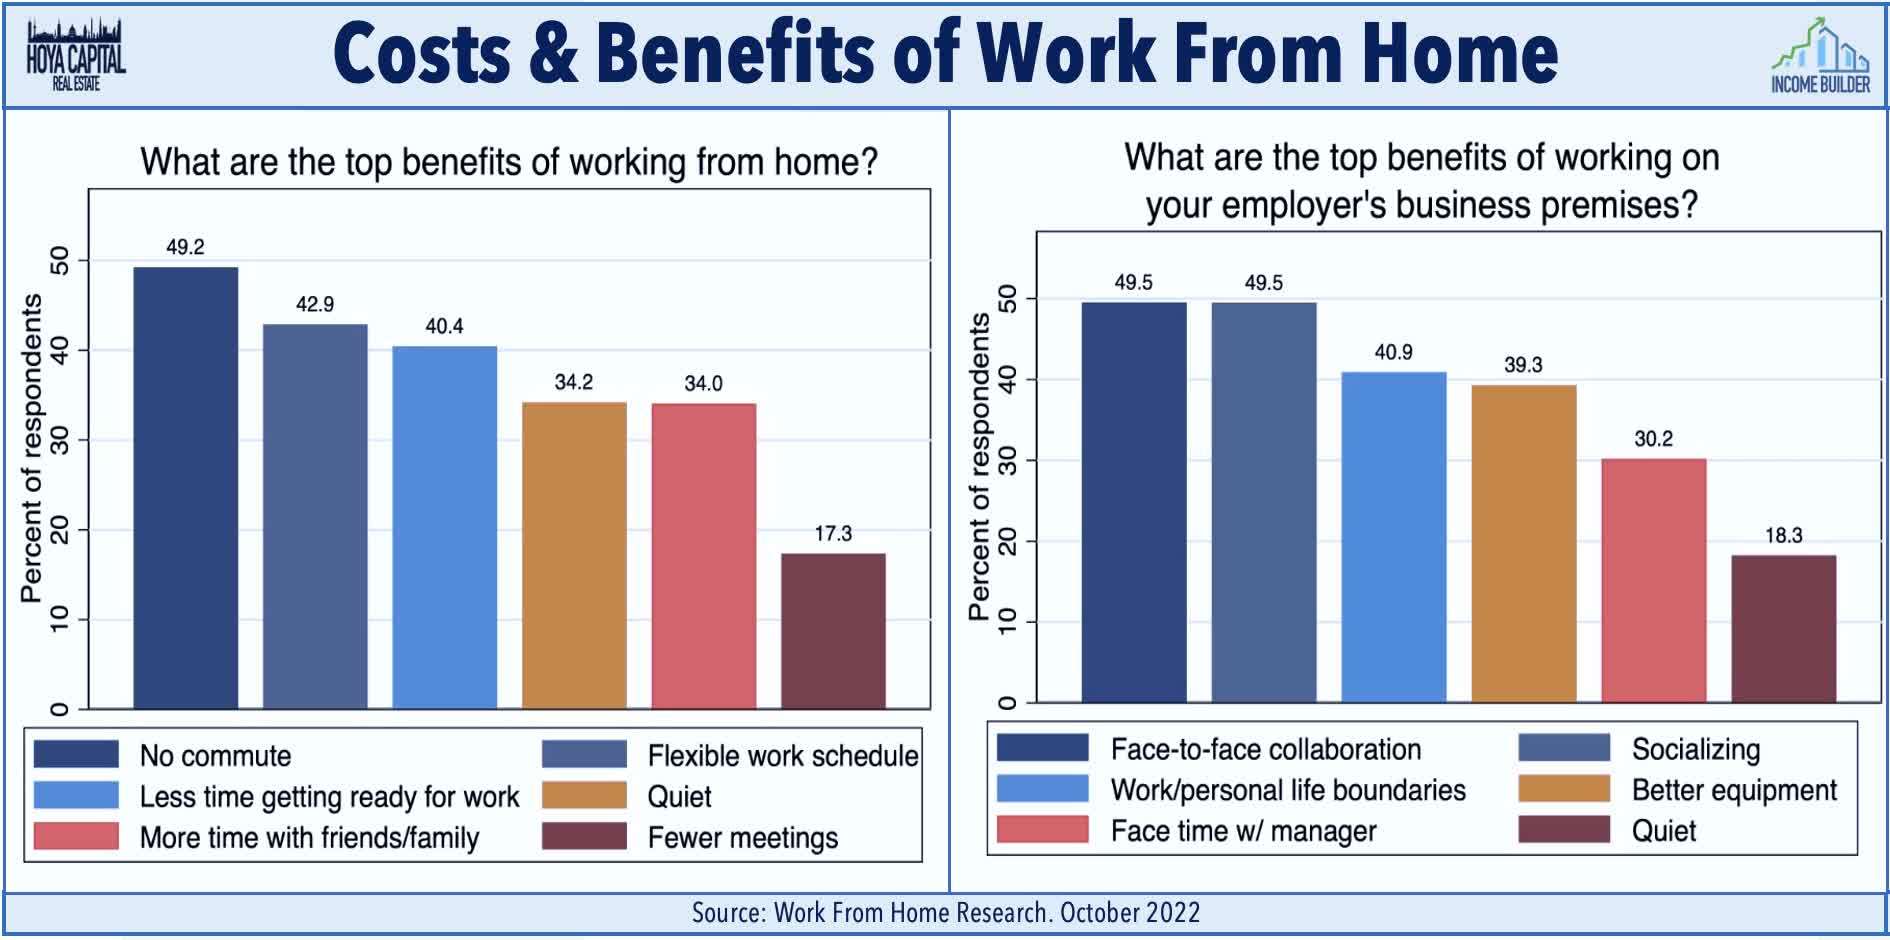
Recently-updated data from the American Community Survey show that over the course of a 5-day work week, remote work employees in cities with particularly brutal commutes "save" an average of 6.5 hours per week and a hundred dollars in transportation costs. Recent surveys from WFH Research confirmed that the lack of a commute is far and away the top benefit of working from home. The survey found that WFH saved office workers an average of 70 minutes per day, of which 40% was reallocated toward work. That “bonus” time allocated towards work seems to explain all of the reported productivity gains of WFH found across most surveys – offsetting the drag from a generally less productive home environment compared to the office.
Importantly, survey data continues to show that the office isn't necessarily the problem - it's the commute - and there's a growing consensus that there are quantifiable "costs" of remote work which can accumulate over time if not at least augmented by some non-virtual between employees and clients. A recent Hogan survey noted that employees cited challenges with collaboration (36%), distractions at home (25%), and difficulty with motivation (16%) as the top challenges of the fully-remote environment and a consistently small share of employees want to do away with the office entirely - averaging 10-20% across most surveys - with younger people itching to get back to the office at rates nearly twice that of older cohorts. A recent survey from KPMG found that less than one in five workers would prefer to be fully remote.
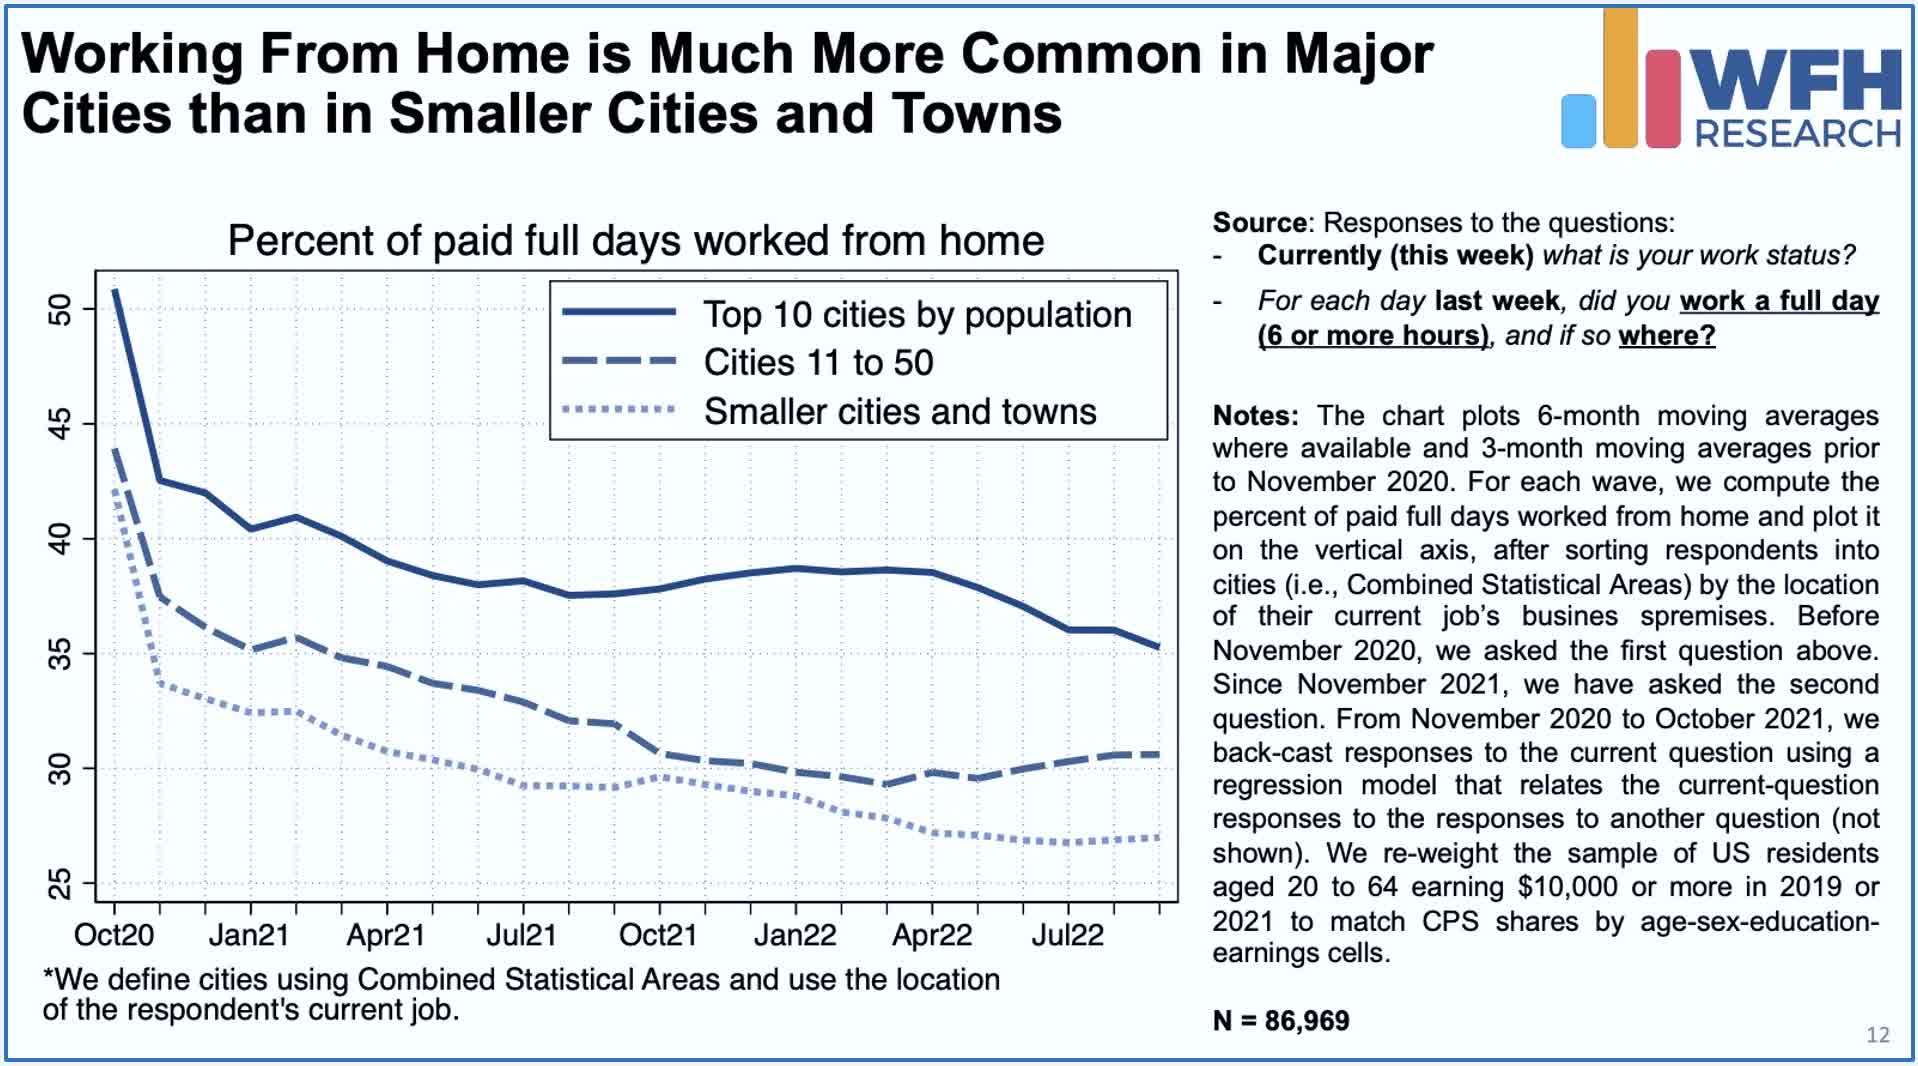
Consistent with this framework, in markets with shorter average commutes, the productivity and social benefit of the office environment are "worth" the commute time. In fact, Work From Home adoption remains primarily a ‘Big City’ trend with a near-linear correlation between the size of the market and the WFH rates. Industry and tenant mix has also become an increasingly important factor that explains the variance in office utilization rates and also captures some of the effects of commute times. Certain industries are far more WFH-friendly than others, particularly the technology and financial services industries, where WFH Research finds that employers expect just 2.2 to 2.5 office days per employee per week under their post-COVID plans. These office utilization rates are roughly half that of other office-using industries that expect their employees to report to the office 3-4 times per week.
Office Sector Fundamentals & REIT Earnings
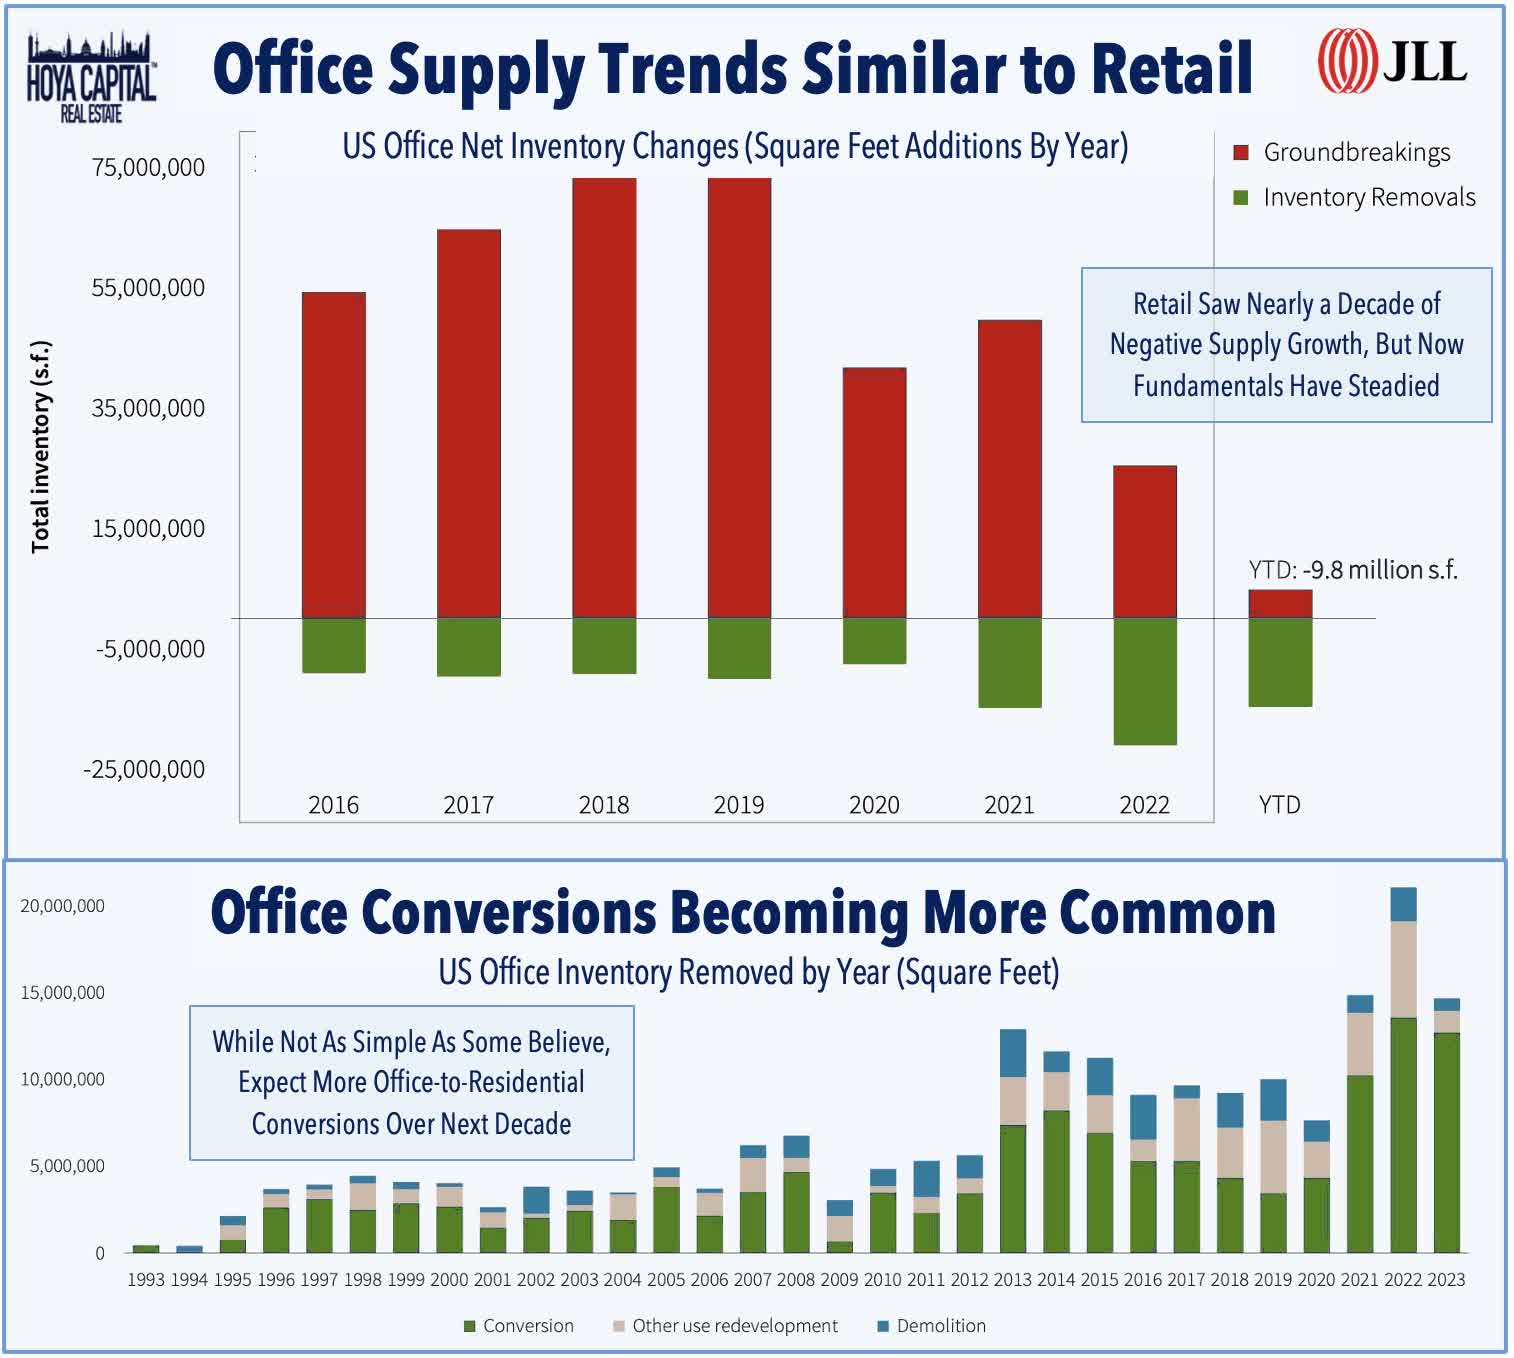
Corporate decision-makers have generally remained hesitant to make major strategic decisions to dramatically reduce their office footprints, but it's apparent that corporations won't pay full price for half-empty space indefinitely. With utilization rates hovering around 50% nationally, JLL Research noted in their recent Office Report that leasing activity has hovered around 75% of pre-pandemic levels nationally since early 2021 (better in Sunbelt markets compared to Coastal markets) and posted a sequential increase in Q2 for the first time in four quarters. JLL noted that "cyclical challenges persist, but tentative green shoots emerged in the second quarter," citing reduced new supply growth, an uptick in leasing activity and market rent growth, and accelerated demolitions and conversions of older vintage product, which together "point to the increasing likelihood that U.S. office vacancy rates will peak over the near term, and begin to decline in 2024."
There were mixed signs on the pricing front, with JLL noting that "the relative scarcity of high-quality space enabled landlords to preserve face rental rates" with asking rents rising 0.6% to $39.29/SF in Q2, but the increase was "offset by concession packages that eclipsed all-time highs." At the national level, JLL reports that while asking rents are roughly flat since the start of the pandemic, effective market rents have declined by 6.3% as concessions continue to be on the rise. Term-adjusted rent abatement periods have grown 26.8% since the outset of the pandemic to nearly 10 months, on average, while tenant improvement allowances have grown 18.8% over the past three years to an average of $80/SF on a ten year lease. Space availability in sublet markets also continued to swell - rising to a record 142.2 million SF at the end of Q2, with technology firms driving the increase in available sublet space.
JLL's data also reveals substantial dispersion in industry-level leasing activity. Notably, banking and finance leasing activity - a key industry segment in the NYC office market - was only 17% below pre-pandemic levels over the last twelve months while technology and media leasing activity - key industries for West Coast markets - have plunged by more than 50%. JLL notes that select countercyclical industries are seeing more stability - and some even growing - with government, aerospace/defense, energy, and utility companies leading the way. Another positive for Sunbelt markets, JLL notes that "energy-dominant markets" including Houston and others in the "Energy Corridor" have seen stronger year-over-year than any other submarket cluster.
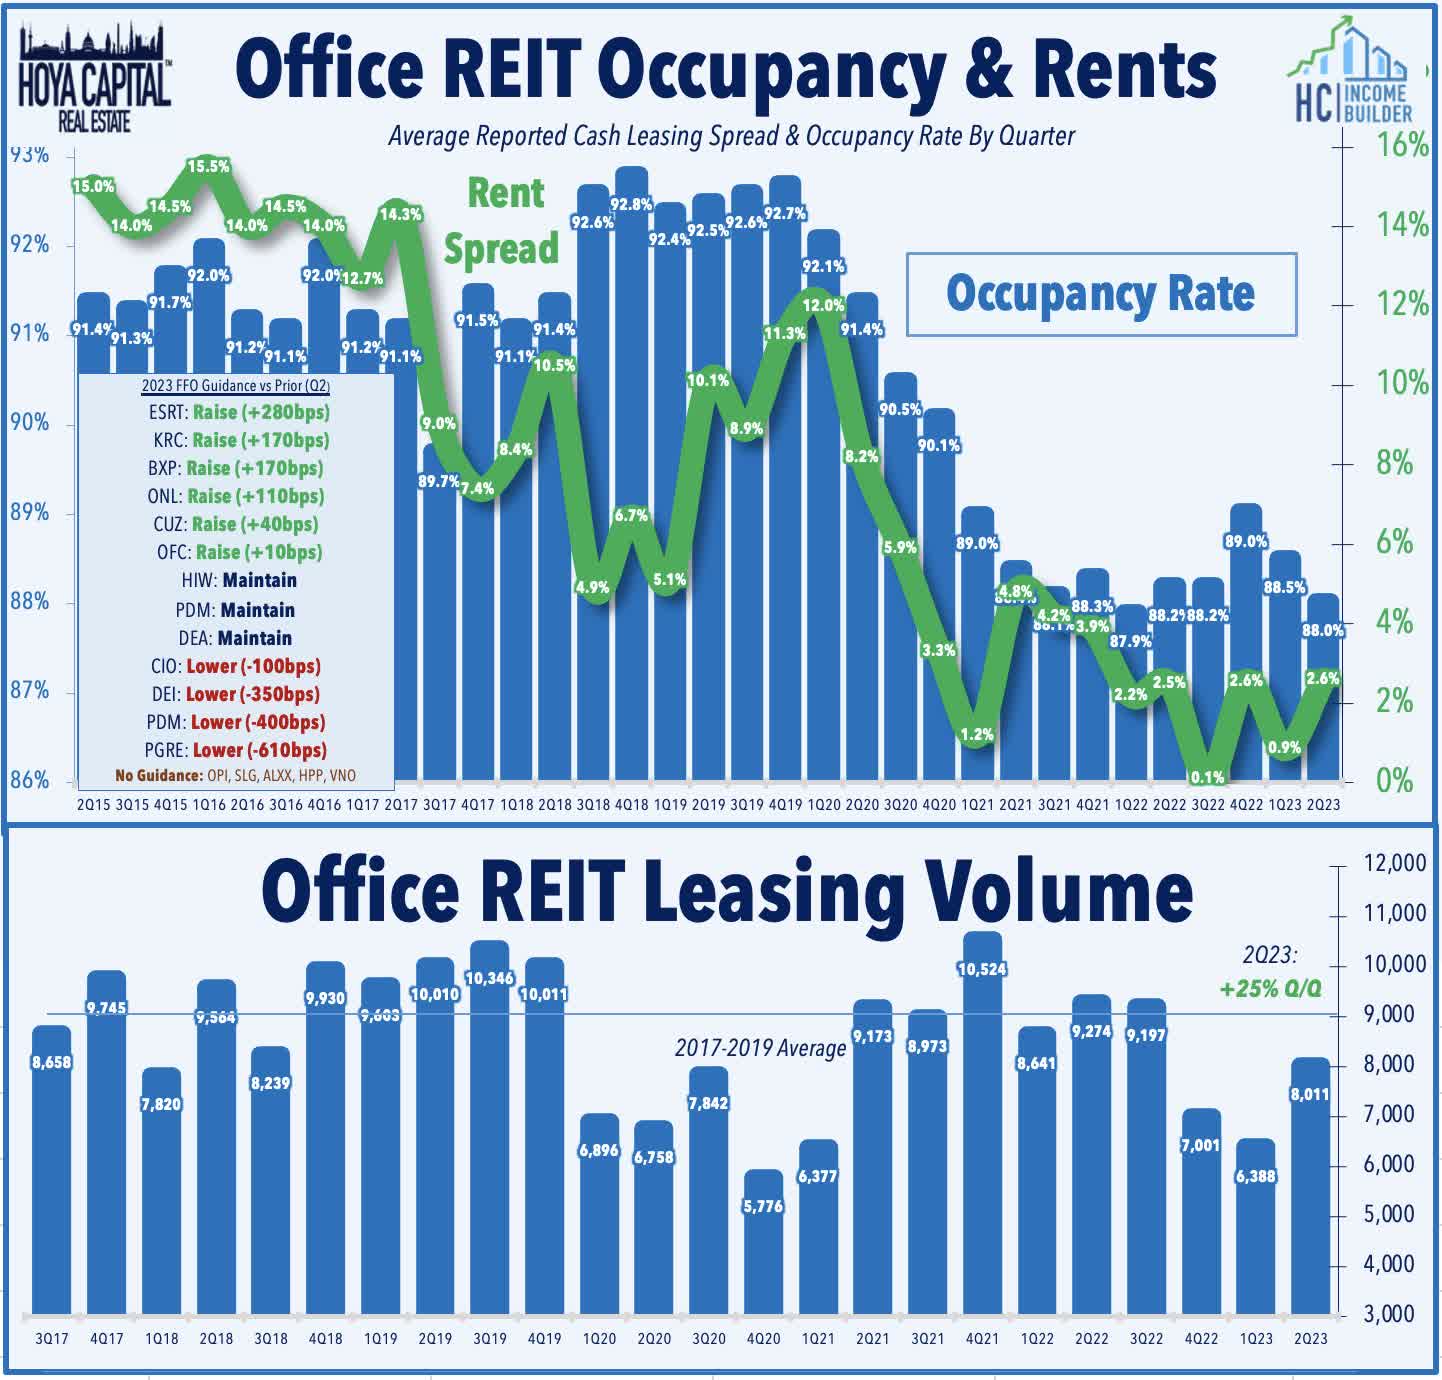
These trends have been consistent with office REIT earnings results over the past several quarters, which have been defined by
sustained outperformance from Sunbelt REITs and recent outperformance from NYC-focused REITs. As noted in Winners of REIT Earnings Season , the battered office REIT sector led the gains over the past quarter on the heels of a slate of surprisingly solid reports showing that leasing activity and pricing trends do indeed appear to have rebounded in recent months, with total volume trending towards levels that are only slightly below the pre-pandemic averages after two historically weak quarters. Six office REITs raised their full-year outlook this earnings season, five of which were either Sunbelt-focused or NYC-focused REITs. Renewal spreads accelerated to nearly 3% in Q2, led by an impressive 6% average rent growth from Sunbelt-focused REITs. Overall leasing activity rose 25% from the prior quarter to over 8 million square feet, but still roughly 20% below pre-pandemic volumes. However, the regional spread was quite stark: Sunbelt REIT leasing volume was only 5% below pre-pandemic levels, while Coastal REIT leasing volume was 25% below pre-pandemic levels.
Among the notable highlights: The largest office REIT - Boston Properties (BXP) - boosted its full-year FFO and now expects its full-year FFO to decline 3.5%, a 130 basis point improvement from its prior outlook. BXP recorded leasing volume of 938k square feet - up from 660k in the prior quarter - and achieved renewal rent spreads of 6.3% - the strongest since Q2 of 2022. NYC-focused Empire State Realty (ESRT) also was an upside standout, boosting its FFO guidance by a sector-leading 280 basis points, driven by strong leasing volume of 336k square feet - above its pre-pandemic average from 2017-2019 - and achieved effective rent increases of 10.1% on these leases. Sunbelt-focused Cousins (CUZ) also raised its full-year FFO growth outlook and recorded rent growth of 7.9% on leasing volume of 435k square feet - each an acceleration from last quarter. Corporate Office (OFC) - another Sunbelt-focused REIT - raised its full-year FFO outlook and recorded its strongest quarter of leasing activity and occupancy since 2021. Orion Office (ONL) - the office REIT that spun-out from Realty Income following its merger with Vereit - also raised its full-year outlook by 110 basis points to -10.6% from its prior midpoint of -11.7%.
With the exception of Kilroy ( KRC ) - which raised its FFO outlook in Q2 - results from West Coast-focused REITs were notably weaker as were results from non-NYC-focused East Coast REITs. Paramount ( PGRE ) reported very weak results and significantly lowered its full-year outlook driven by the bankruptcy of First Republic - its largest tenant - and deepening distress in the San Francisco office market. PGRE leased just 72k square feet of space in Q2 - 70% below its pre-pandemic average from 2017-2019. Douglas Emmett ( DEI ) downwardly revised its FFO outlook on higher interest expense, while fellow West Coast REIT Hudson Pacific ( HPP ) reported another dismal quarter, pressured by the impact of the Hollywood strike on its studio assets. DC-focused JBG Smith ( JBGS ) reported that it expects significant vacancies in its National Landing property, where it has 1.8 million square feet of office space (27% of annualized rents). JBGS now expects vacancies totaling 1.2 million square feet after Amazon halted plans to expand its "HQ2" earlier this year. Piedmont ( PDM ) lowered its FFO guidance after refinancing $400M in debt at a sharply higher interest rate - 9.25% compared to its maturing 4.45% note, which it followed with a 40% reduction to its dividend.
Office REIT Stock Price Performance
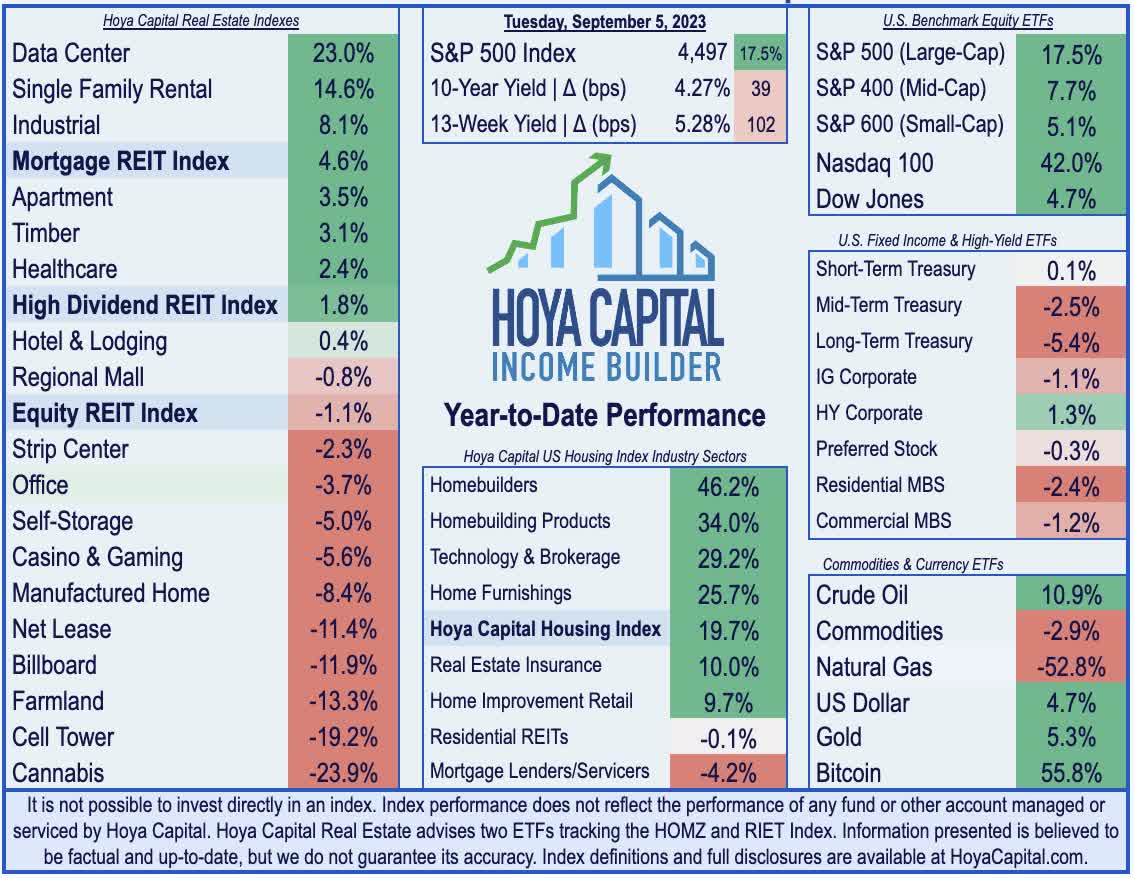
Even with a roughly 20% surge over the past quarter, office REITs remain in negative territory for the year. The Hoya Capital Office REIT Index - a market cap-weighted benchmark of the sector - has declined by roughly 4% this year, lagging the 1% decline from the Vanguard Real Estate ETF ( VNQ ) and significantly lagging the roughly 18% gains from the S&P 500 ( SPY ). Office REITs - which were the weakest-performing sector in 2022 - are seeking to avoid a fourth-straight year of underperformance.
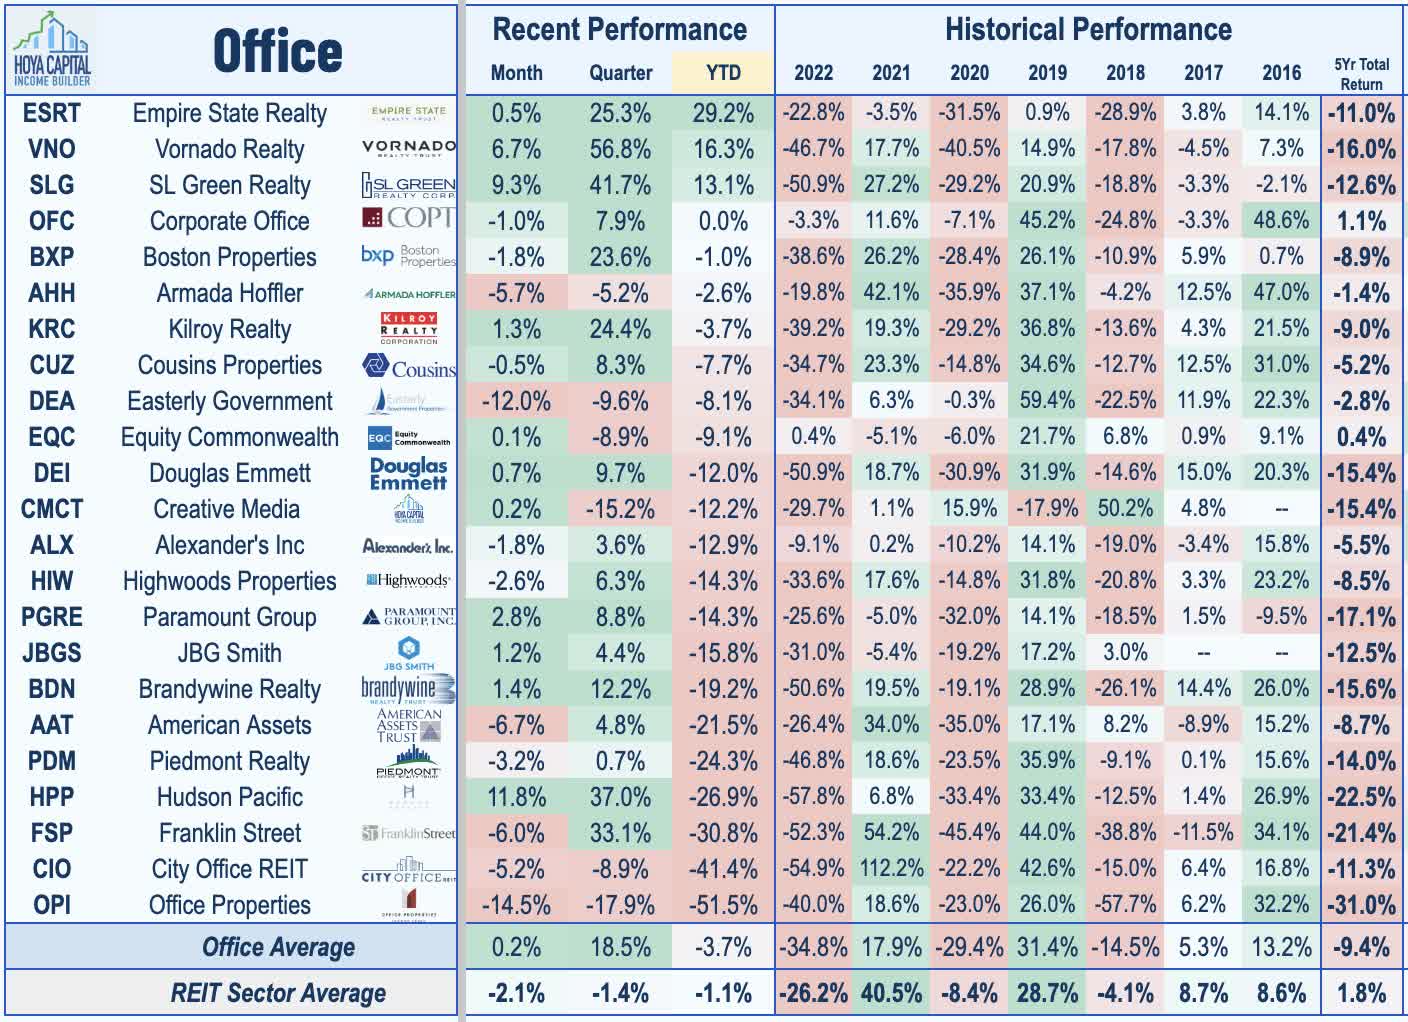
Diving deeper into the performance of these individual REITs - essentially every office REIT finished lower in 2022 while seven REITs declined by 50% or more. Trends are slightly less dire in 2023, as four office REITs are in positive territory for the year, led by three NYC-focused REITs: Empire State Realty , Vornado , and SL Green . A handful of the most highly-levered small-cap office REITs have seen continued sharp selling pressure in 2023 including Office Properties ( OPI ), City Office ( CIO ), and Franklin Street ( FSP ). As noted above, despite the bifurcating fundamentals between Sunbelt-focused office REITs and coastal-focused REITs, the stock performance trends haven't necessarily reflected these trends, and we see compelling value in several of the Sunbelt-heavy REITs that trade at historically deep discounts.
Office REIT Dividend Yields
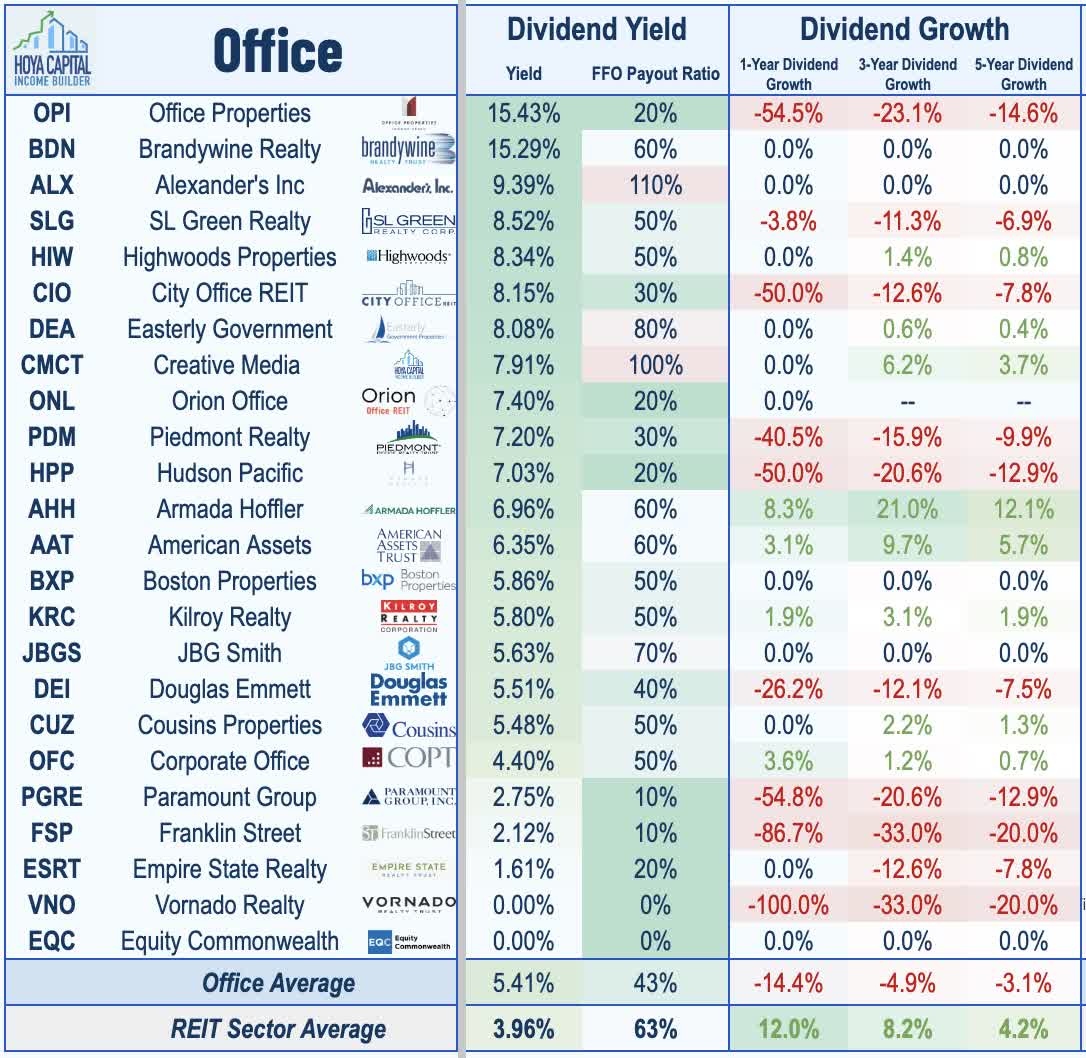
Despite a wave of dividend reductions this year, office REIT still rank as one of the highest-yielding REIT sectors with an average dividend yield of 5.4%. Nine office REITs have reduced their payouts in 2023 - accounting for nearly half of the total REIT sector dividend reductions this year - including an outright dividend suspension from Vornado ( VNO ). Elevated debt levels - and specifically, an above-average use of variable rate debt - was the common thread across the other seven REIT dividend reductions, all but two of which have come from coastal-focused office REITs. On the upside, one office REIT - Corporate Office ( OFC ) - has increased its dividend this year along with two office-focused diversified REITs: Armada Hoffler ( AHH ) and American Assets ( AAT ).
Current payout ratios suggest that these distribution levels should be relatively sustainable as a whole, but several REITs with weaker balance sheets remain at higher risk for a potential dividend cut if fundamentals weaken further. Notably, office REITs have not historically been a high-yielding sector, and thus the attitude of treating dividends as "sacred" is not as evident in office REIT c-suites compared to historically yield-oriented sectors like net lease REITs and healthcare REITs. A wide range of dividend distribution strategies is employed by the 23 REITs within the sector, with yields ranging from 15.4% from Office Properties ( OPI ) and 15.3% from Brandywine ( BDN ) to a low of 0% from Equity Commonwealth ( EQC ) and the aforementioned Vornado Realty .
Takeaways: It's All About the Commute
The office outlook is not as bad as market pricing reflects - but it's not necessarily good either, particularly for the highly-levered players in the space. Since early in the pandemic, we've discussed the importance of commute times - understanding that WFH is ultimately an 'economic' decision and that several major markets have an unavoidable structural issue: it takes too long to get to work - largely a byproduct of decades of bad housing policy and sub-optimal urban planning. Consistent with this thesis, Sunbelt-focused REITs reported leasing activity that was just 5% below 2019 levels on a TTM basis vs. the -25% average decline for coastal-focused REITs. We see many apt parallels with the retail sector - which itself was fundamentally disrupted by e-commerce in the early 2010s. It took a decade - and not all of the retail REITs lived to see it through - but fundamentals eventually stabilized after a decade of near-zero new development. Sunbelt/Secondary Office is akin to Strip Centers, a sector characterized by steady fundamentals, with pockets of strength. Coastal Office is more akin to Malls, where 'Class A' quality is absolutely critical, given inherent structural issues with the format itself.
For an in-depth analysis of all real estate sectors, check out all of our quarterly reports: Apartments , Homebuilders , Manufactured Housing , Student Housing , Single-Family Rentals , Cell Towers , Casinos , Industrial , Data Center , Malls, Healthcare , Net Lease , Shopping Centers , Hotels , Billboards , Office , Farmland , Storage , Timber , Mortgage , and Cannabis.
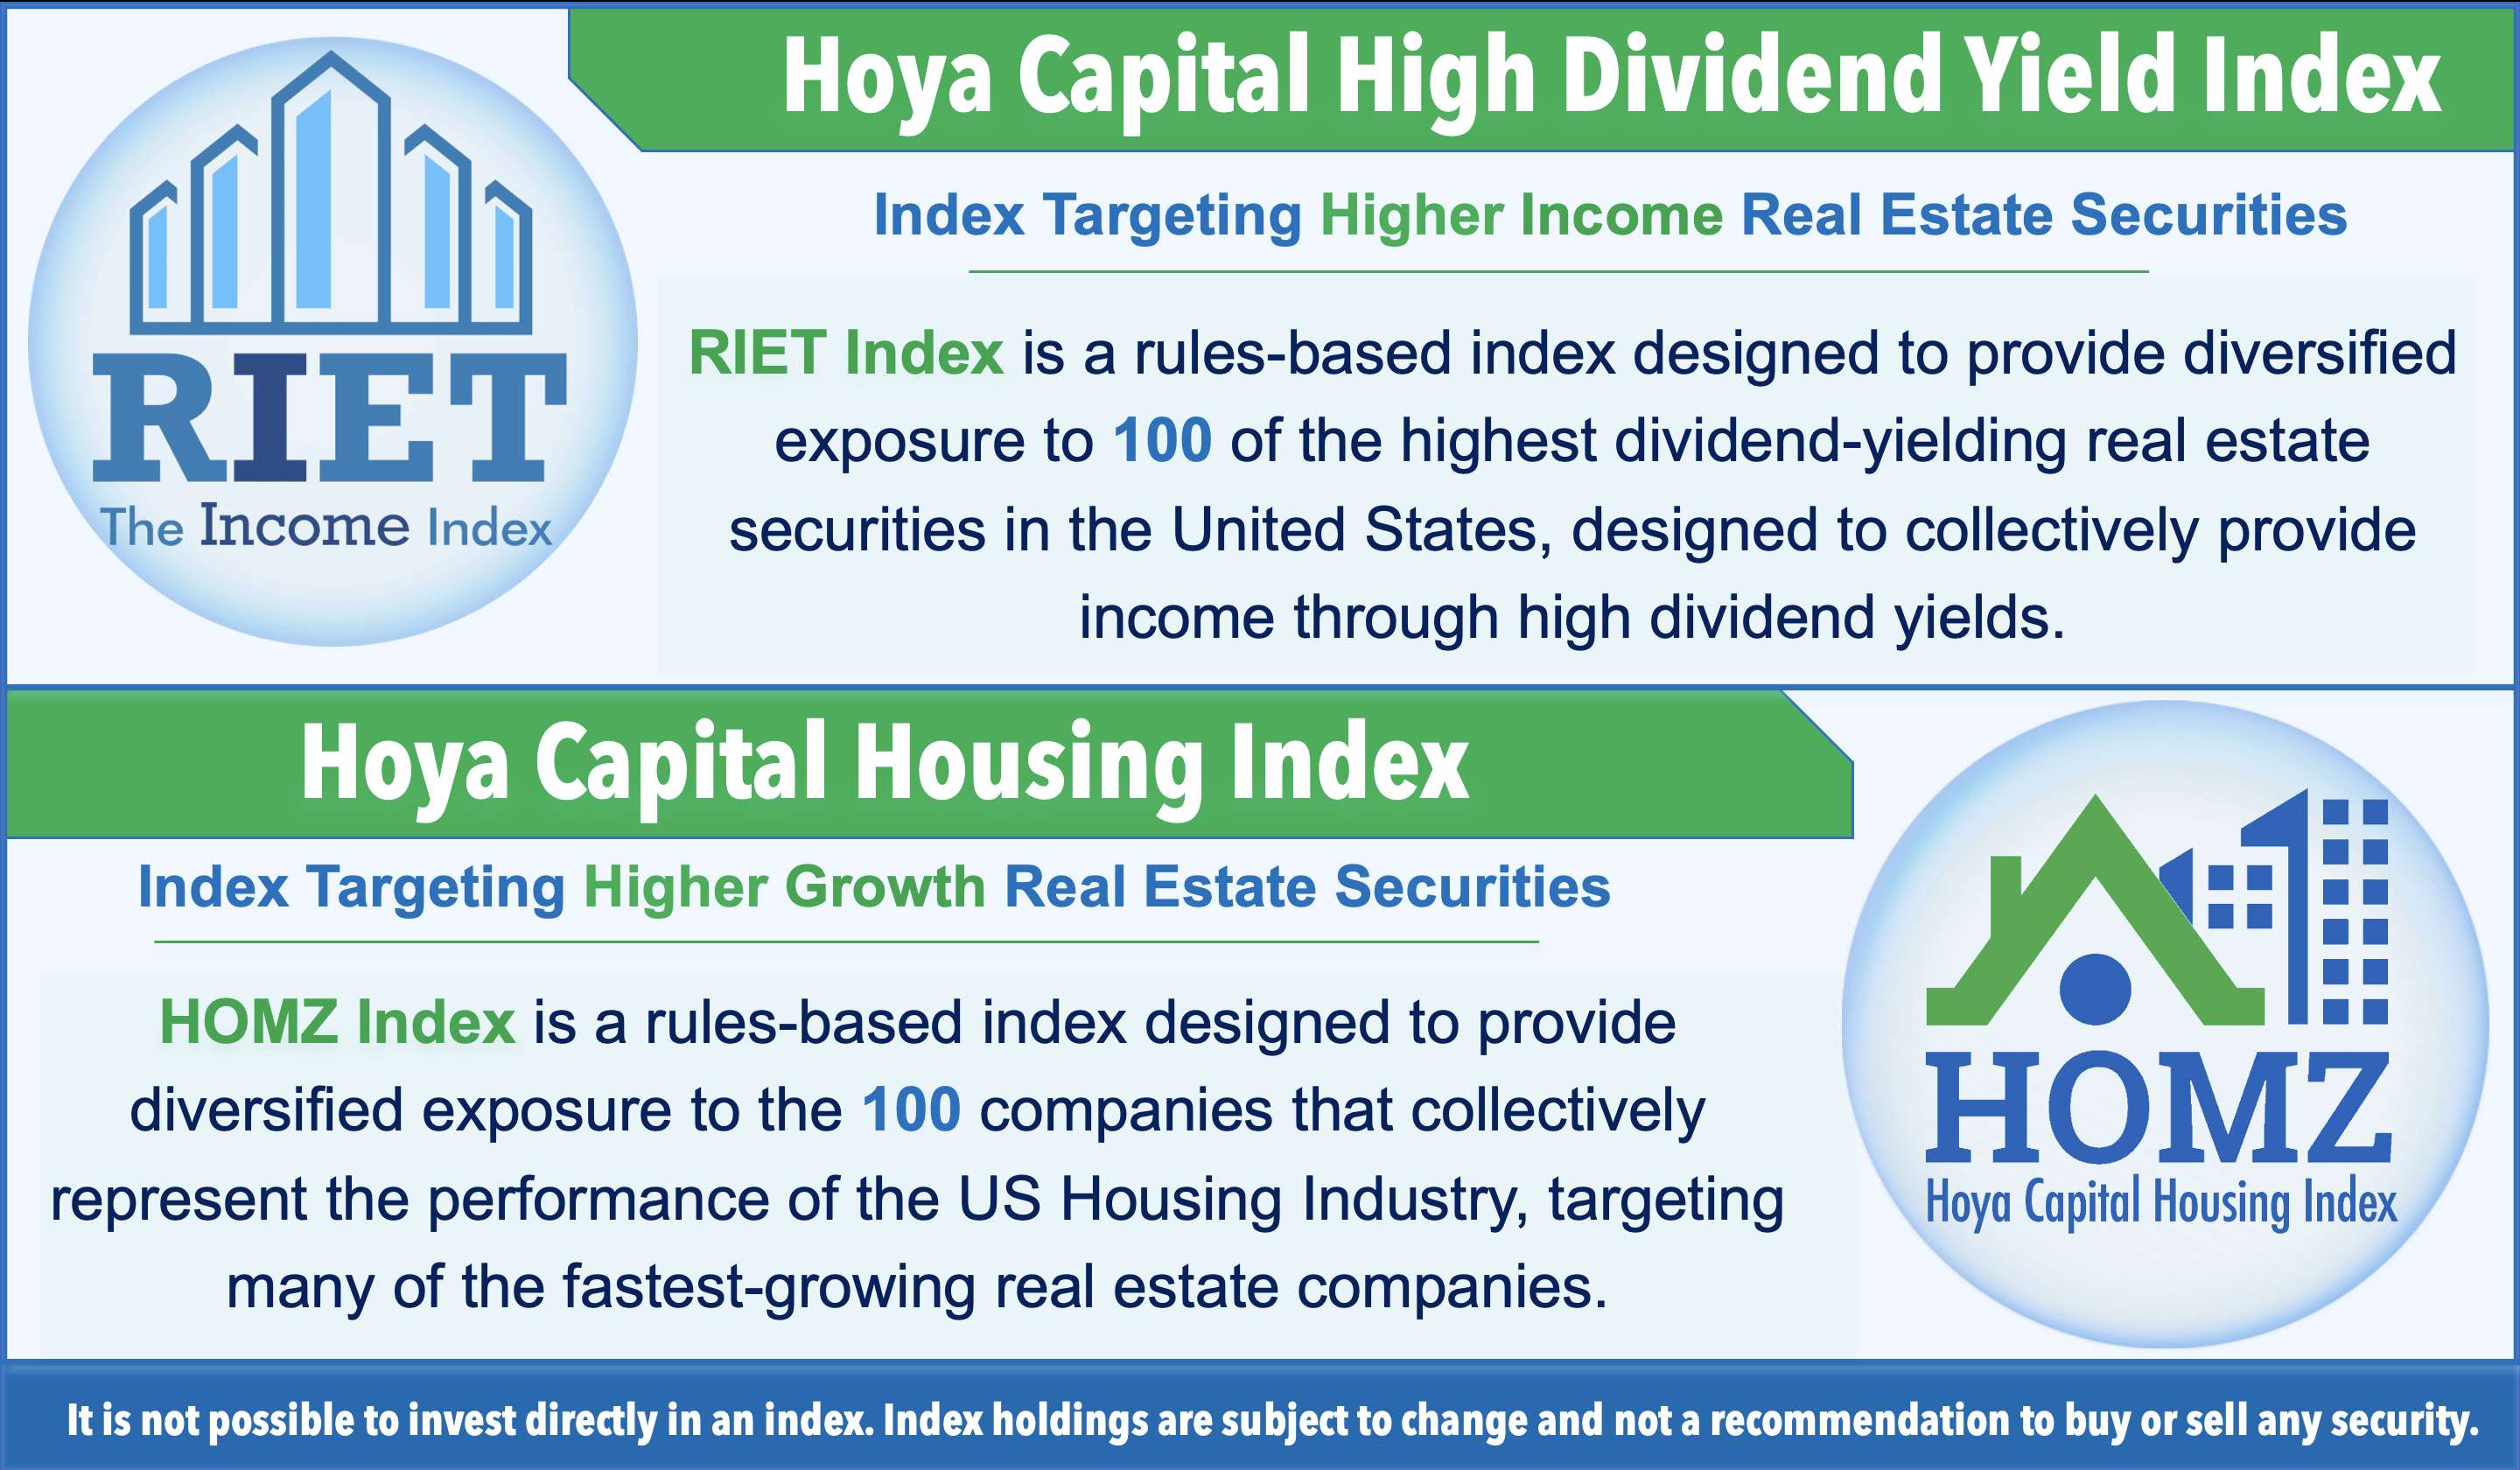
Disclosure : Hoya Capital Real Estate advises two Exchange-Traded Funds listed on the NYSE. In addition to any long positions listed below, Hoya Capital is long all components in the Hoya Capital Housing 100 Index and in the Hoya Capital High Dividend Yield Index . Index definitions and a complete list of holdings are available on our website.
For further details see:
Office REITs: It's All About The Commute